CRGY — AI Stock Forecast & Price Targets
Published 7/17/2026 · A free sample of K3vl4r’s AI-powered analysis.
Kronos price forecasts, scored fundamentals & technicals, and a multi-horizon plan.
View the live CRGY price forecast →
CRGY is a leveraged Permian-weighted E&P trading at 4.7x forward P/E with a 4.6% dividend, showing constructive short-term technicals (+7% since early July, UBS Buy initiation at $13) but carrying $5.37B debt against just $9.8M cash and a Q1 2026 net loss of $420M with negative FCF (-$263M). With the Aug 3 earnings binary ~17 days away and short float rising to 15.2%, the risk/reward argues for HOLD — the setup skews two-sided and does not warrant sizing into the print.
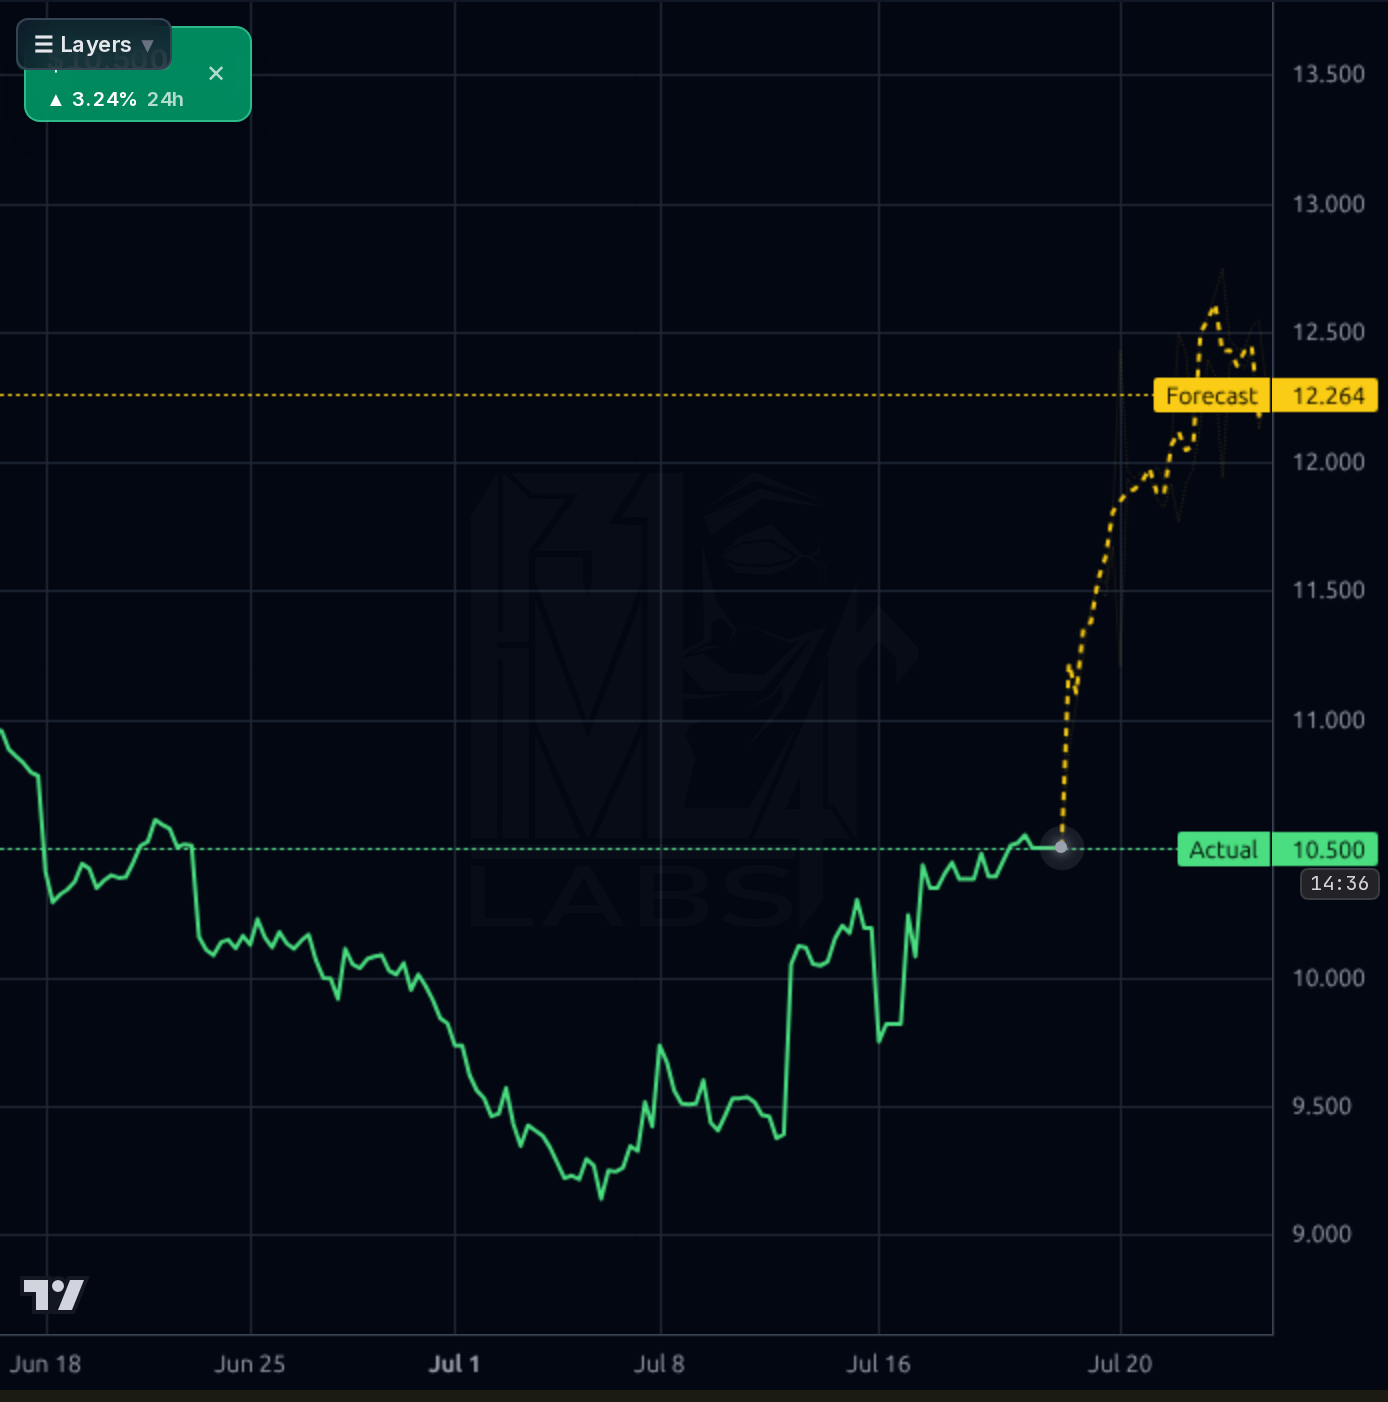
HOLD into the Aug 3 earnings print — do not size a swing trade through the binary. If already long, keep sizing modest; the $9.34-9.50 support band is the hard invalidation. Upside cap into the print is $11.50-12.00 (recent resistance and where the 1H forecast band converges). A break of $9.34 on volume would invalidate the recovery thesis and open $8.20 (bear case). Expect elevated IV crush post-print regardless of direction. Explicit earnings stance: NO NEW SIZING within 5 trading days of Aug 3.
1-6 month expected return range -20% to +25% ($8.20-$13.00). Post-earnings, the swing factors are (1) whether Q2 FCF confirms Q1 capex was a one-time front-loading vs. structural, (2) any updated commentary on debt refinancing schedule, (3) whether the dividend is maintained. Base case: earnings clear the bar, capex normalizes, stock re-rates to $10.80-11.50 range. Bull case: clean beat + Permian guide raise + debt-reduction commentary drives move toward UBS $13 target. Bear case: another FCF miss or dividend cut re-tests $8-9. What changes my mind: a clean Q2 print with FCF back above $200M and management guiding to net debt reduction would justify an upgrade to ACCUMULATE.
1-3 year thesis hinges on de-leveraging execution. Permian assets are legitimate long-life inventory and KKR sponsorship provides operational discipline; if the company can generate $600-800M annualized FCF at strip prices and channel meaningfully toward debt paydown, current 4.7x forward P/E and 0.73x book represent significant re-rating optionality toward $16-18. The biggest structural risk is oil price cyclicality intersecting with high leverage — a WTI move to $55 or lower would compress cash flows and force either dividend cuts or distressed refinancing given the $5.37B debt stack. Secondary risk: capex discipline slippage that keeps FCF perpetually swallowed by growth investment, deferring the de-leveraging story indefinitely.
Revenue is the clear positive: Q1 2026 came in at $1.18B, up ~37% QoQ from $865M, with TTM sales of $3.81B (+18% Y/Y) driven by Permian volume ramp. However, earnings quality has deteriorated sharply — Q1 posted a $420M net loss (-35% net margin) versus profitable Q2 2025 ($153M), and TTM EPS is -$0.74. The balance sheet is the central concern: $5.37B total debt against just $9.8M cash, debt/equity of 1.12x, current ratio 0.57 (working capital deficit of -$672M), and enterprise value of $8.66B. Cash flow quality is mixed — operating cash flow remains healthy ($1.75B TTM, $409M in Q1) but Q1 capex spiked to $672M, driving FCF to -$263M vs. positive $200M+ in each of the prior three quarters. Dividend payout of 88.7% on negative TTM EPS is mathematically strained, though it's covered on an FCF basis if capex normalizes. Trades at 0.73x book, 5.04x P/FCF, EV/EBITDA 4.78x — cheap on every metric except earnings, which reflects the leverage overhang.
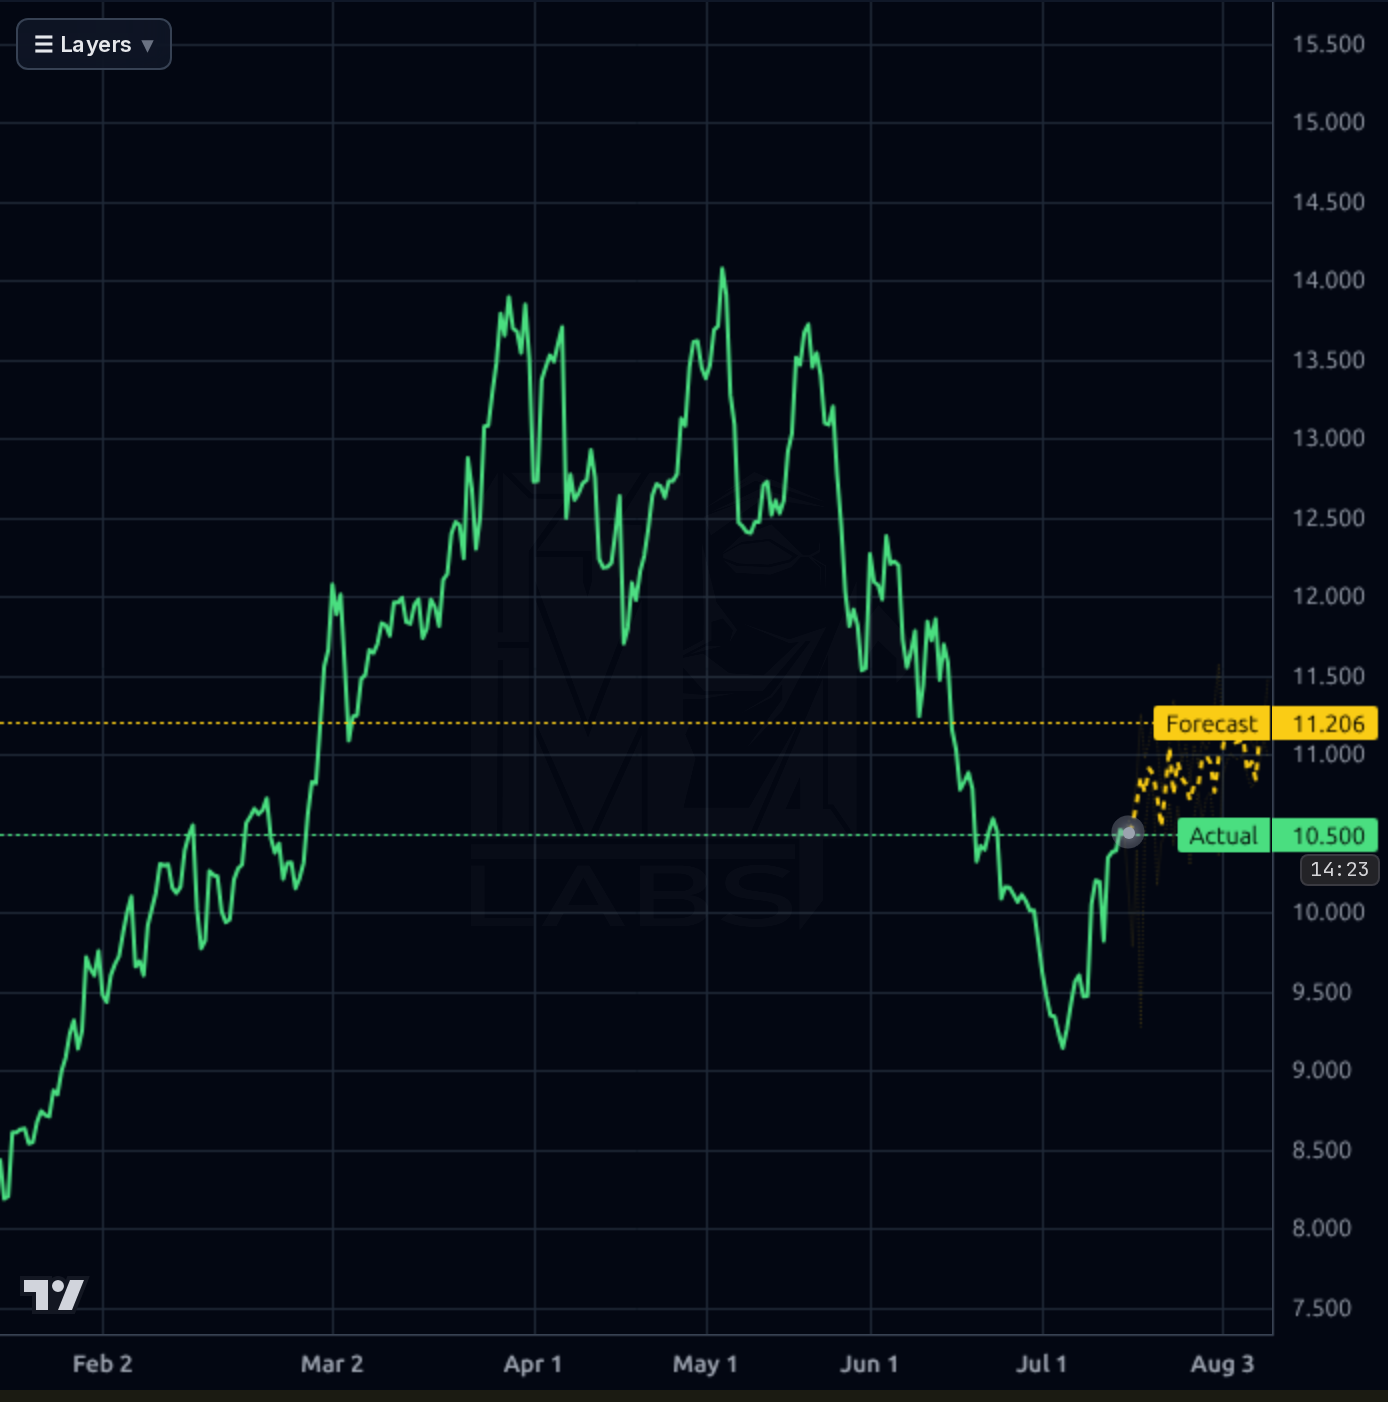
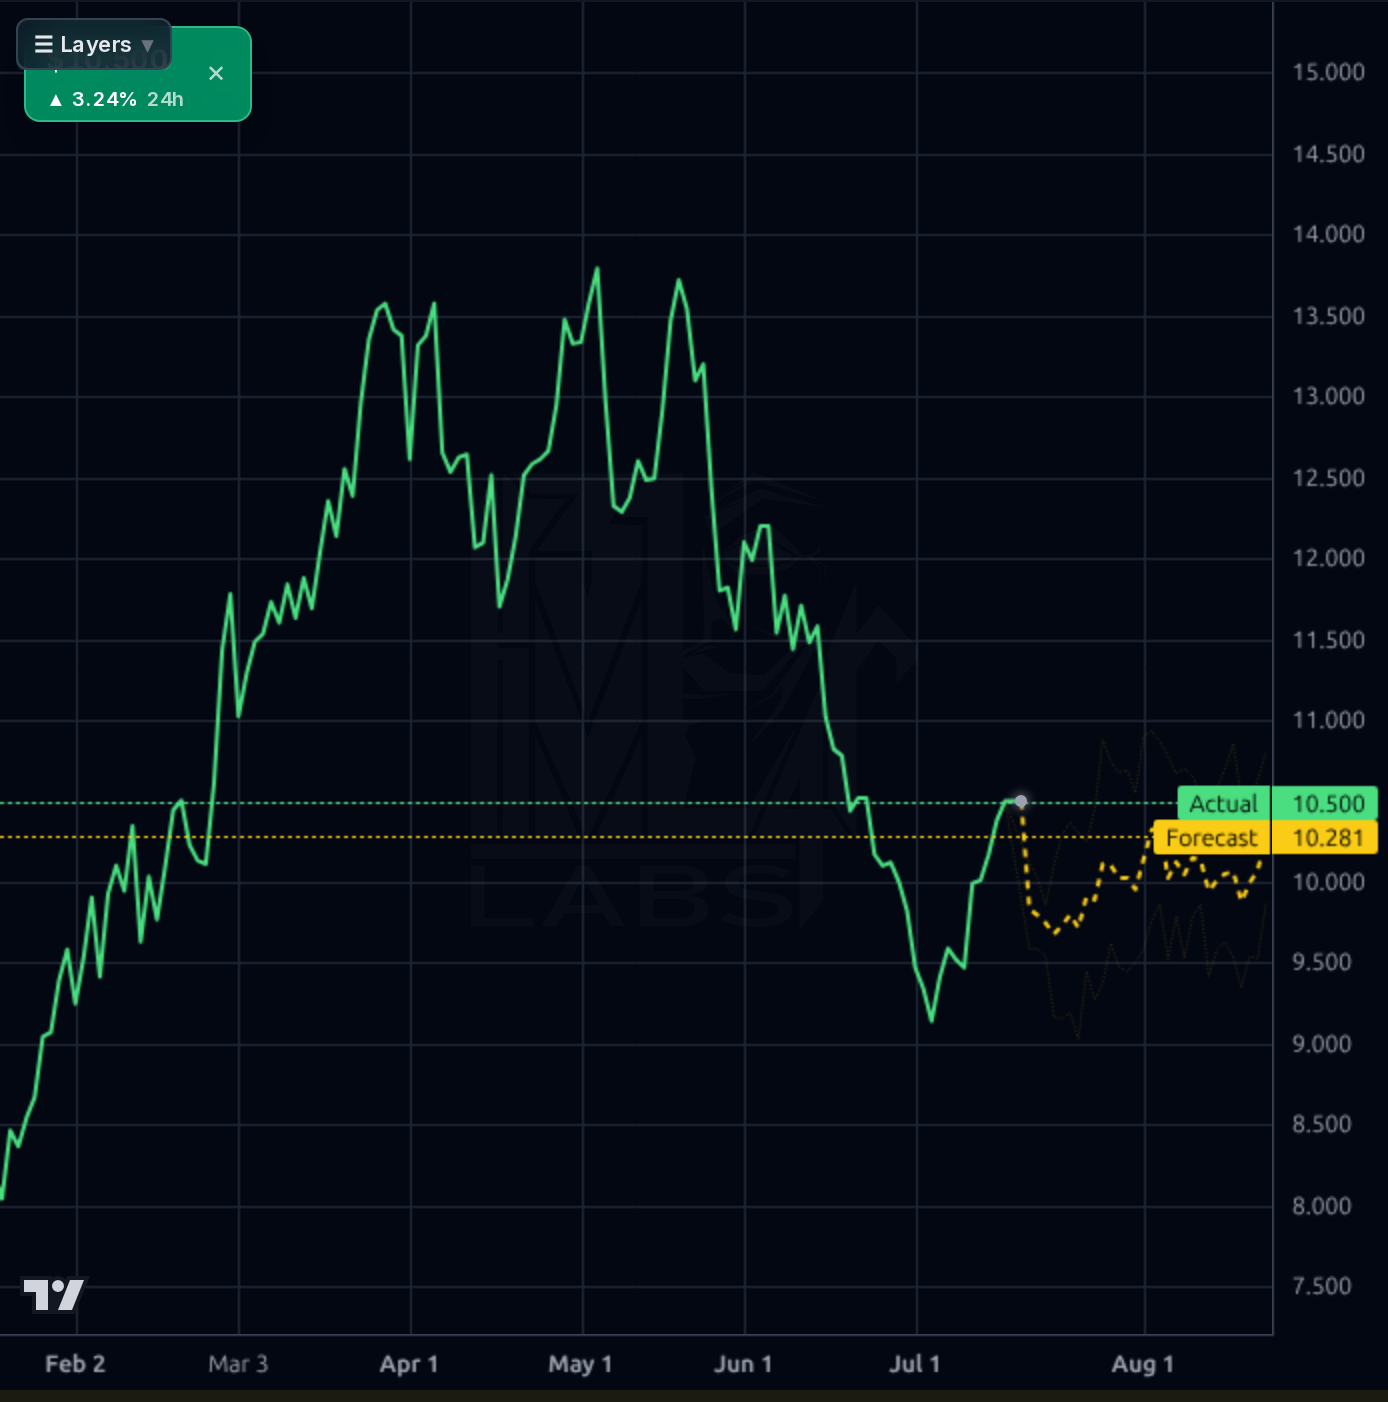
Cross-timeframe picture is constructive but not confirmed. The 1D chart shows a V-bottom from the July $9.20 low back to $10.50, breaking above the down-sloping trend that dominated May-June; price is +4.3% over SMA20 but still -8.75% under SMA50 and roughly flat vs. SMA200, indicating early recovery not a confirmed uptrend. The 1H chart shows a clean impulse from $9.35 to $10.50 with the model projecting continuation toward $12.26 (bull band $12.50+). However, the 1D model forecast is far more muted at $10.28 (below spot) and the 4H forecast at $11.21, and critically the 1wk model has been beaten by naive baseline (50% vs 67%), so I discount the aggressive 1H forecast. RSI 50.1 is neutral with room to run. Key levels: support $9.34-9.50 (tested and held), resistance $11.50-12.00 (May/June breakdown zone), then $13-14 (52w high $14.29). Perf Week +9% and Perf YTD +23.7% show momentum has turned; short float 15.2% and short ratio 6.6 create squeeze fuel.
The key signal is UBS initiating coverage with a Buy and $13 price target on July 15, which is likely the proximate catalyst behind the recent bounce and provides sell-side validation for the FCF-and-KKR-sponsorship thesis. Seeking Alpha and Insider Monkey pieces echo the 'too cheap to ignore' framing (Bill Miller/Miller Value ownership disclosed, Strong Buy rating), and Zacks flagged a positive earnings surprise history heading into Aug 3. The SEC 8-K on hedging cash flows is procedural but worth noting given commodity leverage. Signal-vs-noise: the UBS initiation and consistent 'cheap FCF story' from independent analysts are the real signals — this is a coordinated sell-side/value-community push. The noise is retail social sentiment (100% bullish of a tiny tagged sample, with WhatsApp-group spam being the loudest voices — a contrarian yellow flag). Fundamental-change signals are net negative: short float ticked up 2.4pp to 15.2% and forward-year EPS estimate was cut from +1.3% to -7.1% in the last 45 days, which contradicts the bullish narrative and validates caution into the print.
- Permian volume ramp driving Q1 2026 revenue to $1.18B (+37% QoQ), extending the top-line growth trajectory that underpins the FCF thesis
- UBS Buy initiation with $13 PT (July 15) provides institutional sell-side validation and could seed further coverage upgrades
- KKR sponsorship and Miller Value Partners' top-holding disclosure (July 12) signal continued institutional accumulation at current valuation
- Aug 3 earnings — Zacks flags positive surprise history; a clean beat with normalized capex would validate the FCF-de-leveraging path
- Dividend yield of 4.6% at current price is a re-rating floor IF cash flow stabilizes and payout is maintained through the print
- EV/EBITDA of 4.78x vs sector norm 6-8x offers M&A optionality given KKR relationships
- Balance sheet stress: $5.37B debt against $9.8M cash and -$672M working capital — refinancing risk is real if credit conditions tighten
- Q1 2026 posted a $420M net loss and -$263M FCF (capex spike to $672M) — if Q2 doesn't normalize, the FCF thesis breaks
- Dividend sustainability: 88.7% payout on negative TTM EPS; a cut would trigger yield-investor exodus and gap-down
- Aug 3 earnings binary ~17 days out — historical post-earnings volatility on this name is sharp
- Short float rose 2.4pp to 15.2% and forward-year EPS estimates were cut 8.3pp — smart money is positioning bearish into the print
- Commodity leverage: WTI weakness would compound the debt problem given negative operating margins in the market snapshot
- Retail sentiment is 100% bullish on a small sample with WhatsApp-pump characteristics — contrarian caution warranted
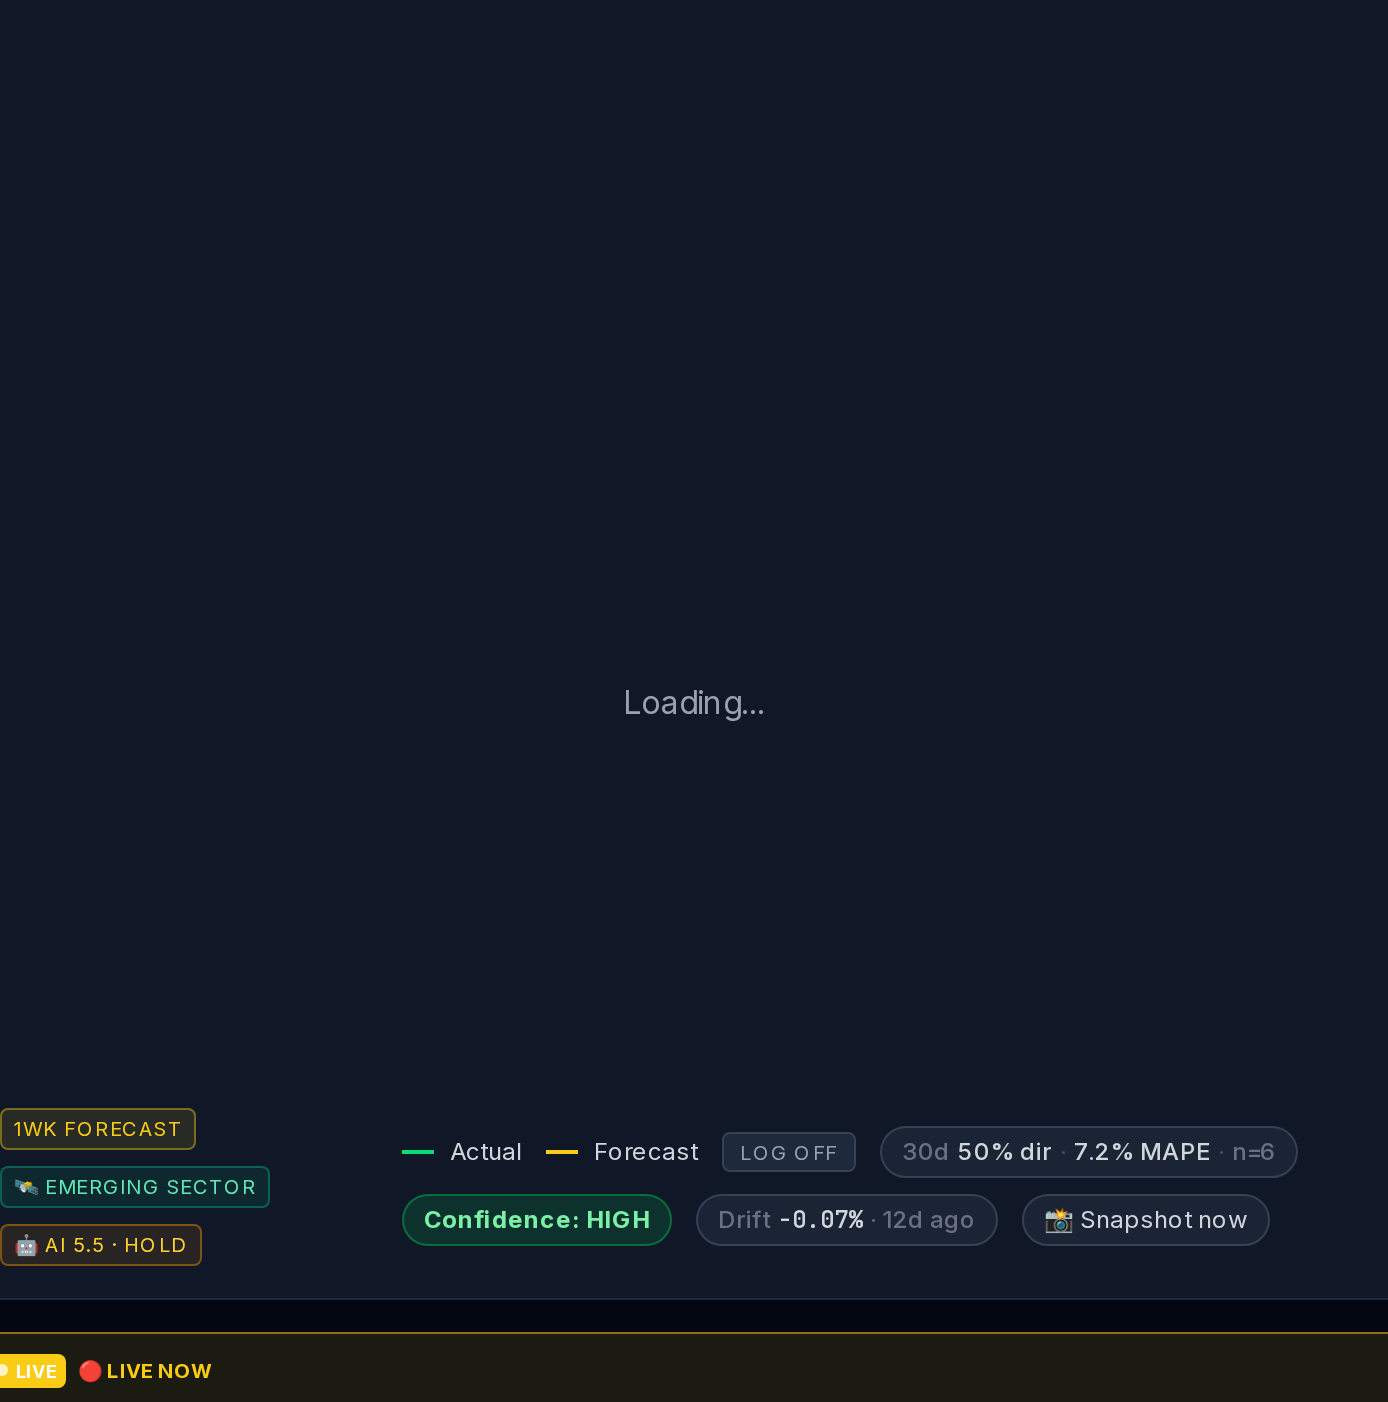
- Model's 1wk forecast has been beaten by naive baseline (50% vs 67%) — don't lean on the bullish AI projection
Get AI analysis on any stock
This is one of hundreds of Kronos AI reports — scored fundamentals & technicals, bull/base/bear price targets, a multi-horizon plan, and continuously-updated forecasts across the market. Create a free account to explore them all.
Create your free account →Already a member? Sign in · Join our Discord