CRGY — AI Stock Forecast & Price Targets
Published 7/16/2026 · A free sample of K3vl4r’s AI-powered analysis.
Kronos price forecasts, scored fundamentals & technicals, and a multi-horizon plan.
View the live CRGY price forecast →
CRGY is a leveraged E&P turnaround story trading at 4.7x forward P/E with a 4.7% dividend, showing early technical recovery (+7% since last call) but facing an imminent Aug 3 earnings binary event. UBS just initiated with a Buy and $13 PT, but Q1 2026 swung to a $420M net loss and free cash flow turned negative (-$263M), so the valuation-versus-execution tension remains unresolved.
HOLD into earnings. Price at $10.17 with Aug 3 print ~18 days away — this is a binary IV-crush event and the LESSON here explicitly warns of sharp post-earnings selloffs. Do not add before the print. If already long, tight risk: invalidation on a daily close below $9.34 (recent support); upside cap $10.80-11.10 pre-earnings (forecast + UBS PT gravitational pull). Any pre-earnings rip toward $11 is a trim opportunity, not an add. Key catalyst/invalidation: Aug 3 EPS (consensus $0.58) and FCF guidance — a repeat of Q1's -$263M FCF would break the thesis.
1-6 months, cautiously constructive if earnings clear. Base case is CRGY oscillates $9-12 with the UBS $13 PT providing an upside anchor if Q2 shows FCF back in the black and capex normalizes off the Q1 spike. Expected return range -15% to +25%. Positive catalysts: Q2 print, Permian production ramp, potential debt refinancing announcement, oil price stability. Mind-changers: a dividend cut (payout 88.7% is unsustainable if FCF stays negative), a second consecutive negative FCF quarter, or D/E climbing further. If Aug 3 delivers, ACCUMULATE on any pullback to $9.50-9.80 with a $12-13 target.
1-3 year terminal thesis rests on whether KKR-backed management can convert the acquired asset base into durable positive FCF and de-lever from $5.4B debt. Multi-year drivers: Eagle Ford/Permian/Uinta synergies, mineral royalty portfolio cash flow, mid-cycle oil price ($70-80 WTI). If they execute, fair value is $14-16 (in line with UBS target and 52w high). Biggest structural risk is a sustained oil down-cycle combined with covenant pressure — with $5.24B debt vs $1.49B EBITDA (3.5x), a 20% commodity drawdown could force asset sales or an equity raise that permanently impairs shareholders. This is a leveraged bet on commodity stability, not a compounder.
Revenue is scaling meaningfully — Q1 2026 hit $1.18B, up ~32% QoQ from $865M and +18% Y/Y TTM — reflecting Permian expansion and acquisition-driven volume. However, quality deteriorated sharply: Q1 2026 posted a $420M net loss and negative EBITDA (-$42.7M) versus $370M EBITDA the prior quarter, while operating cash flow rose to $409M but capex ballooned to $672M, driving FCF to -$263M (versus +$235M in Q4 2025). Balance sheet is stretched: $5.37B total debt against just $9.8M cash, D/E of 1.12, current ratio 0.57, and negative working capital of -$672M. On the positive side, TTM FCF is still $629M (P/FCF 4.94), gross margin at the segment level is holding ~80%, and Finviz shows EV/EBITDA of 4.74 — cheap if normalized earnings return. The 88.7% dividend payout ratio and negative TTM EPS (-$0.74) make the 4.72% yield look fragile without cash flow stabilization. This is a classic value-vs-leverage setup where the forward P/E of 4.75 and P/B of 0.72 only work if 2026-2027 execution delivers.
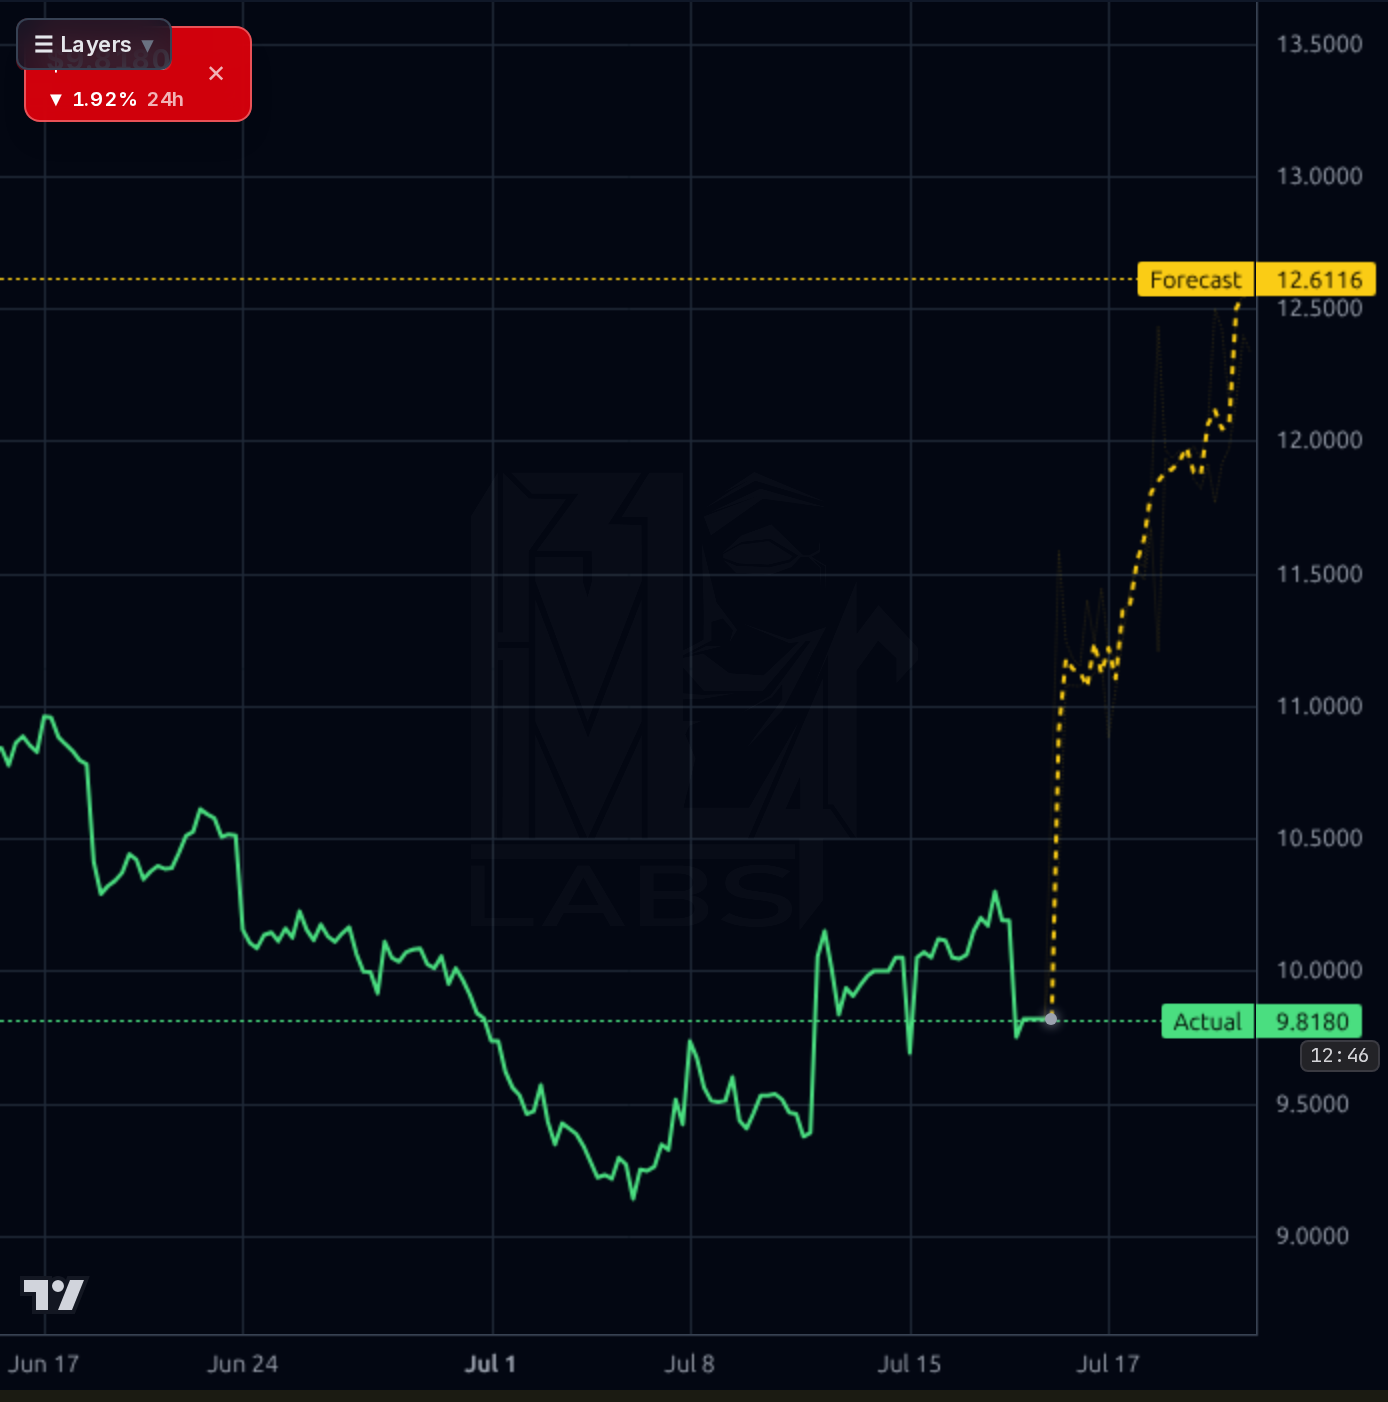
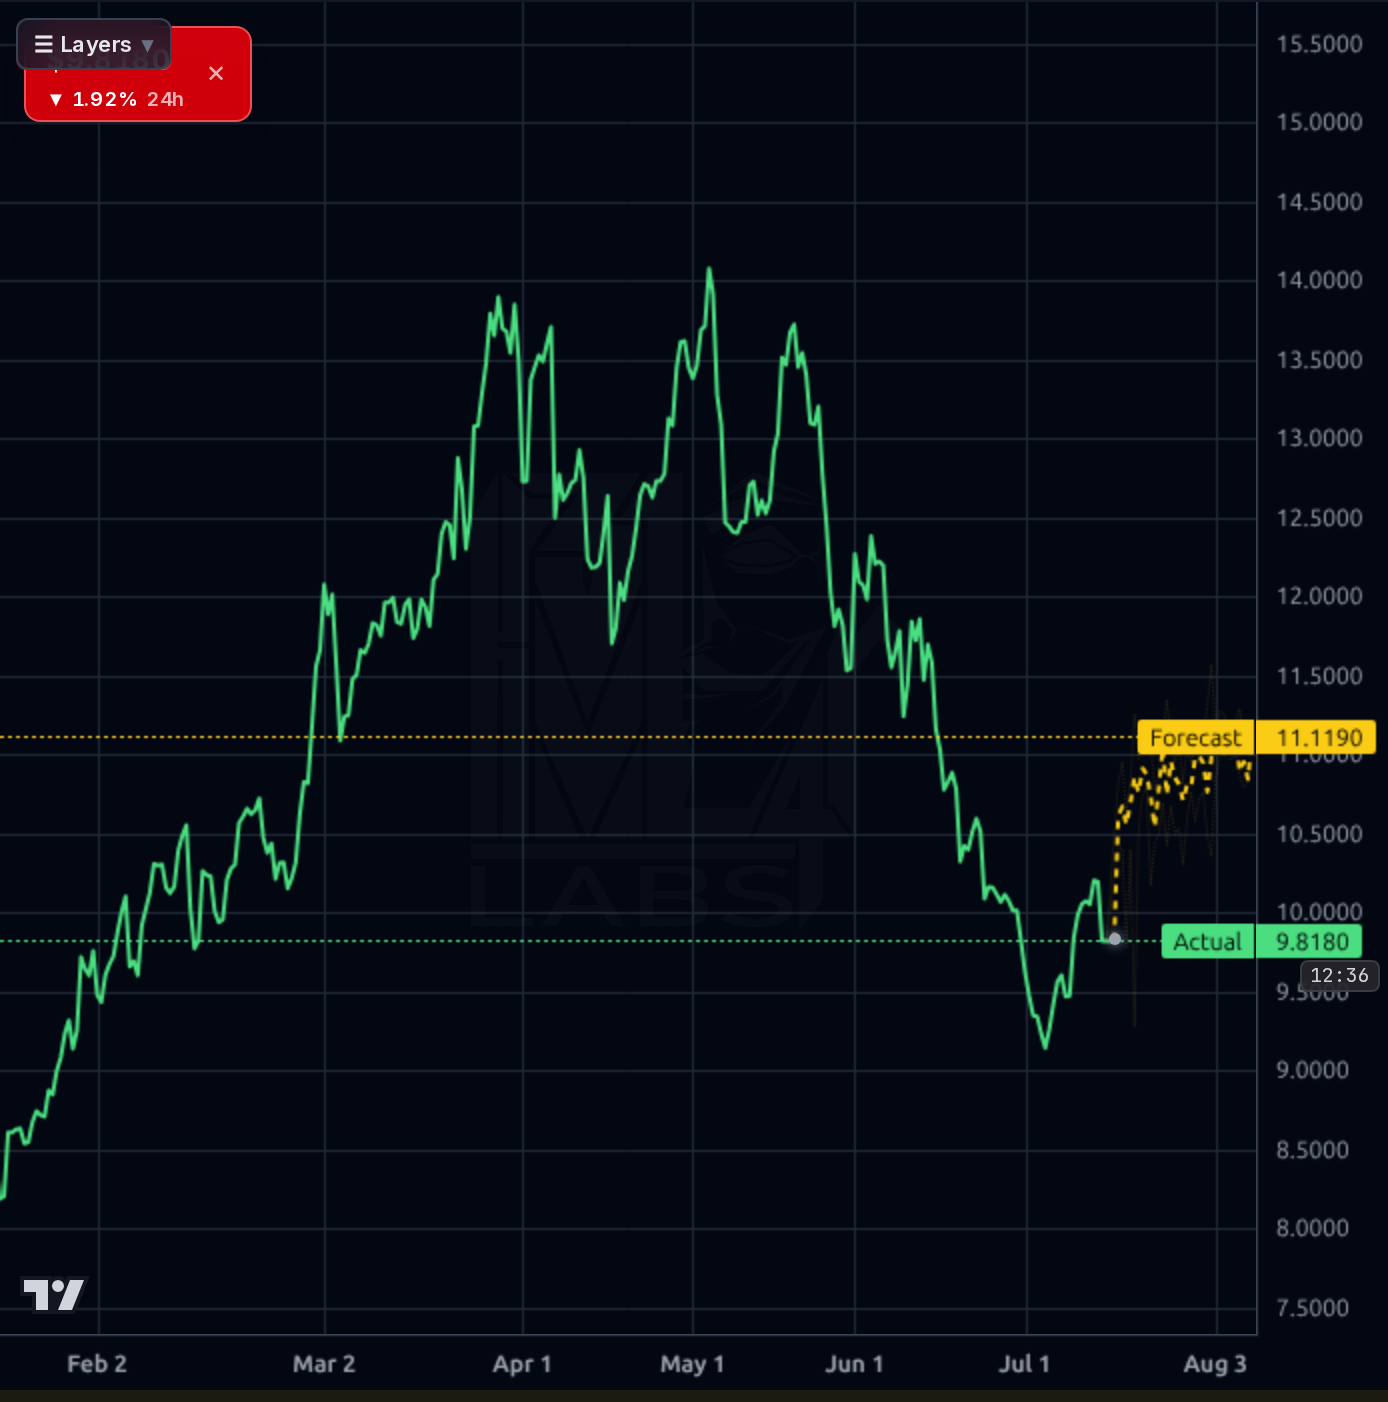
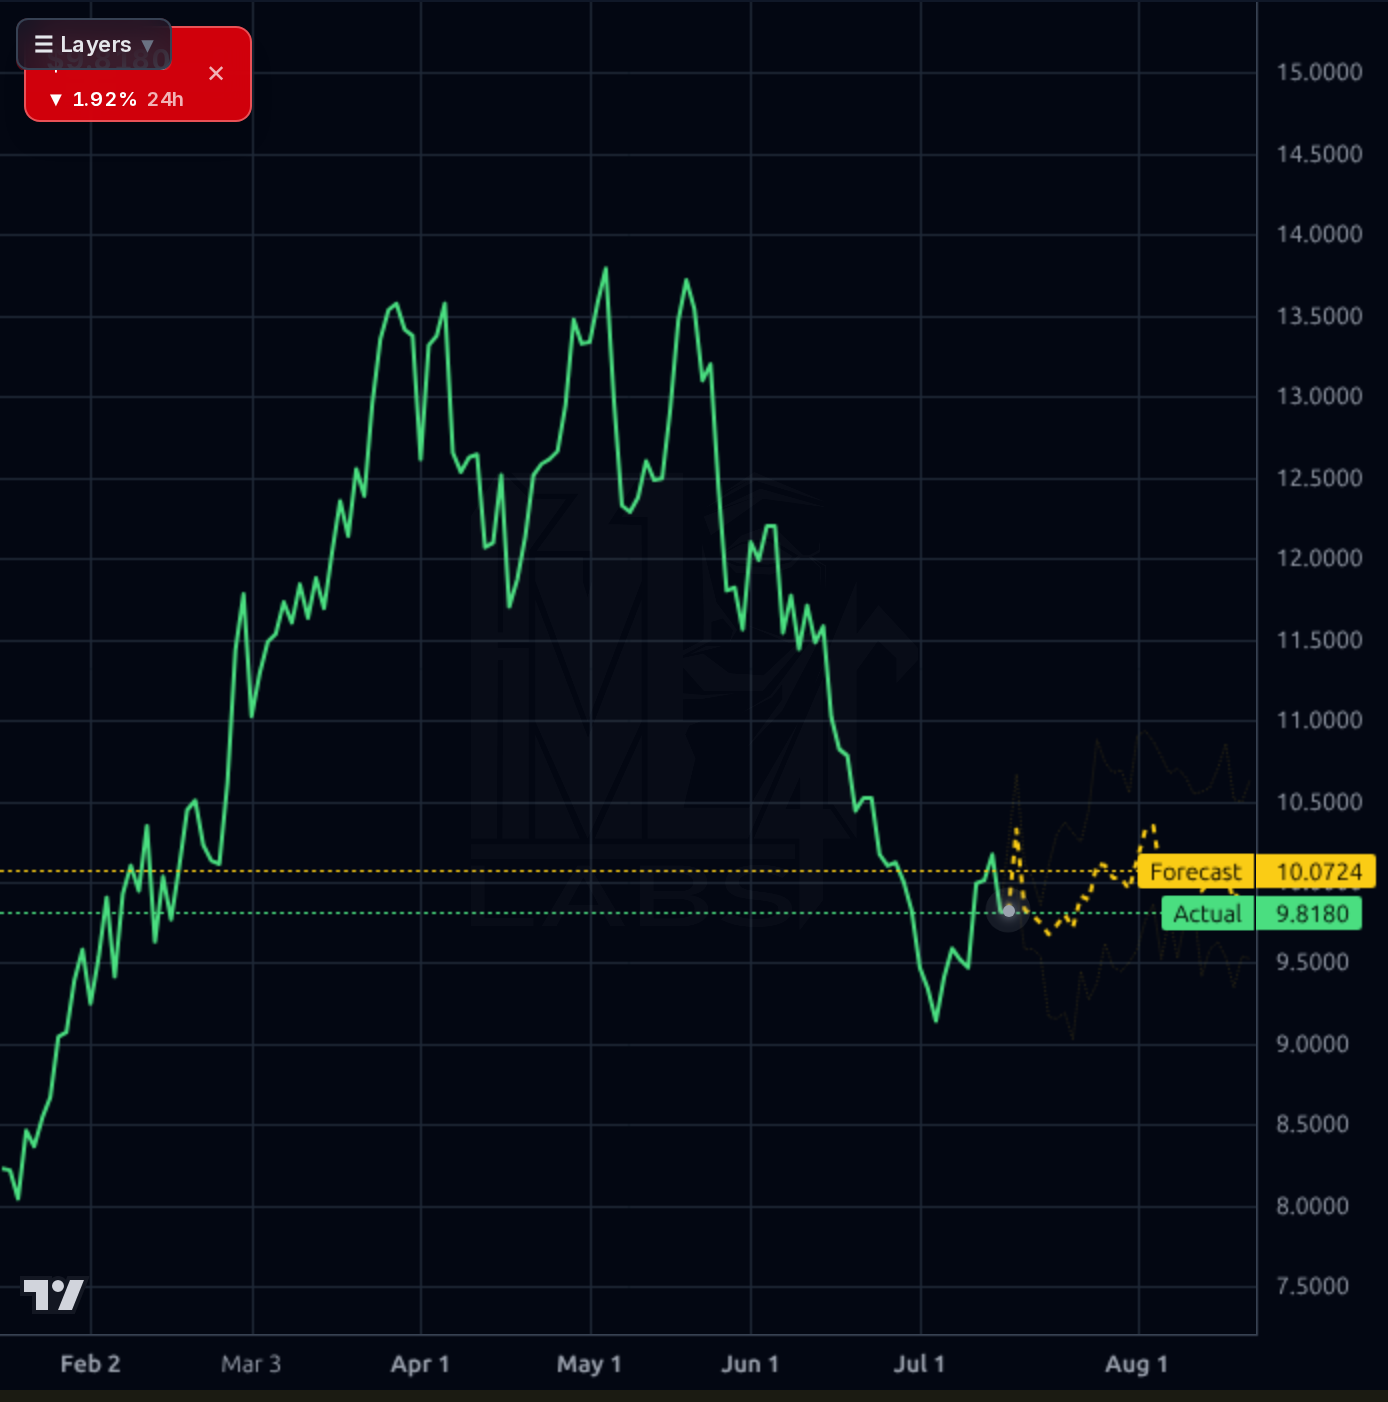
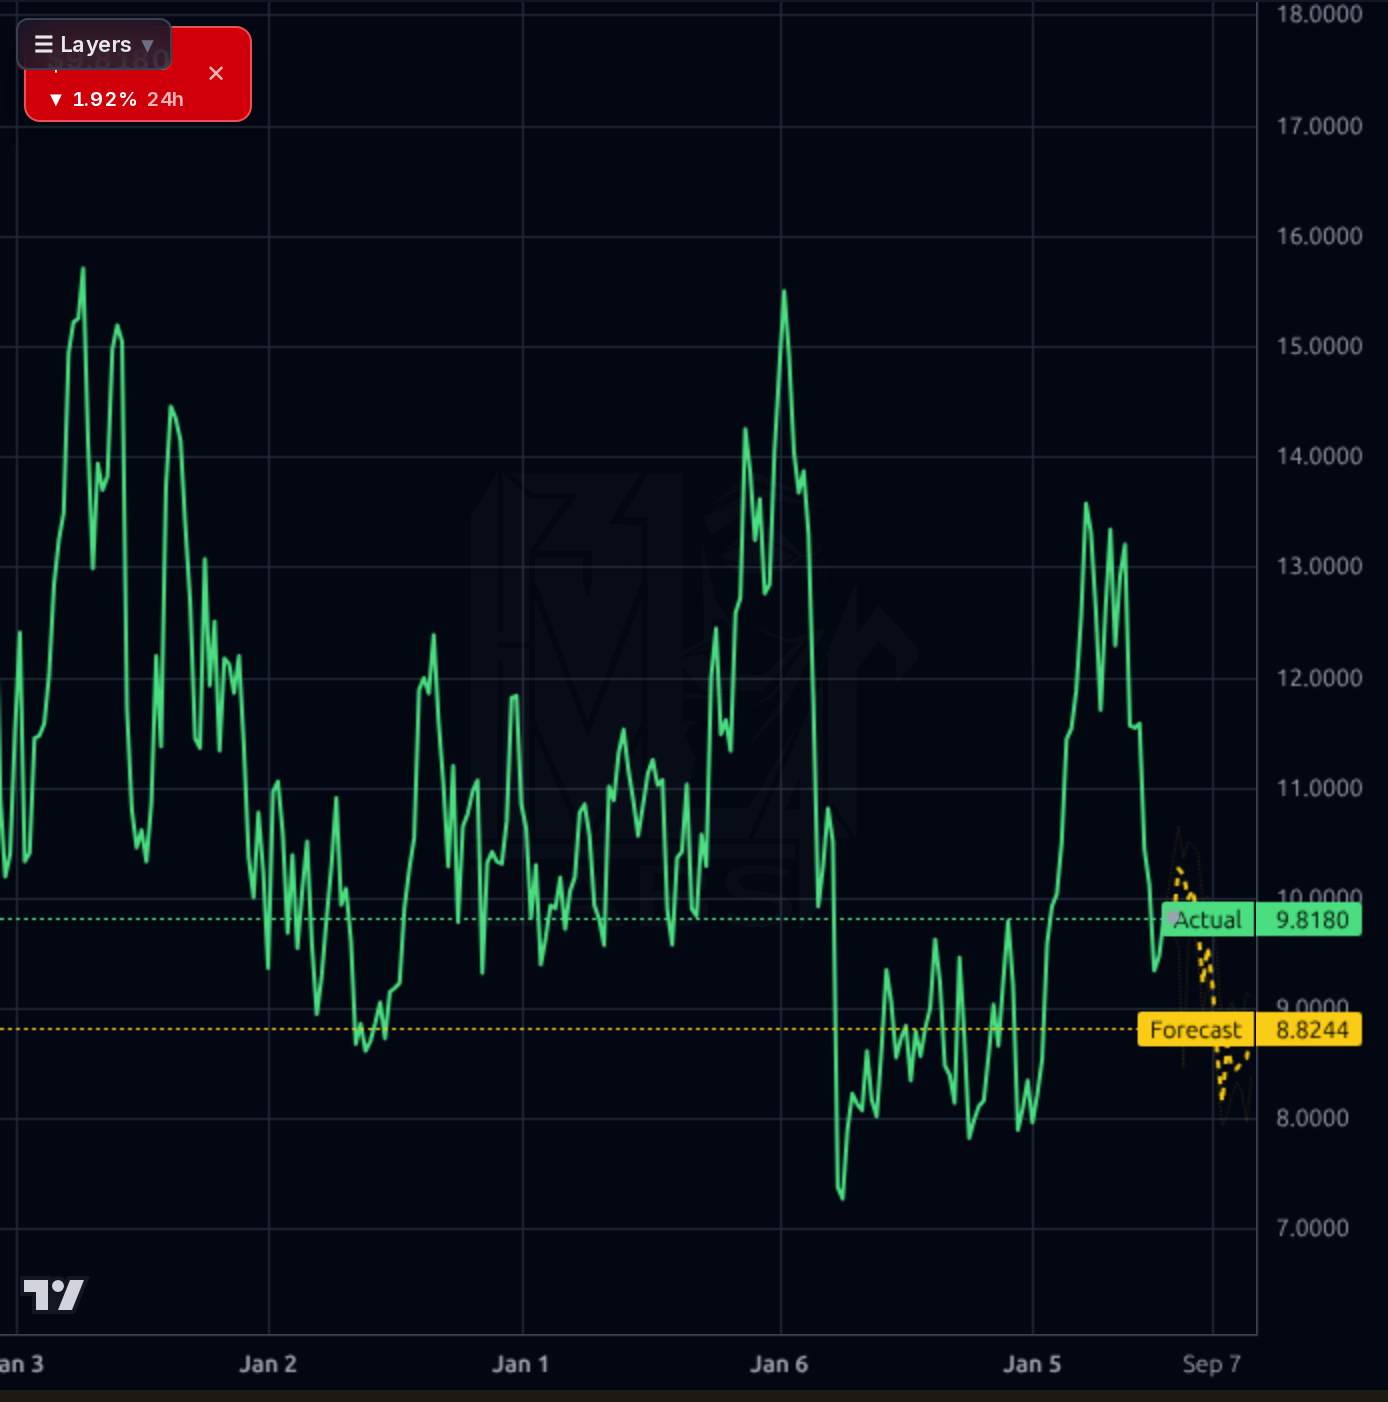
Multi-timeframe picture is mixed but improving. On the 1H chart, price is at $9.82 with the model forecasting a steep move to $12.61 — an aggressive +28% projection that looks stretched. The 4H chart shows a clean downtrend from May highs near $14 to a June low near $9.20, with a recovery leg forming and forecast band pointing to $11.12 (roughly the last resistance shelf). The daily shows price consolidating just above the $9.34-9.50 support cluster that held twice, with a forecast of $10.07 (modest). The weekly reveals the real story: rangebound $8-14 for a year, currently mid-range, with the weekly model forecasting a bearish $8.82 — but weekly directional accuracy (33%) is below naive baseline, so discount heavily. RSI 46 is neutral, price is +2% above SMA20 but -11% below SMA50, and Perf Week is +6% with Perf Month -12%. Key levels: support $9.34 then $7.68 (52w low); resistance $10.50, then $11.00, then $12.50. The 1d model's 81% directional accuracy is credible; the 1w's is not.
The most material catalyst is UBS initiating coverage with a Buy rating and $13 price target on July 15 — a fresh institutional endorsement that likely explains the recent bounce and the Recom score of 1.41 (near strong-buy consensus). Two independent Seeking Alpha pieces (July 7 and July 11) frame CRGY as deeply undervalued on FCF, echoing the KKR-backed operational thesis. Bill Miller's Miller Value Partners disclosure adds a credentialed value-investor tailwind. On the negative side, Simply Wall St. flagged the -22% monthly drawdown, and the fundamental-change signals show short float rising 12.8%→15.2% and next-year EPS estimates being cut from +1.3% to -7.1% — both bearish shifts within the last 10 days. The 8-K filing on July 8 covered hedge-book cash outflows, which is routine but signals hedging costs are being disclosed ahead of the Aug 3 print. Net: analyst upgrade momentum on one side, deteriorating estimate revisions and rising short interest on the other. Retail sentiment is thin and dominated by dividend/squeeze narratives — noise, not signal.
- UBS initiation with $13 PT (July 15) signals sell-side re-rating potential from consensus Recom 1.41
- Q1 2026 revenue of $1.18B (+32% QoQ) demonstrates Permian expansion is delivering volume growth
- TTM FCF of $629M and P/FCF of 4.94 suggest strong cash-generating asset base if capex normalizes
- KKR sponsorship and Bill Miller ownership provide institutional validation for the value thesis
- EV/EBITDA of 4.74 offers re-rating optionality to peer-group ~6-7x if margins recover
- Q1 2026 free cash flow of -$263M driven by $672M capex spike raises sustainability questions
- $5.37B total debt vs $9.8M cash with current ratio of 0.57 and D/E of 1.12 — refinancing risk
- Short float rose from 12.8% to 15.2% in 45 days — crowded bearish positioning may reflect informed selling
- Next-year EPS estimates cut from +1.3% to -7.1% — analyst estimate revisions turning negative
- Dividend payout ratio of 88.7% with negative TTM EPS makes the 4.72% yield vulnerable to a cut
- Aug 3 earnings is a binary event; LESSON notes stock is prone to sharp post-earnings selloffs
- Weekly forecast (below naive baseline in accuracy) shows a bearish $8.82 target — model unreliable but directionally worth noting
Get AI analysis on any stock
This is one of hundreds of Kronos AI reports — scored fundamentals & technicals, bull/base/bear price targets, a multi-horizon plan, and continuously-updated forecasts across the market. Create a free account to explore them all.
Create your free account →Already a member? Sign in · Join our Discord