CRI — AI Stock Forecast & Price Targets
Published 8/7/2026 · A free sample of K3vl4r’s AI-powered analysis.
Kronos price forecasts, scored fundamentals & technicals, and a multi-horizon plan.
View the live CRI price forecast →
CRI's recent Q2 results show strong revenue growth and tariff recovery, but persistent margin compression and elevated short interest create near-term volatility. The chart shows a bullish trend with support at $36.44 (forecast band) and resistance at $40.69 (actual price), though technicals remain fragile amid cyclical retail weakness.
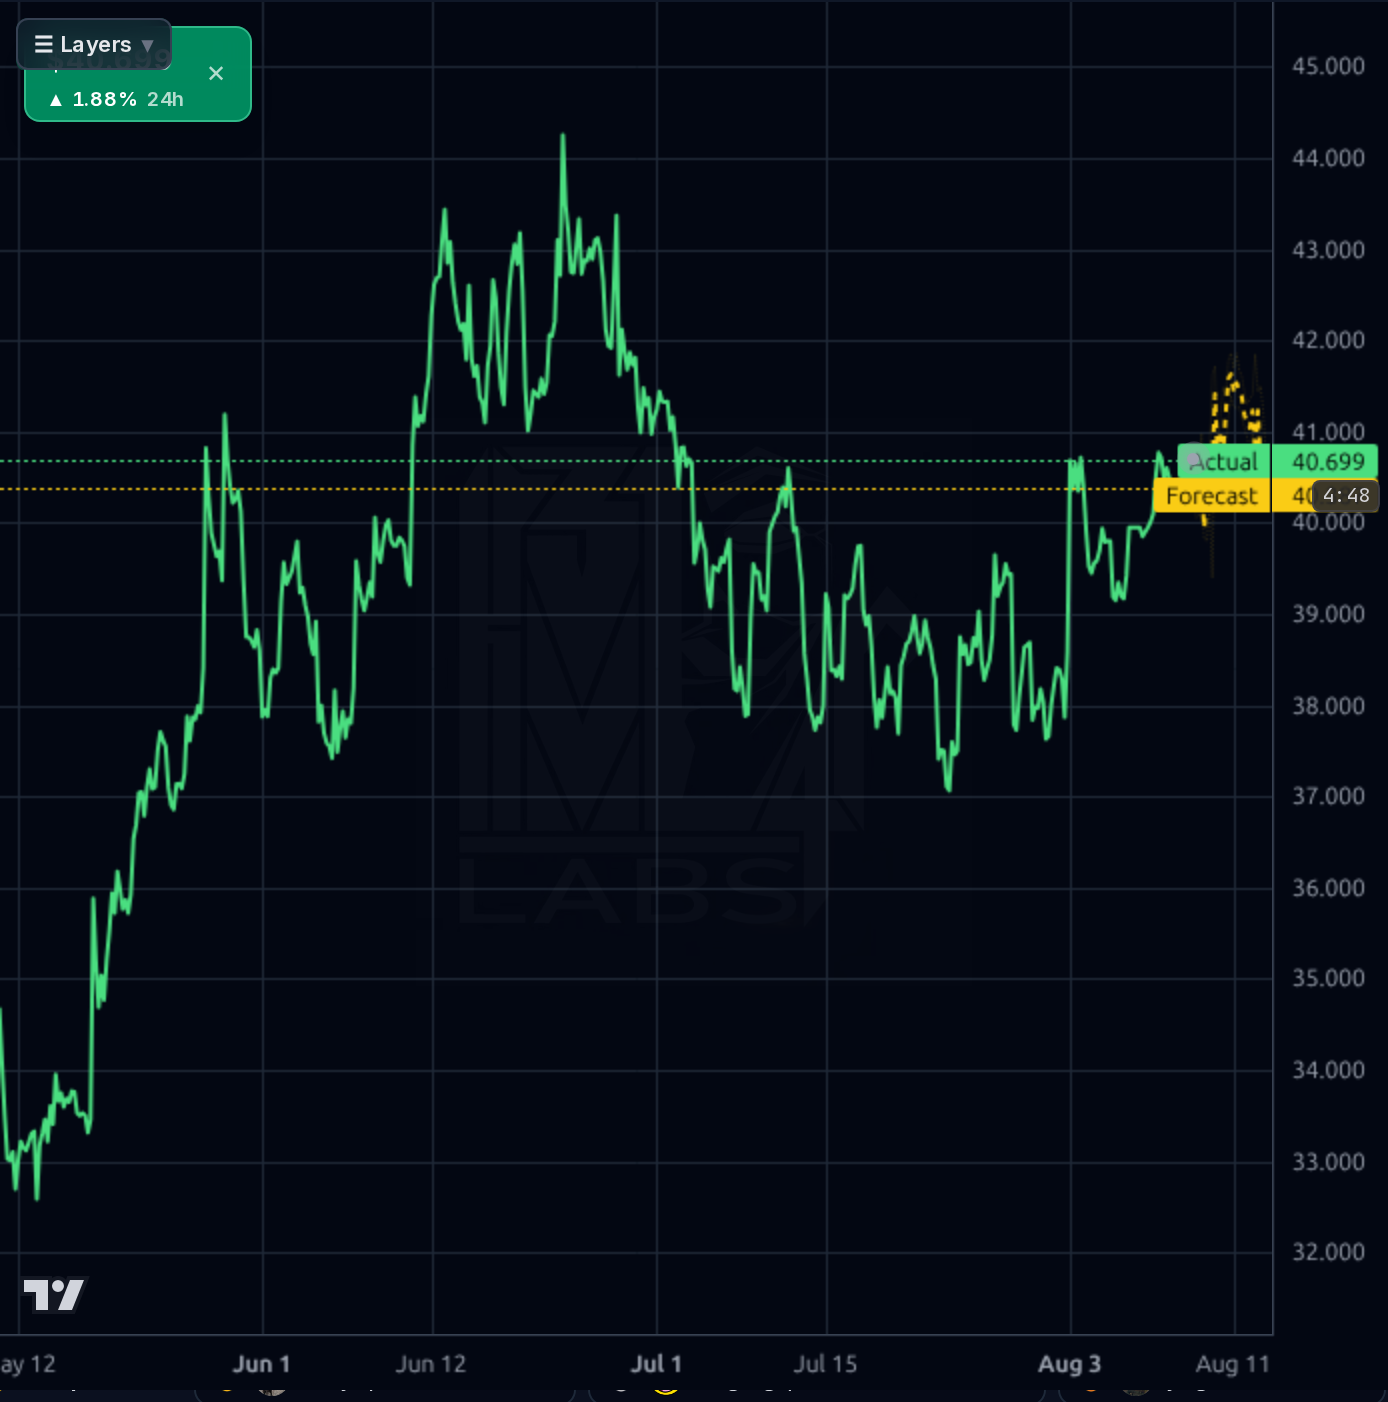
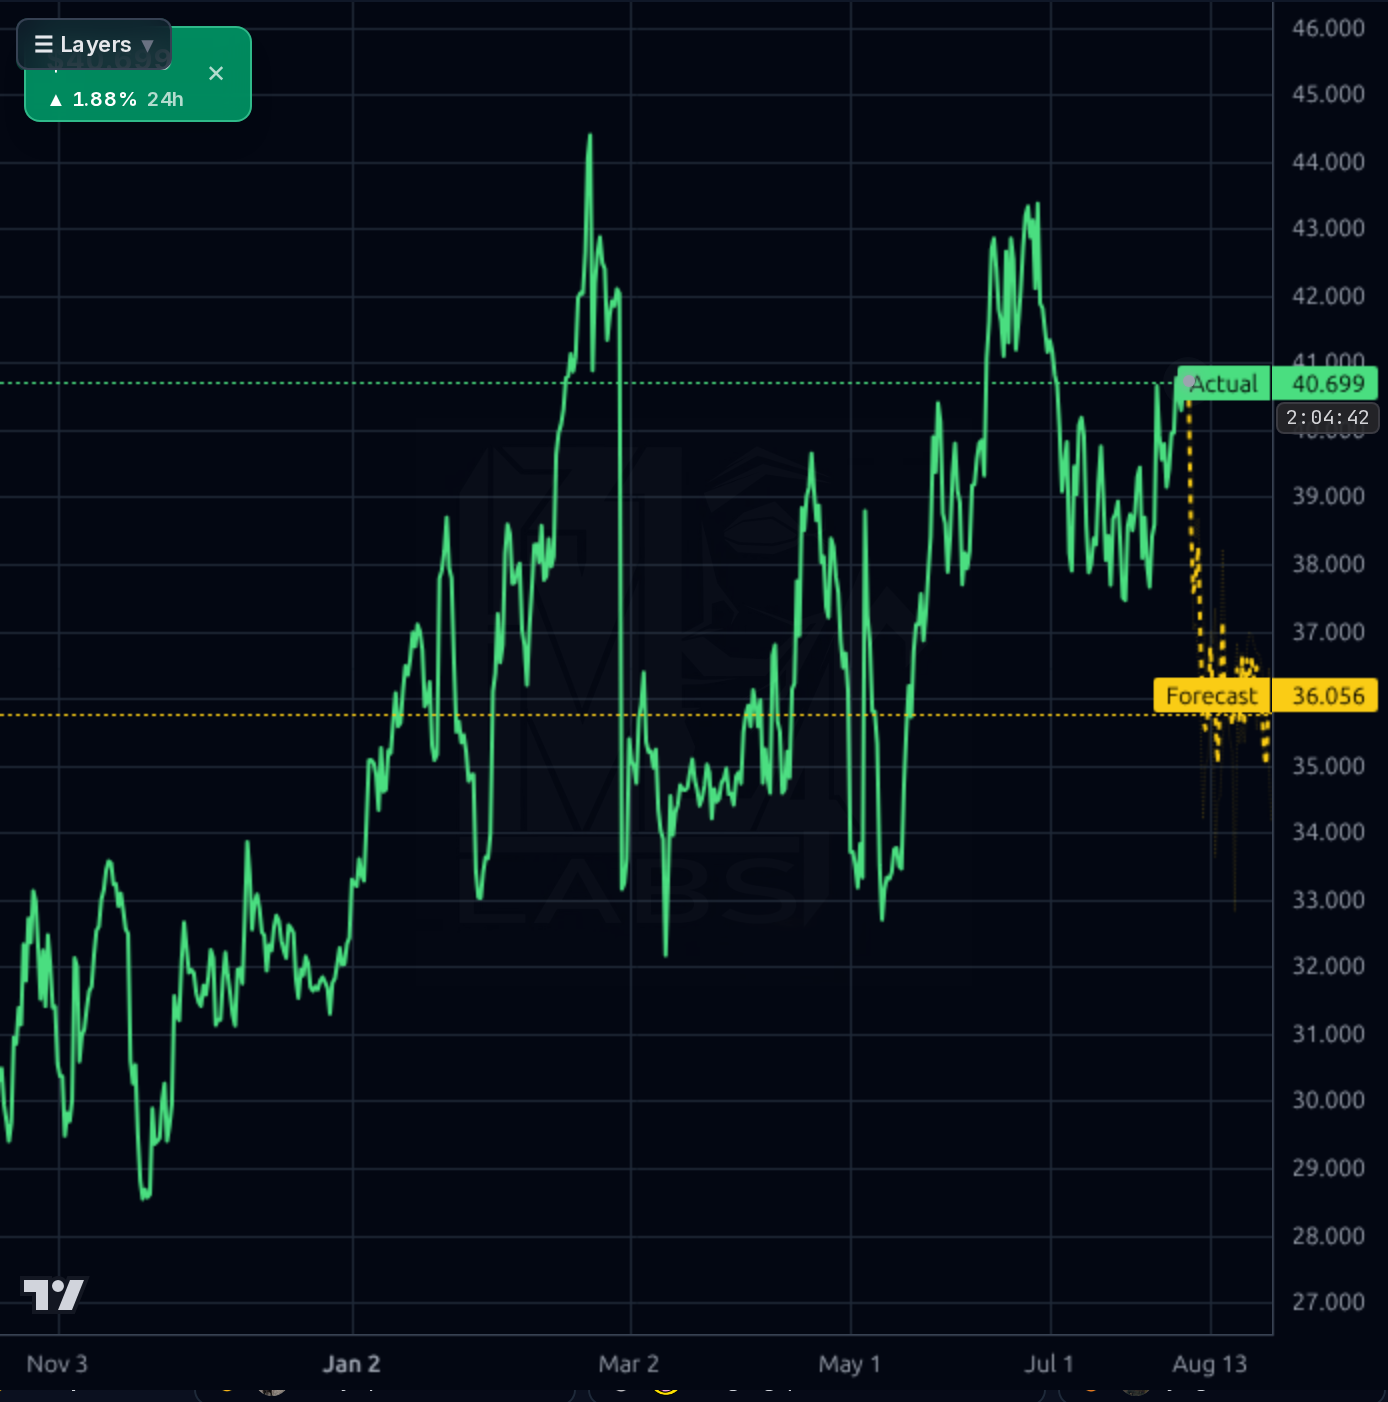
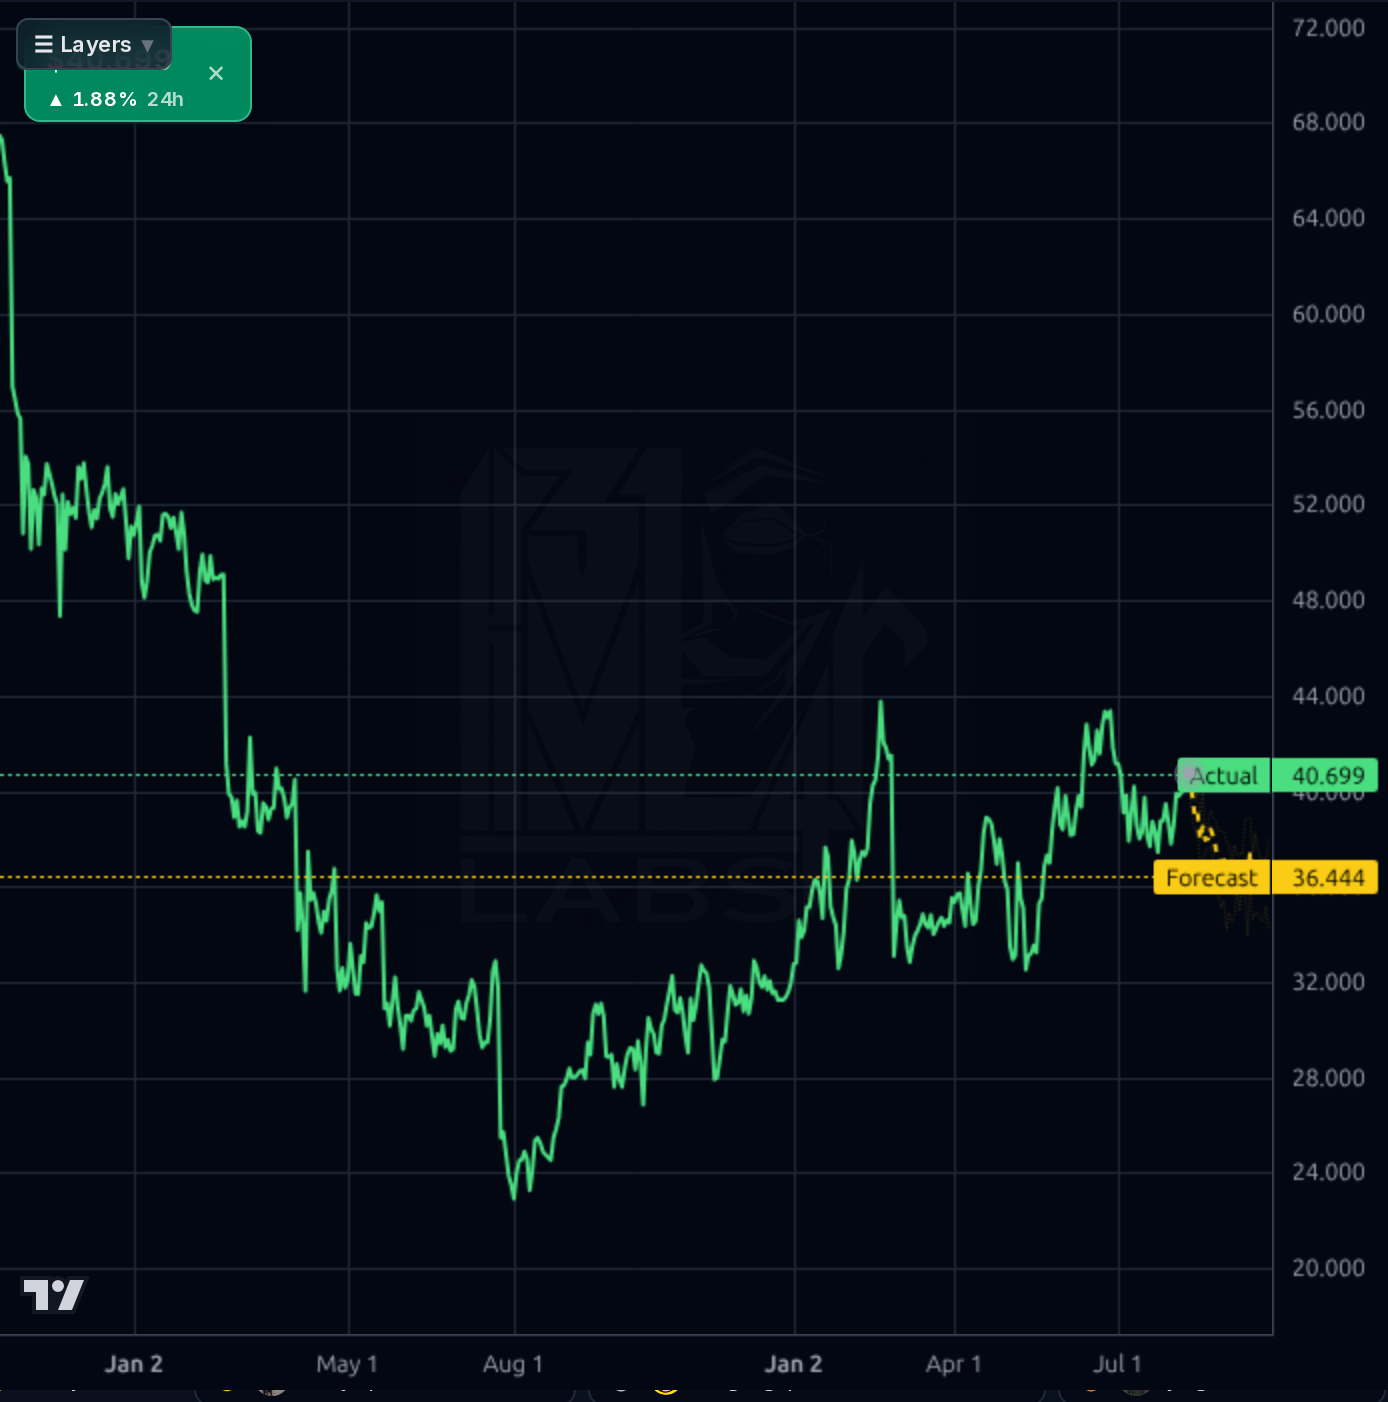
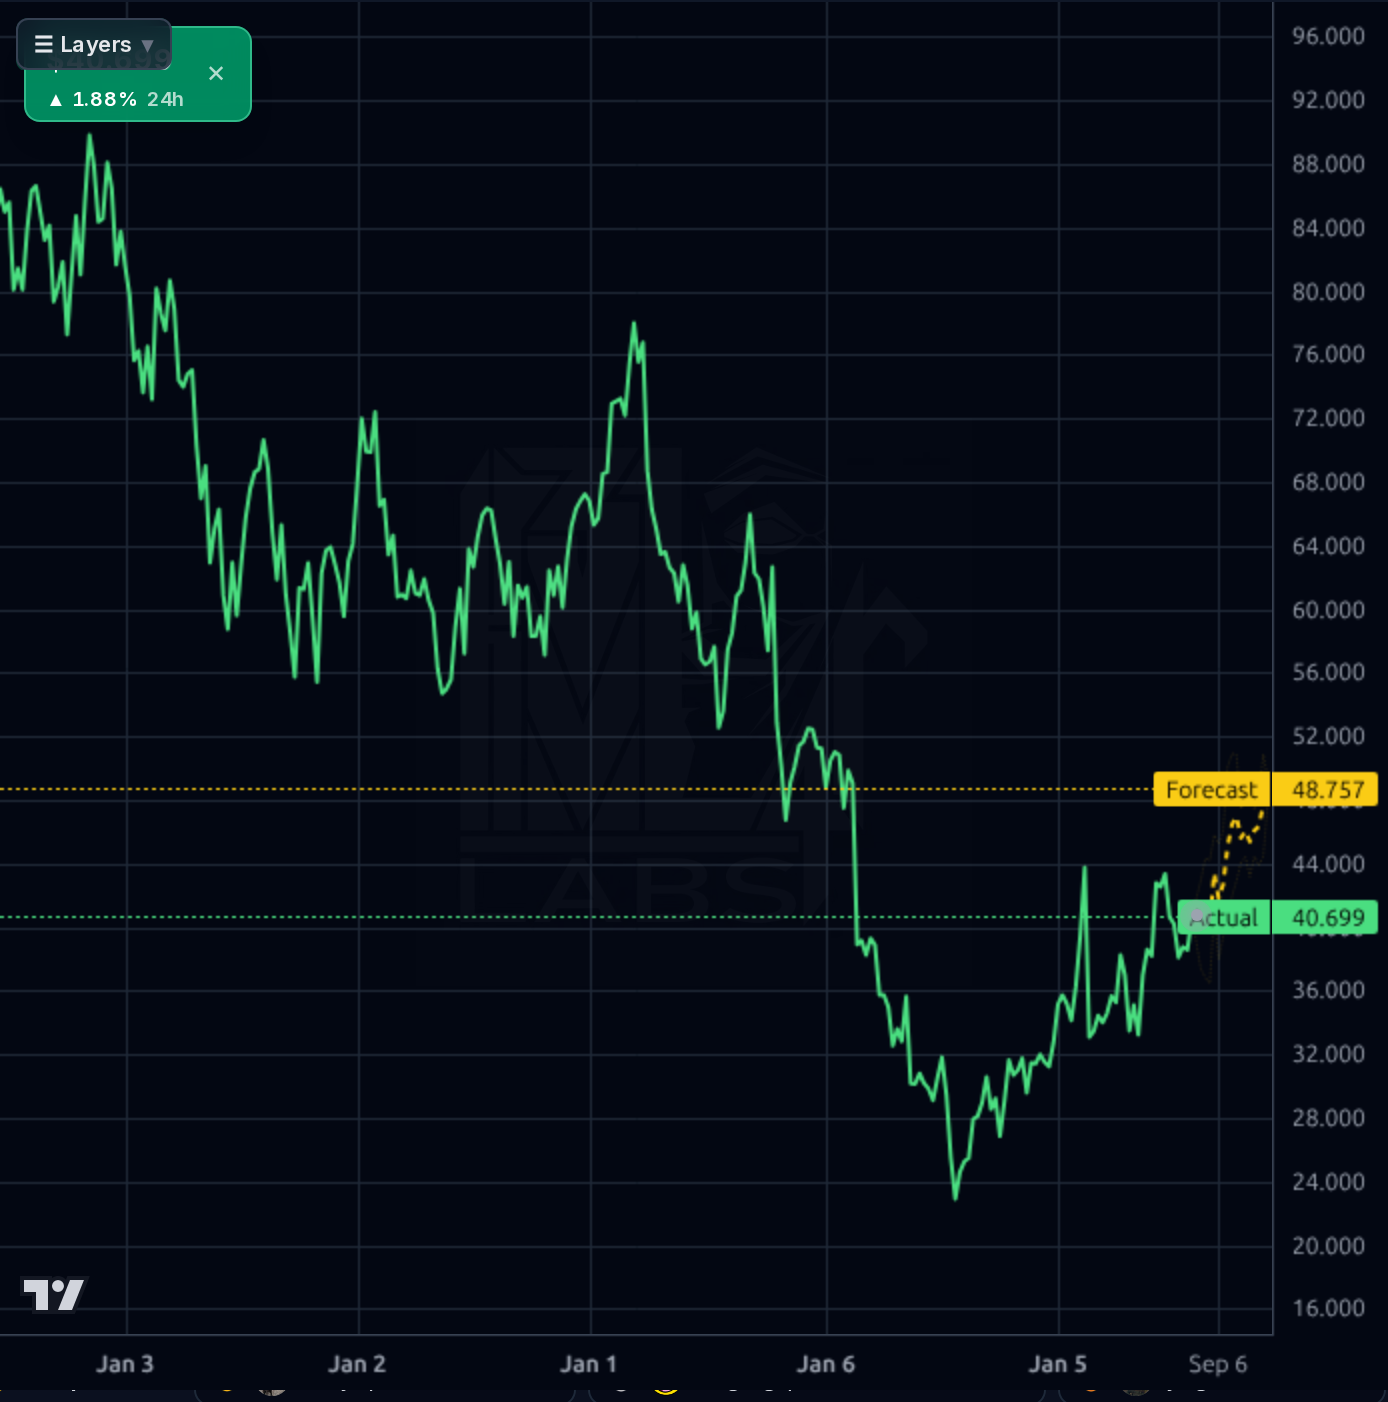
Hold near $40.29; invalidation below $36.44 (forecast band) would trigger a trim. Target $42.67 (analyst price target) if the forecast band holds above $38.50. Avoid aggressive entries due to high short interest and weak directional accuracy.
Wait for confirmation of sustained margin improvement (above 5.0%) or institutional ownership stabilization. Catalysts include Q3 earnings beat, tariff recovery progress, and retail spending rebound. Target $42.67 if the forecast band holds above $38.50; otherwise trim to $36.44.
Terminal thesis: CRI's brand strength in childrenswear provides a structural floor, but cyclical retail weakness may limit long-term growth. Structural risk is persistent margin compression and competitive pricing pressure. Long-term return potential is capped at 10-15% annually if margins stabilize above 8%.
Revenue grew 5.16% YoY to $615.49M in Q2, driven by strong retail comps and tariff recovery ($650M cash). Margins remain pressured: gross margin at 48.60%, operating margin at 8.92% (down from prior year), with net margins at 6.37%. Balance sheet shows $1.15 debt/equity ratio, but free cash flow turned negative in Q2 (-$543k) due to capex. Institutional ownership is high (112.24%), yet short interest remains elevated (10.73% float), amplifying volatility. The forward P/E of 11.08 suggests value, but margin deterioration and weak sales growth (-60.60% over 5 years) indicate structural challenges.
The chart shows a bullish trend with recent price action above the 20-day SMA (3.71%) and 50-day SMA (1.10%). Support is at $36.44 (forecast band), while resistance is at $40.69 (actual price). The Kronos AI forecast shows a tight band between $36.44 and $40.69, with the current price near the upper end of this range. RSI at 55.25 suggests neutral momentum, but the 1-day chart shows volatility with a 1.88% gain in 24h. The model's directional accuracy is weak (52%) for short-term horizons, indicating high uncertainty.
The Q2 results beat expectations with revenue up 5.16% YoY and adjusted operating income jumping 54%. Tariff recovery ($650M cash) provides a structural floor, but the company narrowed its full-year sales outlook to 2%-3%. Social sentiment is overwhelmingly bullish (100% bullish), yet short interest remains elevated at 10.73%, creating potential for sharp pullbacks on negative news. The market regime shows risk dial neutral with cyclical sector leadership, but retail weakness could persist.
Get AI analysis on any stock
This is one of hundreds of Kronos AI reports — scored fundamentals & technicals, bull/base/bear price targets, a multi-horizon plan, and continuously-updated forecasts across the market. Create a free account to explore them all.
Create your free account →Already a member? Sign in · Join our Discord