CRK — AI Stock Forecast & Price Targets
Published 7/15/2026 · A free sample of K3vl4r’s AI-powered analysis.
Kronos price forecasts, scored fundamentals & technicals, and a multi-horizon plan.
View the live CRK price forecast →
CRK is a leveraged Haynesville gas pure-play trading at $12.98, pinned just 4% above its $12.44 52-week low after a -44% YTD collapse, with a binary Q2 earnings print in 14 days (July 29). The structural bull case (LNG export ramp, AI/data-center gas demand, the $600M Sixth Street/Pinnacle monetization) is real but subordinate to acute balance sheet fragility ($3.03B debt vs $14.8M cash, four straight quarters of negative FCF) and deeply informed bearish positioning (28.9% short float, Goldman Sell at $10). The bullish short-timeframe model forecasts have repeatedly failed to print on this name while the bearish weekly forecast ($11.20) has been more predictive — this remains a HOLD into the print, not a pre-earnings buy.
Do not initiate or add ahead of the July 29 Q2 print — this name de-rates into earnings and reacts to explicit debt-paydown language, not operational data, and the print is a binary gap risk with a Goldman $10 target waiting to be validated below. For existing holders: hold with a hard invalidation at a daily close below $12.44 (the 52-week low); a break opens undefined downside toward the Goldman $10 zone and the bearish weekly forecast at ~$11.20. Tactically, any pre-earnings bounce into $13.60-14.00 (the broken shelf) is a trim zone, not a breakout. No new money until the print resolves the capital-allocation question. Ignore the bullish 1d/4h forecast bands ($19+) — they match naive baseline accuracy at best and have failed repeatedly on this name.
1-6 months hinges almost entirely on the July 29 earnings call: (1) does management explicitly commit Pinnacle proceeds and go-forward cash to parent-level debt reduction, (2) does capex moderation end the four-quarter negative FCF streak, and (3) do realized gas prices vs strip improve into the LNG ramp. A credible deleveraging commitment plus a held $12.44 floor could squeeze the 28.9% short float (8.4 days to cover) toward $15-16. A miss or evasive capital-allocation answer breaks the floor and validates the $10-11 zone. Expected range: bear $10.50, base $13.50, bull $16.00 — the base is deliberately set near current price because prior base targets on this name have run ~16% optimistic. What changes my mind bullishly: positive FCF quarter plus explicit parent debt paydown; bearishly: a close below $12.44 on volume.
1-3 years, the structural thesis is legitimate: Haynesville proximity to Gulf Coast LNG (Plaquemines, Golden Pass ramping 2026-27), the Western Haynesville 5.2 GW power-hub designation for AI/data-center demand, and 1.07M net acres of inventory position CRK as a high-beta call on US gas demand. If gas strip firms and the company reaches self-funding, the equity (P/B 1.38, EV/EBITDA 6.8x) has meaningful torque — potentially $18-22. But the biggest structural risk is that the balance sheet doesn't get the time: $3.03B debt, no cash, 0.41 current ratio, and a capex program outrunning cash flow mean a prolonged soft gas tape forces dilution or asset sales at distressed prices. Jerry Jones' 73% insider stake is a backstop of sorts but also a governance/liquidity concentration. This is a survivorship trade, not a compounder — appropriate only as a small, risk-defined position.
The operational picture is genuinely improving while the financial picture stays fragile. Q1 2026 revenue was $585.5M (+18% QoQ, sales Y/Y TTM +44.8%), gross margin re-expanded to 34.3% from the Q3'25 trough of 15.7%, and EBITDA hit $319M for the quarter with a 53% TTM EBITDA margin. ROE of 24-25% and a 6.1x trailing P/E screen cheap, and PEG of 0.39 looks striking on paper. But the forward P/E of ~13.8-14.4x (forward EPS $0.94 vs trailing $2.17) tells you the market views TTM earnings as peak-cycle. The balance sheet is the binding constraint: $3.03B total debt against $14.8M cash, current ratio 0.41, working capital of -$422M, and free cash flow negative four consecutive quarters (-$786M TTM; Q1 capex of $415.8M vs $272M operating cash flow). The Sixth Street/Pinnacle deal (June 15) was a genuine positive — $445M preferred redeemed, Pinnacle debt retired, ~$40M/yr in fixed charges saved — but parent-level leverage (Debt/Eq 1.10) is untouched and the rig expansion from 5 to 7 keeps the capex burn running. Q1 also missed analyst estimates significantly (EPS surprise -33.2% per the snapshot). This is a company outspending cash flow into a soft gas tape with essentially no liquidity cushion.
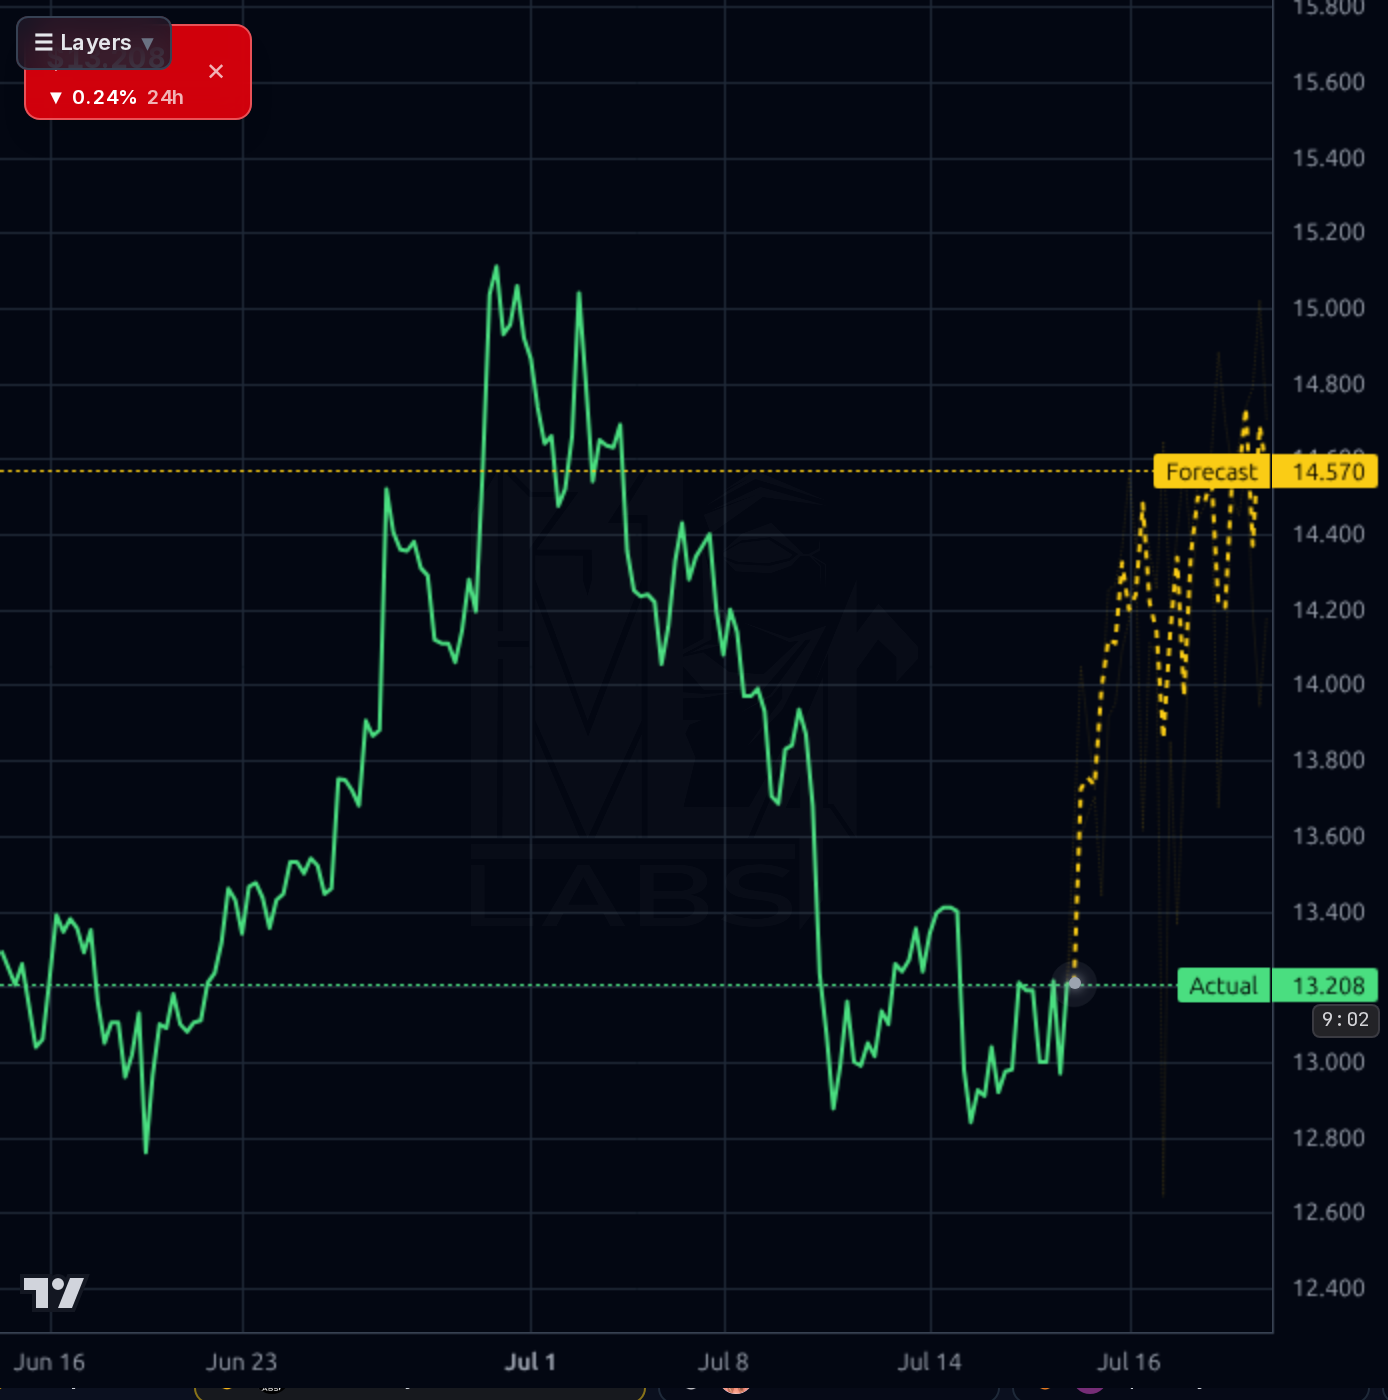
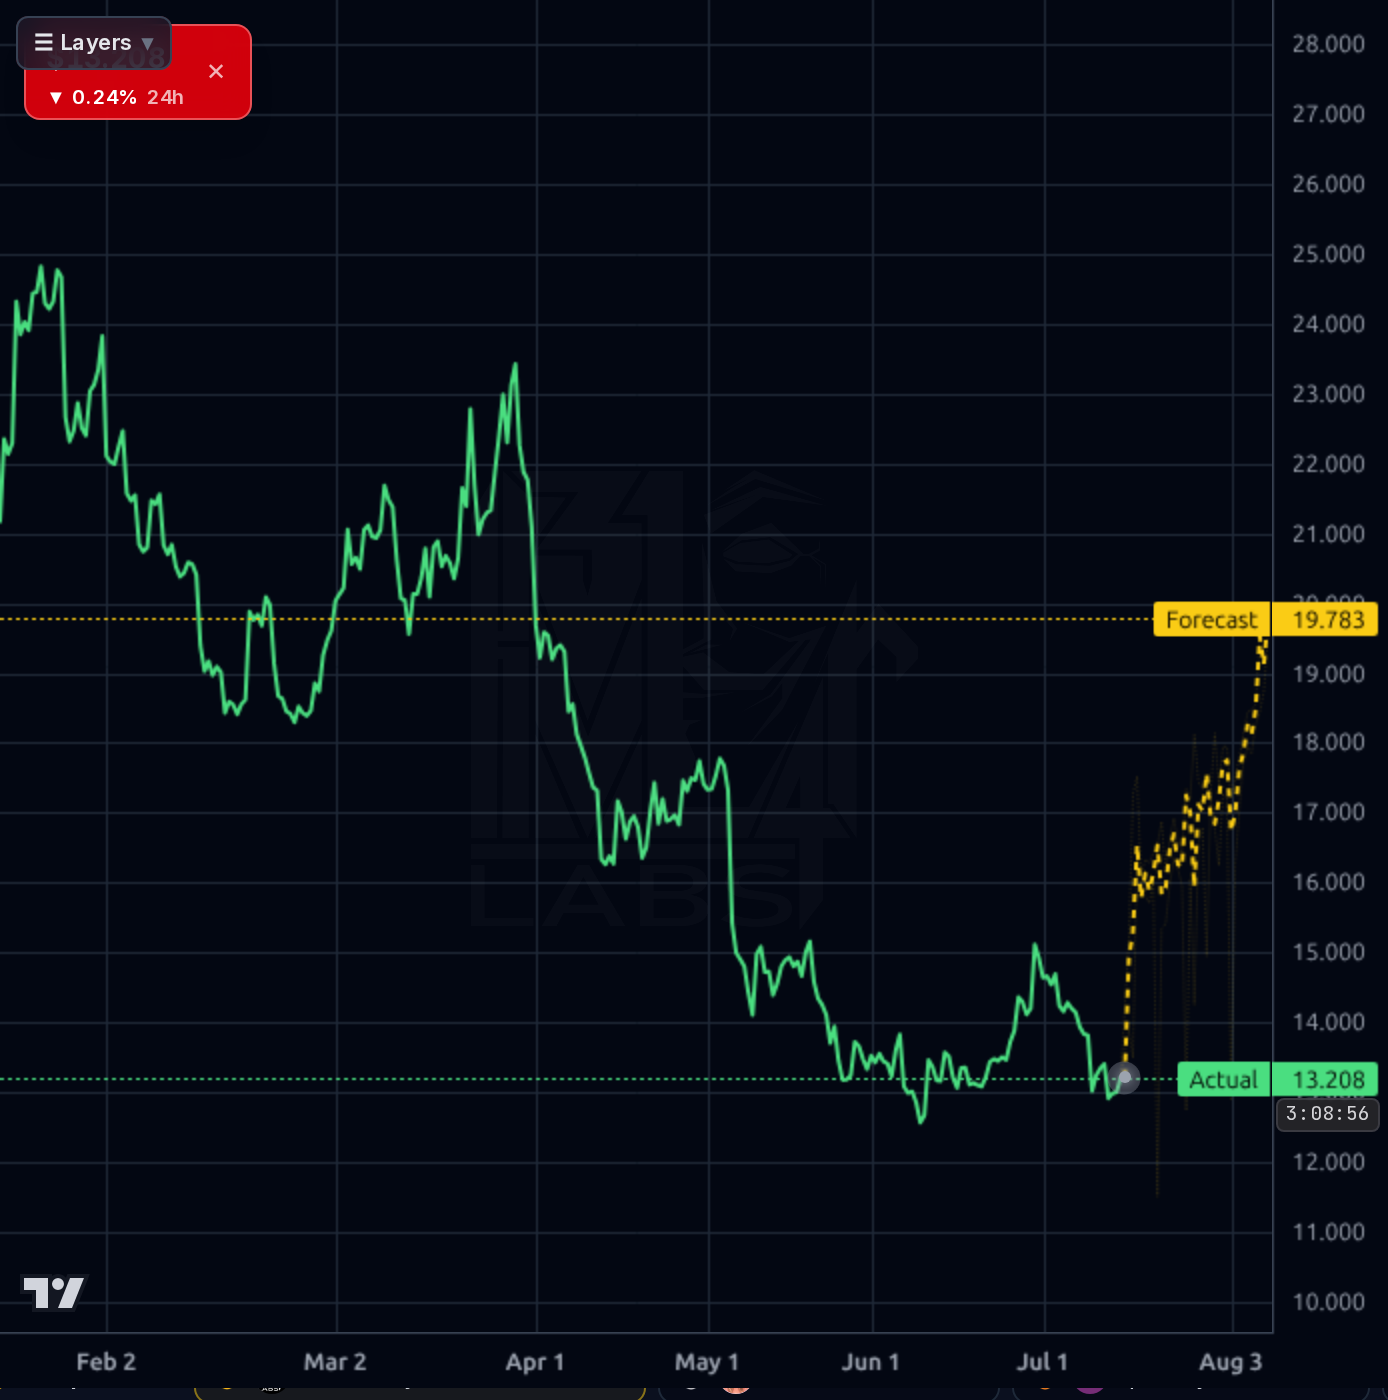
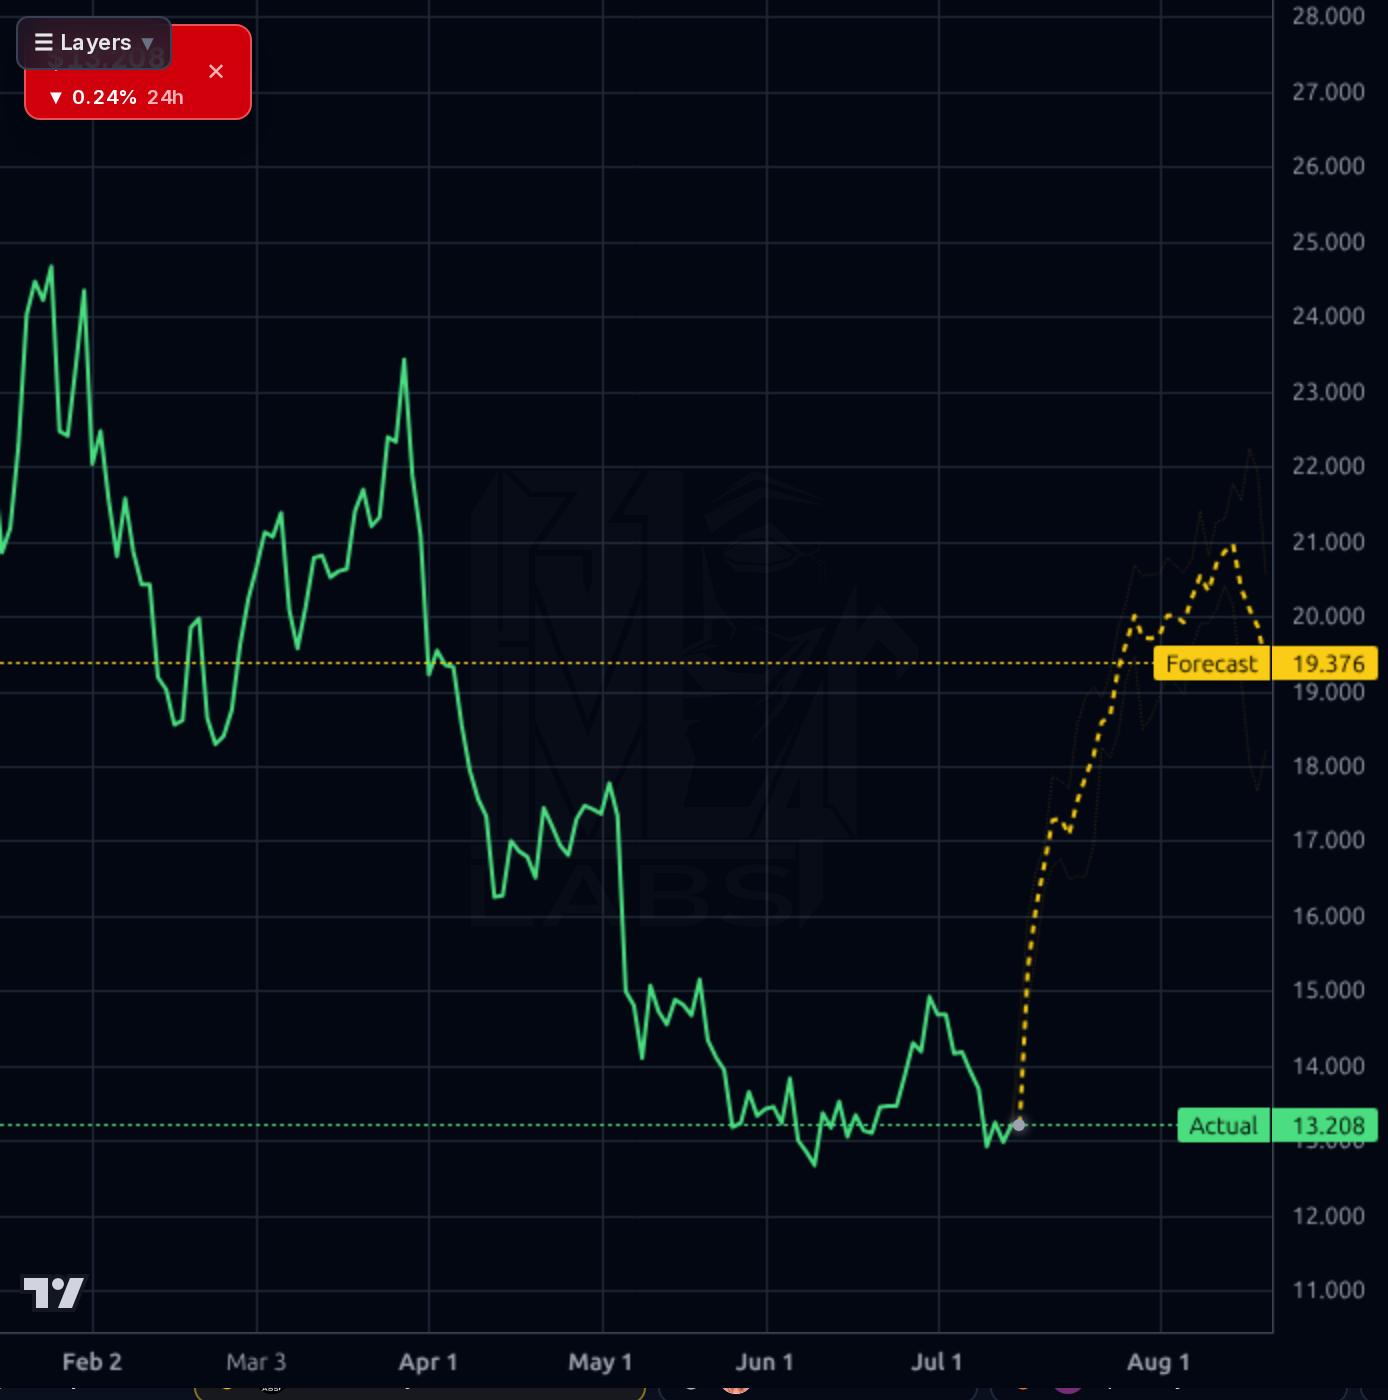
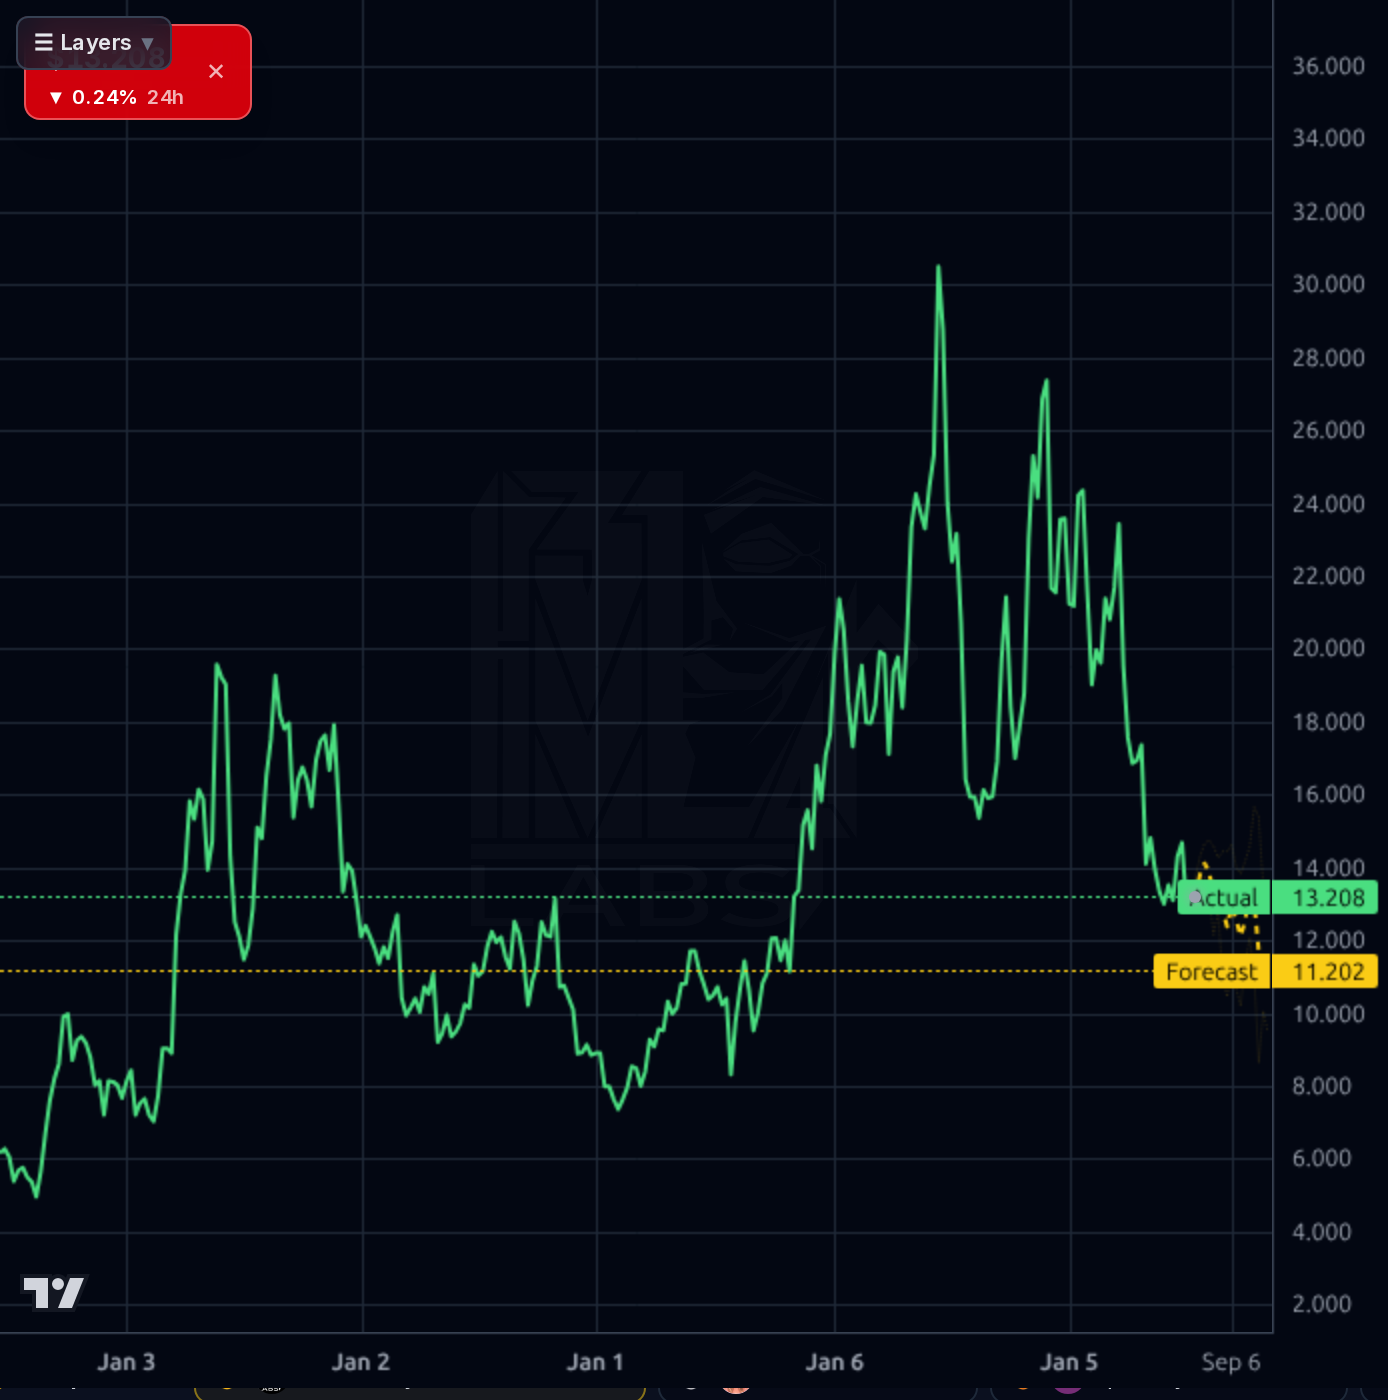
The structure is broken across every timeframe. On the daily/4h charts, price collapsed from ~$24-25 in February through successive support shelves, and the $13-14 shelf that held June-July has now given way — price sits at $12.98, within 4% of the $12.44 52-week low, below the SMA20 (-5.5%), SMA50 (-7.7%), and SMA200 (-32.8%), with RSI at 39.6 (weak but not capitulation-oversold; a documented lesson on this name is that ~40 RSI does not trigger mean-reversion here). Perf week -8.5%, perf quarter -25.1%. The 1h chart shows a lower-highs sequence since the July 1 spike to ~$15.1, with price chopping in a $12.8-13.4 range. The model forecasts diverge sharply by timeframe: the 1h ($14.57), 4h ($19.78), and 1d ($19.38) bands are aggressively bullish, but 1d directional accuracy (57%) merely matches the naive baseline and MAPE is 31% — these have systematically skewed bullish on CRK and repeatedly failed to print (prior calls at $17-22 never materialized). The weekly forecast is bearish ($11.20 vs $13.21 actual) and history on this name says the bearish weekly has been the more predictive signal. Key levels: $12.44 is the last floor with nothing beneath it; $13.40-13.60 is first resistance, then the broken $14 shelf.
The signal in the news flow is uniformly cautious-to-negative. Comstock was named in a July 14 StockStory piece on 'cash-burning stocks with questionable fundamentals,' and a cluster of July 10-11 Simply Wall St. articles flagged the Q1 miss (revenue lagging peers), the 12% one-week slide, and the -44-45% YTD return — while conceding the stock 'screens as cheap' on cash flow. Goldman Sachs reiterated its Sell and cut its target from $13 to $10 (June 30/July 6), a target now below the market price, meaning the most bearish major desk sees ~23% further downside. Roth's upgrade to Neutral ($13-14 target, per deep research) is faint praise — it brackets the current price. The consensus target of ~$16-17 offers nominal upside but consensus targets on this name have run systematically optimistic. The only unambiguous positive remains the June 15 Sixth Street/Pinnacle $600M transaction (confirmed by the June 16 8-K), which removed preferred equity and Pinnacle debt. Retail sentiment is 100% bullish across 6 tagged messages, laced with spam — a mild contrarian negative. Broader market context (crypto rallying on cool CPI, strong bank earnings) is irrelevant to a gas E&P facing weak LNG prices; one StockTwits post pointedly notes production at all-time highs into multi-month-low LNG prices, which captures the bear case in one line.
- LNG export ramp 2026-2027 (Plaquemines, Golden Pass) lifting Haynesville netbacks via Gulf Coast proximity — the core demand tailwind
- Western Haynesville designated as a 5.2 GW power-generation hub site (March 2026) for AI/data-center gas demand
- Rig count expansion from 5 to 7 accelerating Western Haynesville delineation and production growth (sales Y/Y TTM +44.8%)
- Sixth Street $600M Pinnacle investment (June 15 8-K): $445M preferred redeemed, Pinnacle debt retired, ~$40M/yr fixed-charge savings
- Margin recovery trajectory: gross margin 34.3% in Q1'26 vs 15.7% trough in Q3'25; EPS next-Y consensus +85%
- Balance sheet fragility: $3.03B debt vs $14.8M cash, current ratio 0.41, working capital -$422M — no liquidity cushion for a prolonged soft gas tape
- Four consecutive quarters of negative FCF (-$786M TTM); Q1 capex $415.8M vs $272M operating cash flow while adding rigs
- Binary Q2 print July 29 (~14 days): Q1 already missed (EPS surprise -33%), and this name historically de-rates into earnings
- $12.44 52-week low is the last technical floor; a break opens undefined downside toward Goldman's $10 Sell target
- 28.9% short float with 8.4 days to cover — informed bearish positioning, though also latent squeeze fuel
- Forward P/E ~14x vs trailing 6x signals the market views TTM earnings as peak-cycle; production at highs into multi-month-low LNG prices
- 73% insider ownership (Jerry Jones) concentrates governance and thins the float (78.6M shares), amplifying volatility
- Bullish 1d/4h model forecasts on this name have systematically failed; the more predictive weekly forecast points to $11.20
Get AI analysis on any stock
This is one of hundreds of Kronos AI reports — scored fundamentals & technicals, bull/base/bear price targets, a multi-horizon plan, and continuously-updated forecasts across the market. Create a free account to explore them all.
Create your free account →Already a member? Sign in · Join our Discord