CRK — AI Stock Forecast & Price Targets
Published 8/10/2026 · A free sample of K3vl4r’s AI-powered analysis.
Kronos price forecasts, scored fundamentals & technicals, and a multi-horizon plan.
View the live CRK price forecast →
CRK's structural tailwinds from LNG and AI demand are real but severely constrained by acute balance sheet fragility ($3.17B debt vs $45M cash) and recent operational deterioration (Q2 gross margin collapse to 12.1%). The stock is trading near its 52-week low with technical support at $12.12, while the Kronos AI forecast shows a narrow band between $14.26 and $18.39 — but short-term momentum is weak given the model's high MAPE (31% for 1d).
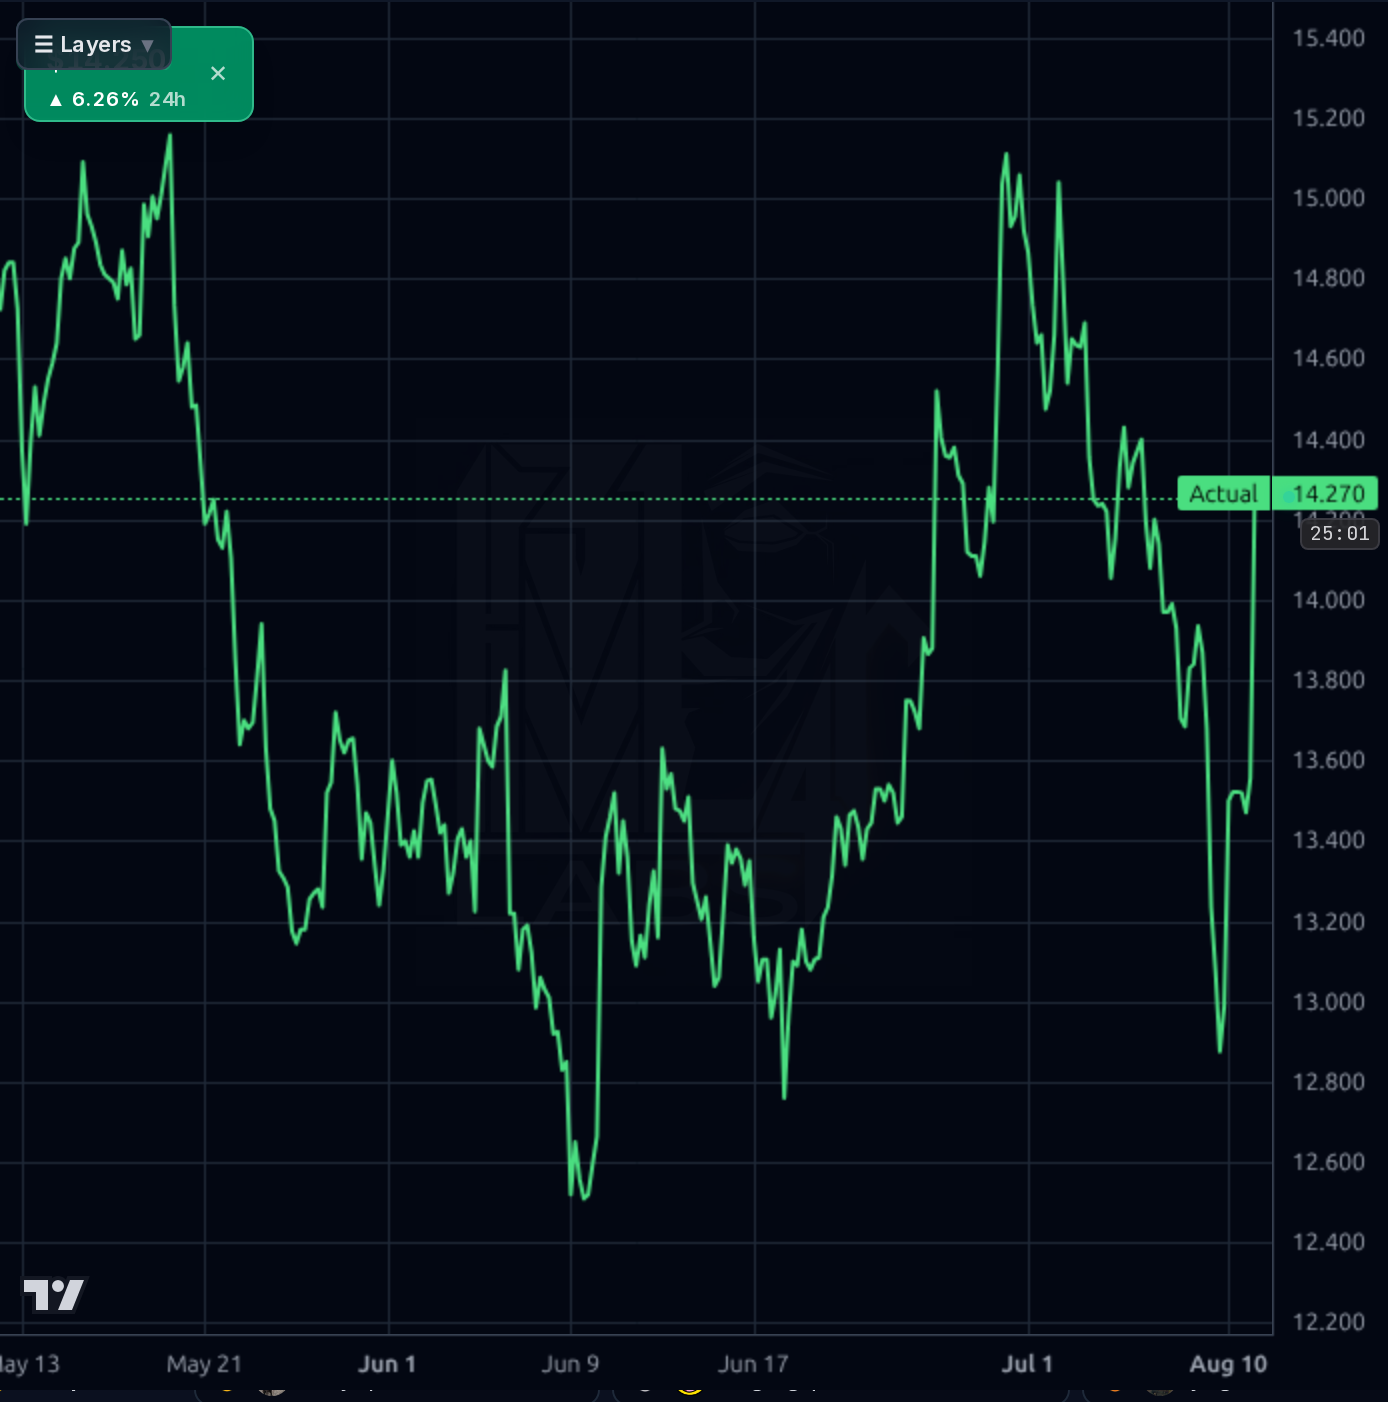
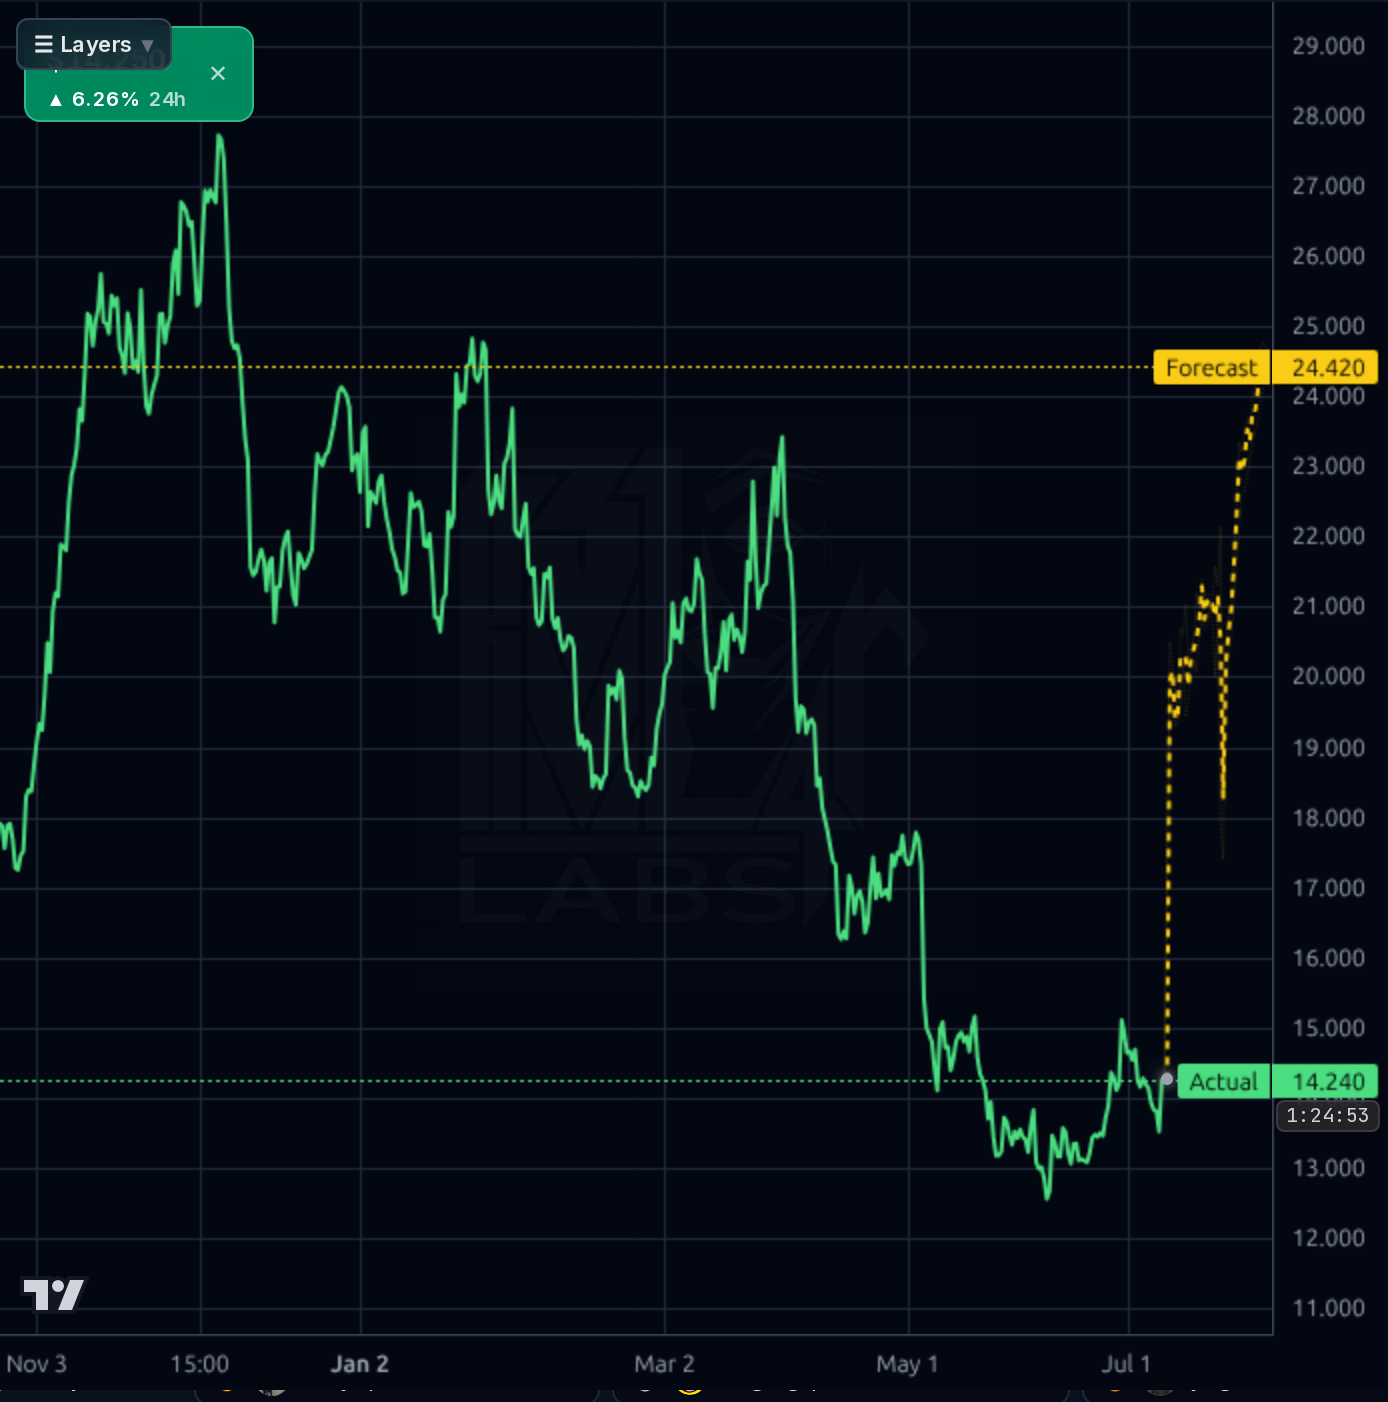
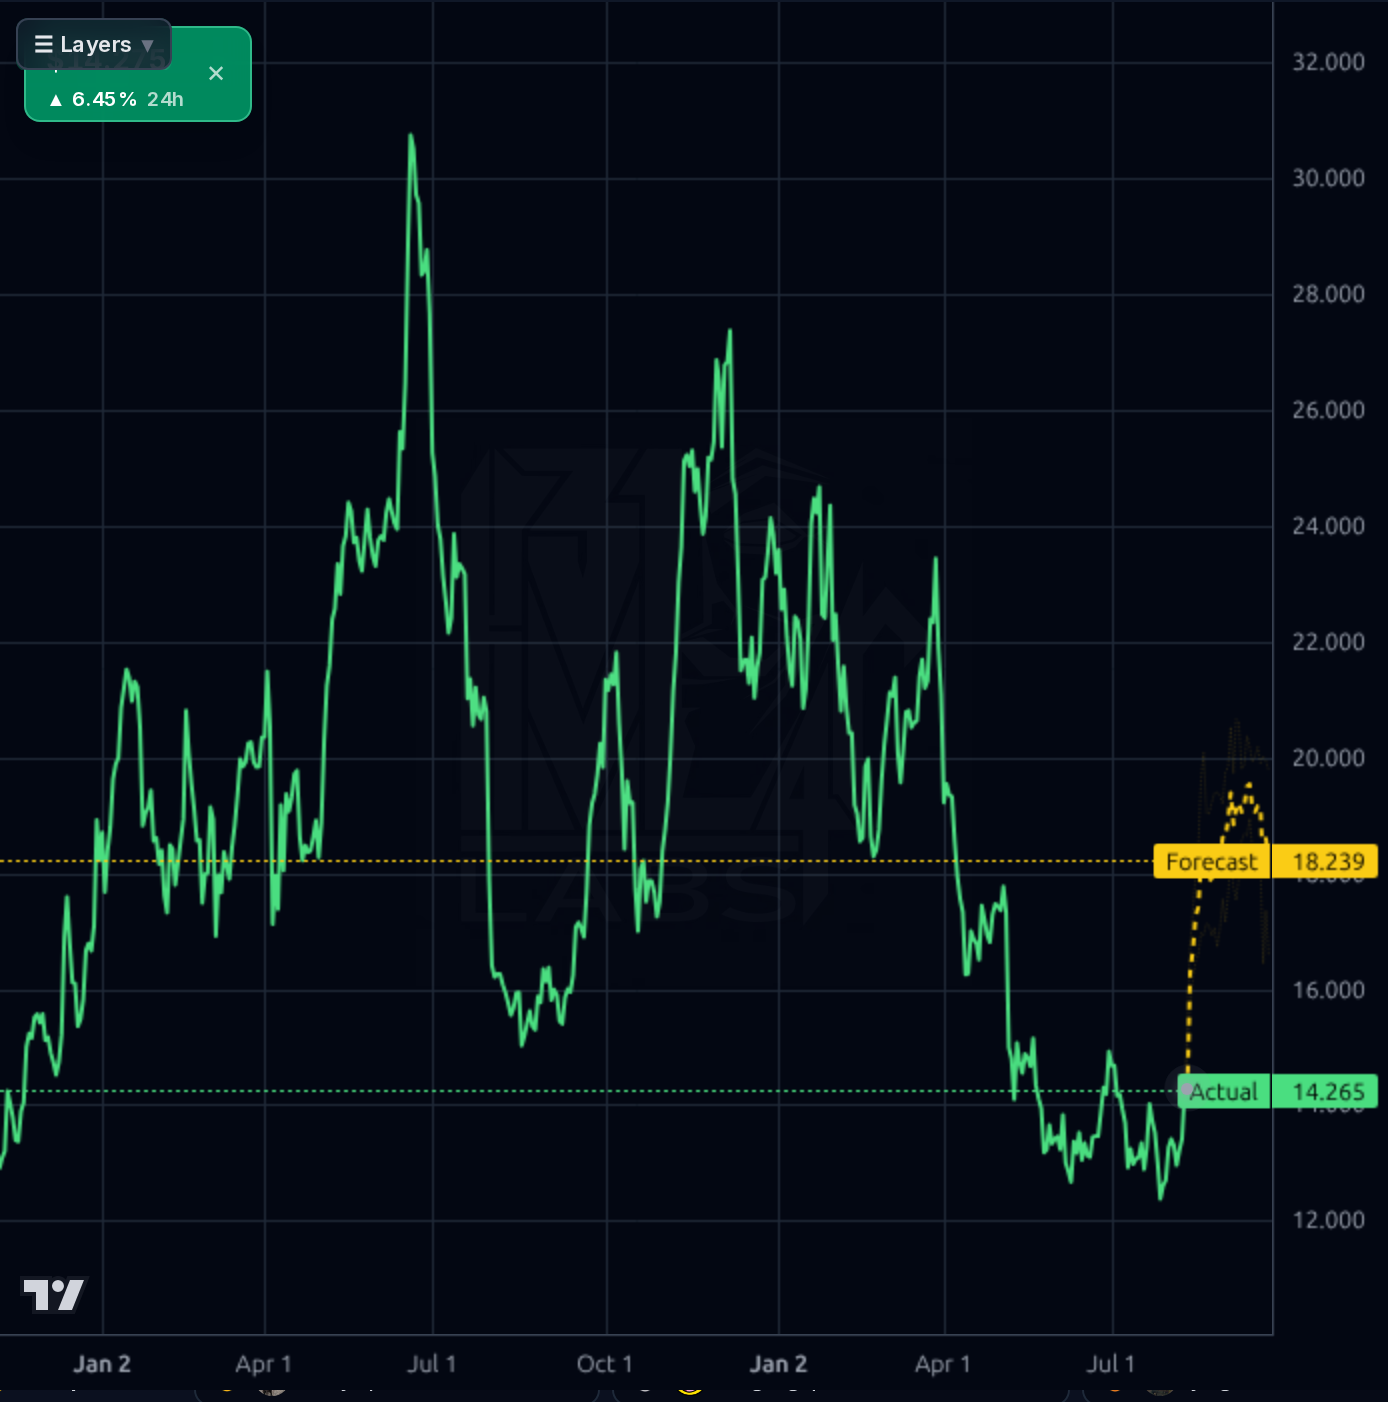
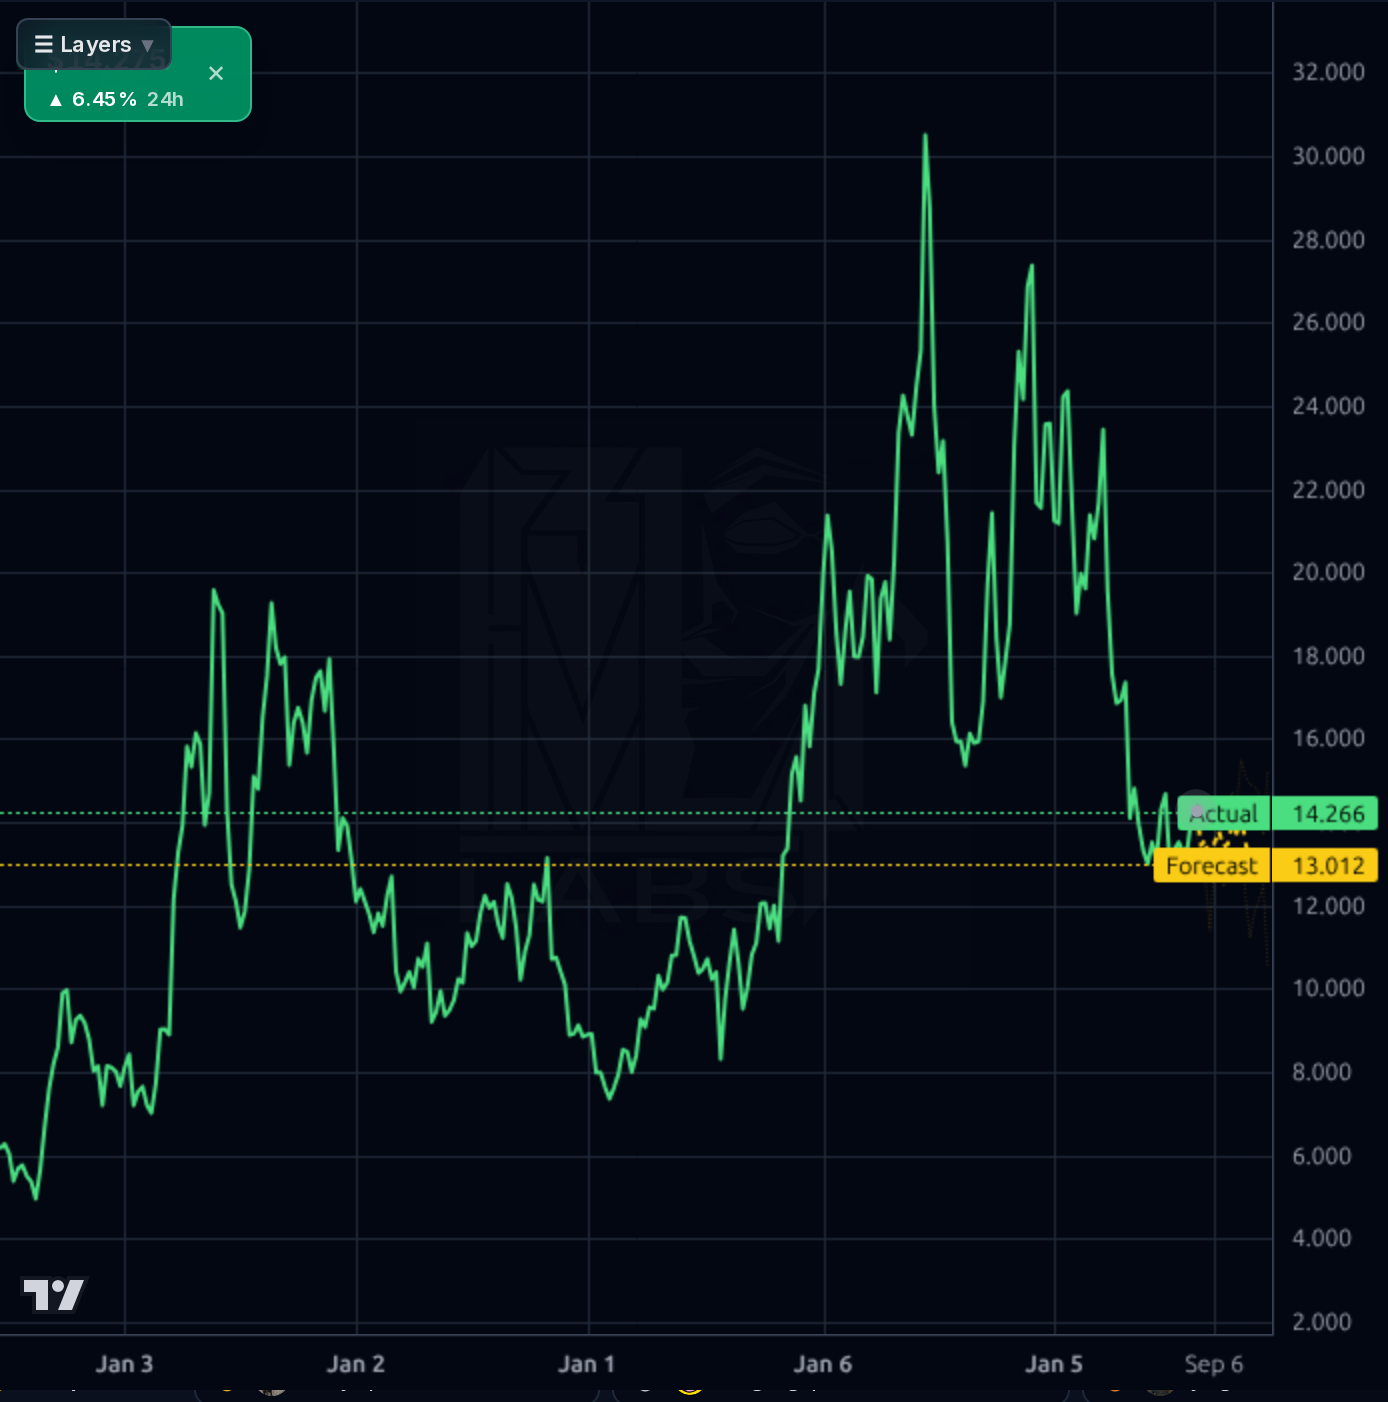
Hold near $13.41; invalidation below $12.12 triggers aggressive trimming due to balance sheet risk. The Kronos AI forecast band suggests a narrow upside range, but short-term momentum is weak given the model's high MAPE (31% for 1d).
Wait for explicit management confirmation of midstream proceeds allocation (debt paydown vs growth capex) and Q3 FCF trajectory. If gross margins recover above 20%, consider a small accumulation at $14.00; otherwise, maintain hold due to balance sheet fragility.
Long-term value hinges on successful debt reduction via midstream monetization proceeds and sustained production growth. Structural LNG/AI demand tailwinds provide upside potential but require operational stability and capital discipline to avoid further margin deterioration. The biggest risk is continued negative FCF or gross margin collapse below 10%.
Revenue growth has weakened significantly, with Q2 sales rising only 1.6% YoY to $353.3M despite a 16% production surge in Haynesville. Gross margins collapsed to 12.1% from 34.3%, and free cash flow remains negative ($-261.7M) with capex dwarfing operating cash flow. The balance sheet is critically fragile: $3.17B debt vs $45M cash (current ratio 0.48), and the $600M midstream monetization proceeds are the key catalyst for de-risking or growth capex allocation. While structural LNG/AI demand tailwinds exist, they are subordinated to operational fragility and balance sheet risk.
The chart shows a volatile downtrend with recent technical support at $12.12 (52-week low) holding but the stock trading near its 52-week high of $28.10 is unsustainable given the current fundamentals. The Kronos AI forecast band ($14.26-$18.39) suggests a narrow upside range, but the model's directional accuracy for short-term (1d) is only 51% vs naive baseline with MAPE at 31%, indicating high unreliability. Momentum is weak: the stock has been flat since $13.41 despite technical bounces off $12.85 and $12.12, and the RSI (50.81) suggests neutral momentum without clear trend direction.
The Q2 earnings report showed production surged 16% but gross margins collapsed to 12.1%, highlighting operational fragility. The Liontrust investment increase (877.8% stake growth) is positive, but the $3.17B debt vs $45M cash balance sheet remains a critical risk. Recent analyst revisions cut sales growth estimates by 30pp and EPS next year by 7.5pp, signaling deteriorating fundamentals. The Kronos AI forecast band ($14.26-$18.39) is narrow but the model's short-term accuracy is poor (MAPE 31% for 1d), making technical signals unreliable.
- $600M Sixth Street/Pinnacle midstream monetization proceeds allocation (debt paydown vs growth capex)
- Acute balance sheet fragility: $3.17B debt vs $45M cash, Current Ratio 0.48
- Q2'26 gross margin collapse to 12.1% signaling operational risk
- Four consecutive quarters of negative Free Cash Flow; capex dwarfs operating cash flow
Get AI analysis on any stock
This is one of hundreds of Kronos AI reports — scored fundamentals & technicals, bull/base/bear price targets, a multi-horizon plan, and continuously-updated forecasts across the market. Create a free account to explore them all.
Create your free account →Already a member? Sign in · Join our Discord