CSV — AI Stock Forecast & Price Targets
Published 7/13/2026 · A free sample of K3vl4r’s AI-powered analysis.
Kronos price forecasts, scored fundamentals & technicals, and a multi-horizon plan.
View the live CSV price forecast →
Carriage Services combines a defensive funeral/cemetery cash-flow profile with a stressed balance sheet ($546M debt vs $267M equity, $2.9M cash) and a stock making fresh 52-week lows near $37.11. Fundamentals are quietly improving (Q1'26 operating margin 24.1%, FCF +$11M, gross margin expansion), but price action, an Aug 5 binary earnings catalyst, and unreliable short-term model forecasts (1d accuracy 45% vs 55% naive) argue against chasing. Hold with a modest tactical bias to accumulate only on a reclaim of the $39–40 zone.
Do not initiate ahead of the Aug 5 earnings print — that is a binary catalyst ~23 days out with a stressed balance sheet, and the model's 1d forecast is below naive baseline. Tactically: hold existing positions; add only on a reclaim of $40 with volume, targeting $41.5 then $43.7. Invalidation is a daily close below $37.11 (52-week low), which opens a path to $35. Keep sizing at half normal given small-cap illiquidity (74k vs 120k avg volume) and event risk. Do not size a swing trade through the print.
1–6 month view: HOLD with a modest positive skew if the Aug 5 print validates the forward EPS trajectory and management articulates a concrete deleveraging path. Base case: $41 (roughly flat-to-+8%) as leverage overhang caps the multiple. Bull case $46–48 requires two consecutive quarters of positive FCF plus refinancing clarity. Bear case $33–35 on an earnings miss or capex re-acceleration. What changes my mind: a debt paydown announcement, sustained FCF above $30M annualized, or a break of $37 that would push me to TRIM.
1–3 year terminal thesis is a demographic-tailwind cash compounder trading at a discount because of leverage. If management can push net debt/EBITDA from ~4.5x toward 3x while holding 24% operating margins, the stock re-rates to 12–14x forward EPS on a normalized $4+ EPS, implying $50–60 fair value — consistent with the Street's $60 target and Recom 1.20. The biggest structural risk is not demand (funerals are non-discretionary) but a credit-market shock forcing dilutive refinancing before FCF fully normalizes; secondary risk is cremation mix-shift pressuring cemetery pricing over time.
Operations are quietly stabilizing but the balance sheet is the story. Q1'26 revenue of $106.1M was up modestly q/q ($105.5M in Q4'25, $102.1M in Q2'25), with gross margin expanding to 36.4% from 34.8% last quarter and operating margin holding at 24.1% for four straight quarters — evidence that pricing power in Cemetery Operations and post-restructuring cost discipline are real. Net income of $13.5M (12.7% margin) is the best quarter in the visible series, and FCF flipped positive to +$11.0M after a very lumpy stretch (Q3'25 FCF was -$38.5M on $63M capex). The problem: total debt of $546M vs stockholders' equity of $267M (D/E ~2.05), only $2.9M cash, current ratio 1.15/quick 0.99, and ROIC only 5.4% — barely covering an elevated cost of debt. Forward P/E of 10.1 on forward EPS $3.76 implies ~37% earnings growth from the $2.75 TTM base, which is aggressive given TTM EPS y/y is -8.25% and EPS Q/Q is -36.9%. Dividend is modest (1.19%, 13.8% payout) and not at risk, but management's real capital-allocation test is deleveraging, not returns. Working capital swung positive to +$7.5M — small but directionally correct.
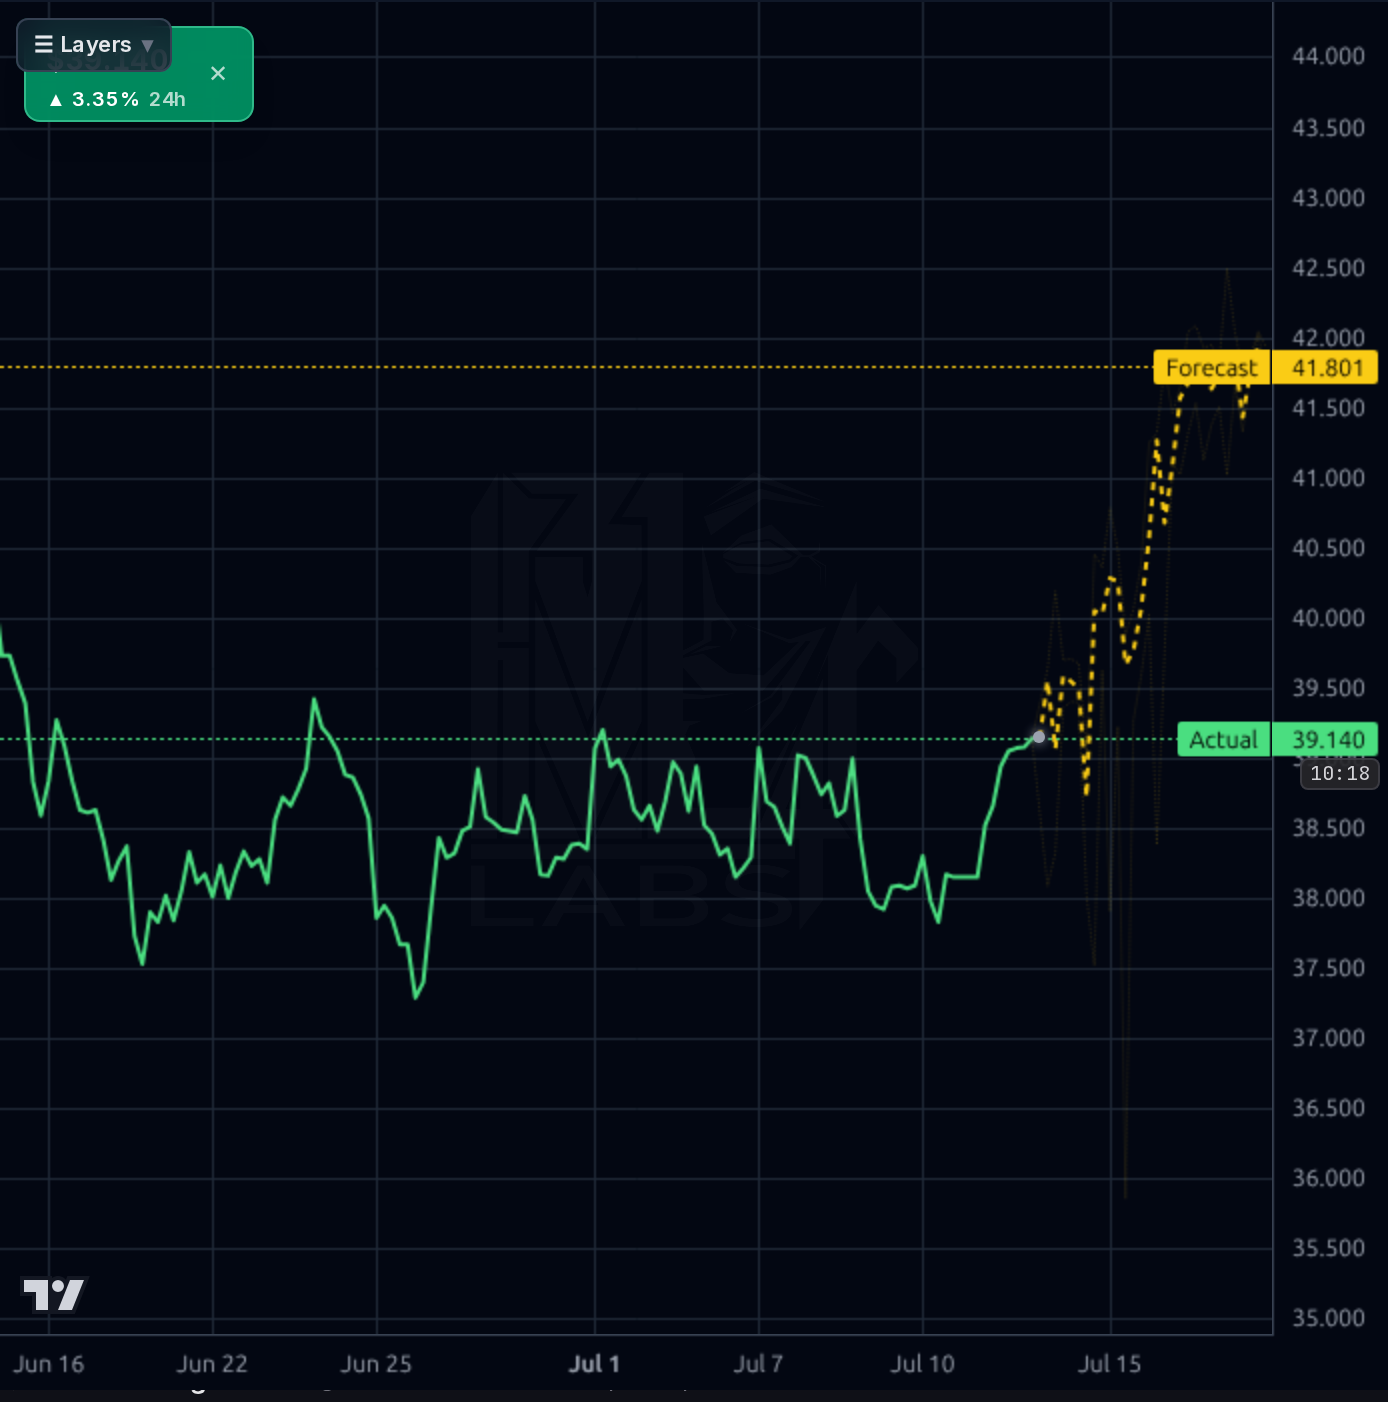
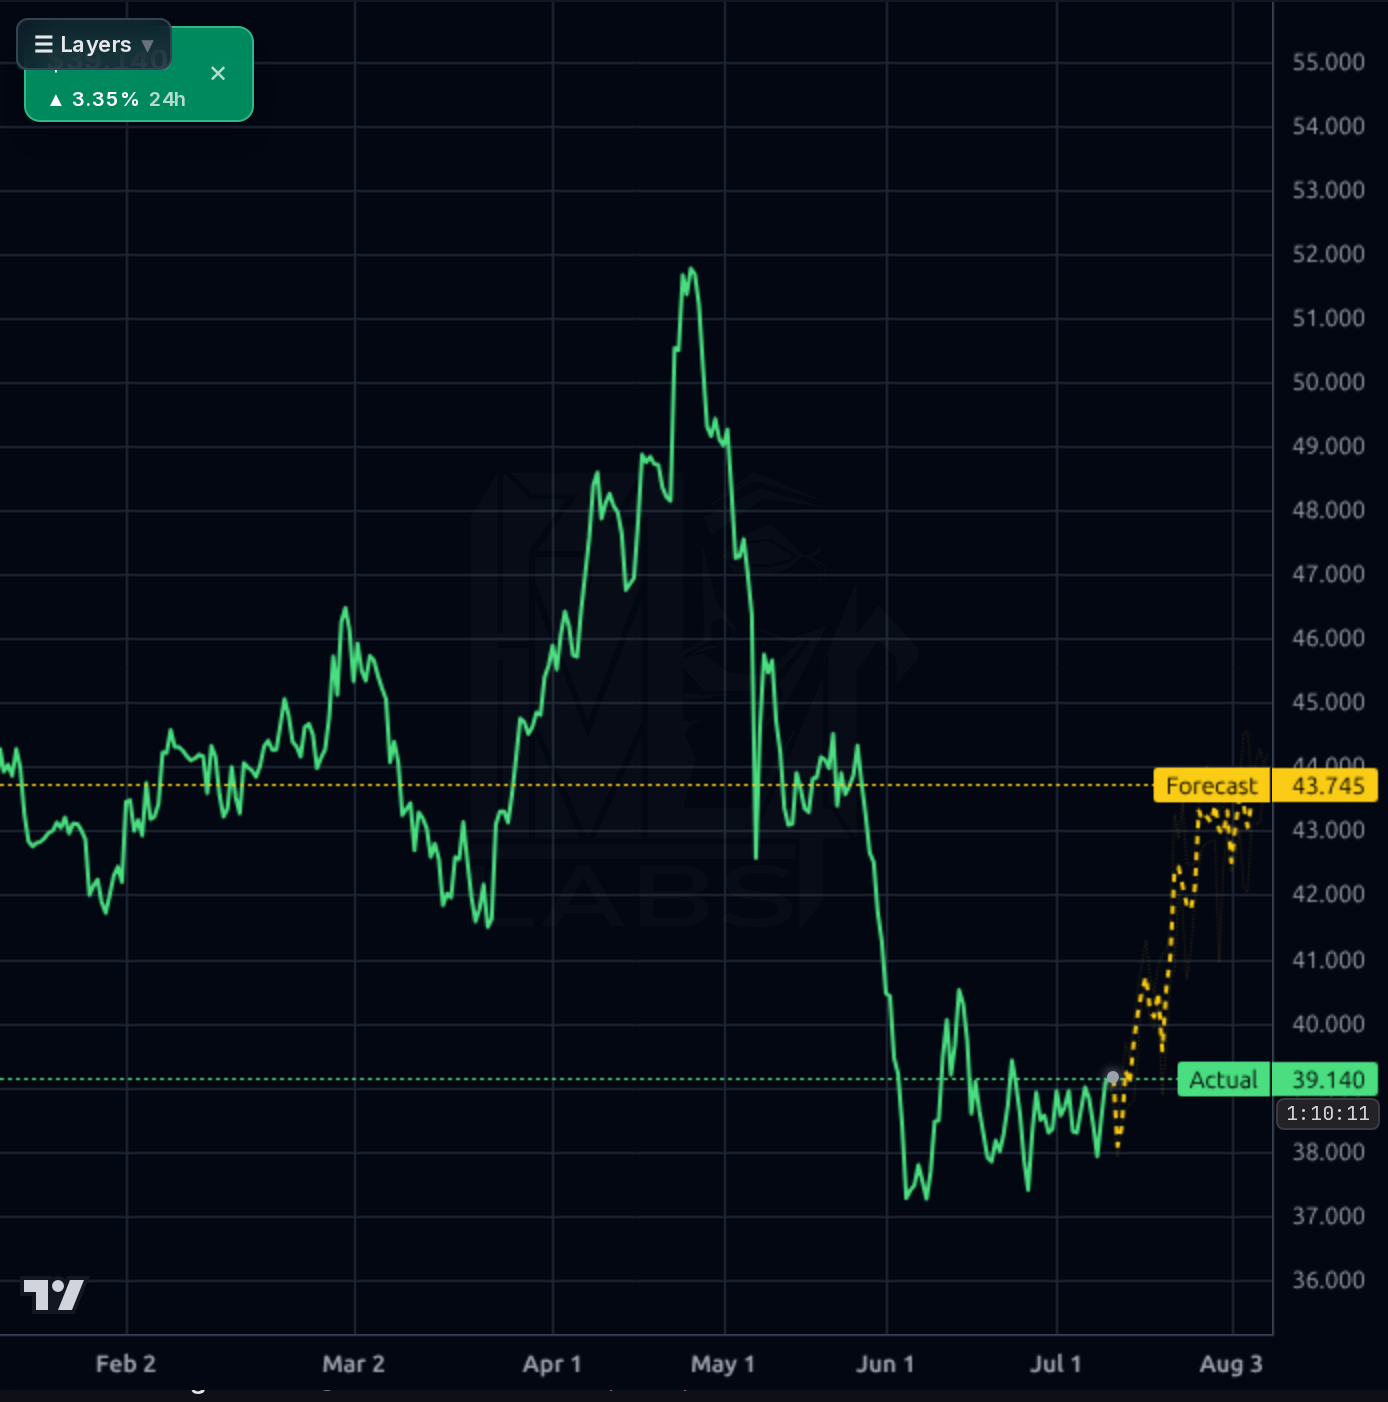
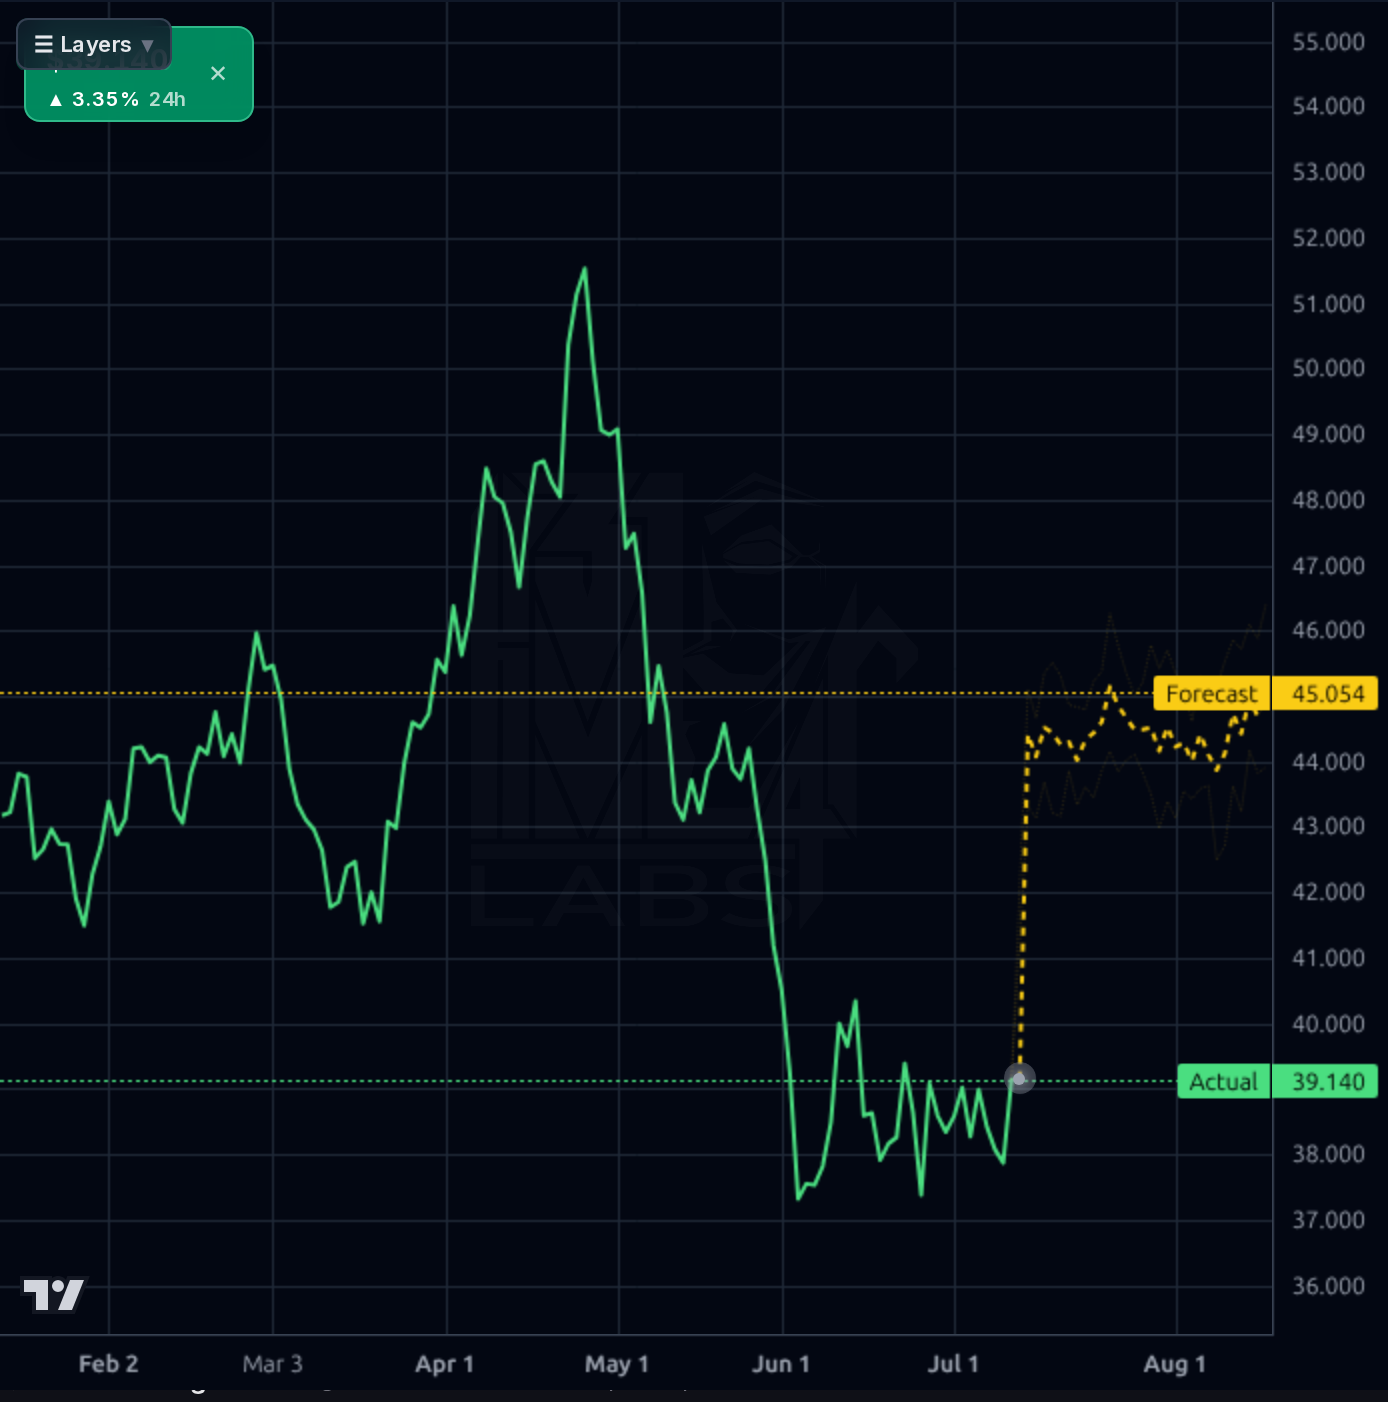
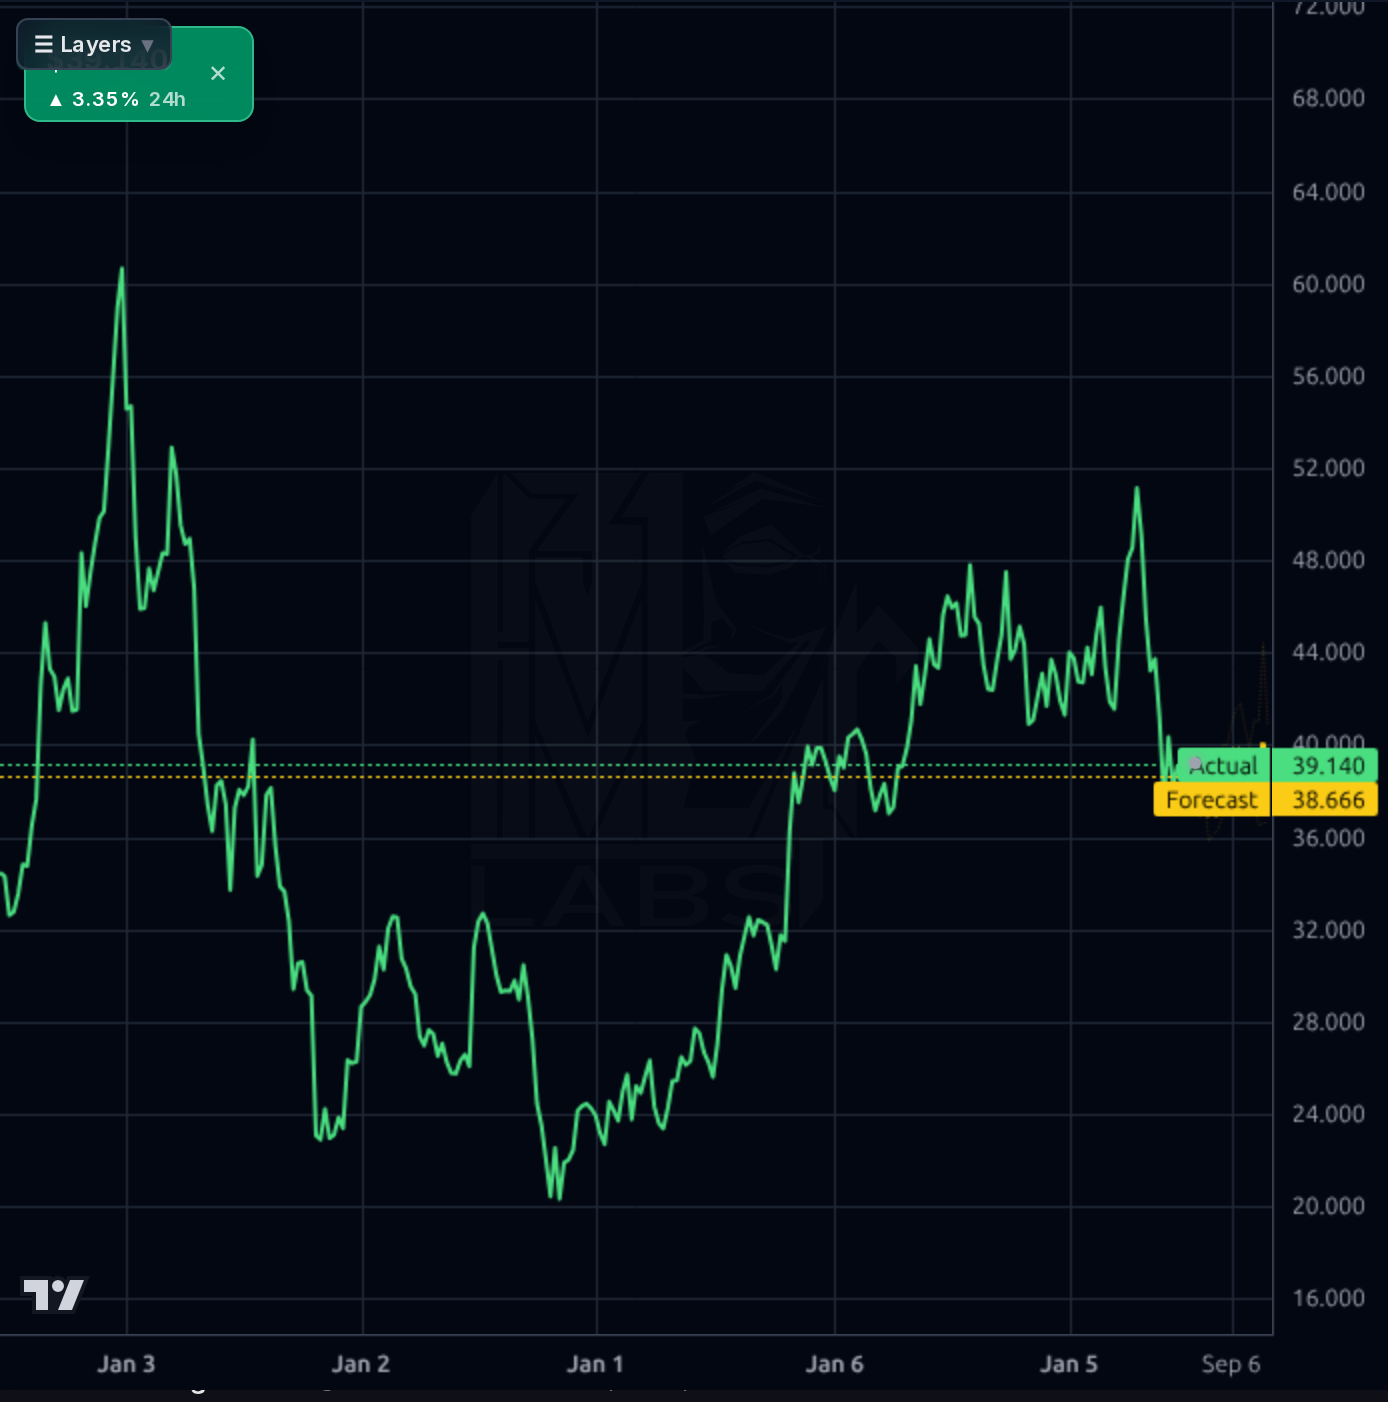
The tape is decisively bearish across timeframes. On the weekly view, price has retraced the entire early-2026 rally from the ~$51 peak in April/May back to $39.14, sitting just above the 52-week low of $37.11 (-27.3% from the $52.10 high). Daily and 4h charts show a lower-high/lower-low structure with SMA20 -1.9%, SMA50 -8.5%, SMA200 -12.8% — stacked bearish. RSI 41.3 is weak but not oversold, leaving room for further downside before a reflex bounce. Perf Quarter -22%, Perf YTD -10.5%, Perf Year -19.1% confirm a persistent distribution regime. The 1h chart shows a small bounce off ~$38 with a forecast band pointing to $41.80, and the 4h/1d forecasts extend to $43.7/$45.1 — but the model's short-term directional accuracy is 45% vs 55% naive baseline, so those aggressive upside projections should be heavily discounted. Key levels: support $37.11 (52-week low), then air pocket to ~$35; resistance $39–40 (prior consolidation floor that broke), then $41.5 and $44 (SMA50 zone). No confirmed reversal signal yet; a reclaim of $40 on volume would be the earliest constructive tell.
News flow is mixed but light on hard catalysts. A June 4 note flagged CSV among stocks selling off on renewed inflation concerns as oil approached $98, and a July 7 piece titled 'Buried But Not Forgotten' hints at a contrarian/value framing. Q1 sector reviews and small-cap coverage are neutral-to-constructive but not stock-moving. Nothing in the flow addresses the two things that actually matter here — a refinancing/deleveraging plan and the Aug 5 earnings print. Broader market context (chip earnings, crypto treasury debates) is irrelevant to CSV. Social sentiment is nominally 100% bullish but the volume is tiny and dominated by promotional WhatsApp-group spam, so it should be treated as noise, if not a mild contrarian caution flag given how thinly followed the name is.
- Balance sheet fragility: $546M debt vs $2.9M cash and D/E of 2.05 create meaningful refinancing risk if credit spreads widen
- Aug 5 earnings is a binary event with EPS Q/Q -36.9% and TTM y/y -8.25% raising miss probability
- Free cash flow is highly lumpy — Q3'25 was -$38.5M — and a single quarter of capex re-acceleration collapses the deleveraging thesis
- Technical trend is broken: 52-week low, all major MAs stacked bearish, -22% quarter performance signals institutional distribution
- Small-cap illiquidity (Avg Volume 120k, current 74k) means position exits during stress can be punitive
- Model's own short-term forecast accuracy (45% vs 55% naive baseline) is below chance — do not trust the aggressive $41–45 upside projections
- Long-term cremation mix-shift could compress cemetery pricing power that is driving current margin expansion
Get AI analysis on any stock
This is one of hundreds of Kronos AI reports — scored fundamentals & technicals, bull/base/bear price targets, a multi-horizon plan, and continuously-updated forecasts across the market. Create a free account to explore them all.
Create your free account →Already a member? Sign in · Join our Discord