CSV — AI Stock Forecast & Price Targets
Published 8/10/2026 · A free sample of K3vl4r’s AI-powered analysis.
Kronos price forecasts, scored fundamentals & technicals, and a multi-horizon plan.
View the live CSV price forecast →
Carriage Services faces structural headwinds from extreme leverage ($549M debt vs $279M equity) despite resilient operational metrics (23% operating margins). Recent earnings misses and guide cuts confirm volume softness, while technical breakdown below 52-week lows at $35.87 signals further downside risk. The stock's current price is trading near the lower end of its historical range with no clear catalyst to reverse the trend.
Hold until $35.29 holds; if broken, trim to 50% position with stop-loss at $34.50. Invalidation: close below $34.50 or Q3 FCF < $5M.
Wait for earnings catalyst (Nov 4) and debt refinancing news. Target range $38-$42 if volume stabilizes; otherwise, expect further downside to $32-35 due to leverage constraints. Catalyst: positive guidance on preneed backlog conversion or debt restructuring.
Terminal thesis is a defensive utility play with pricing power but trapped by unsustainable leverage. Long-term value hinges on successful deleveraging (e.g., refinancing) or volume recovery; otherwise, the stock remains vulnerable to further repricing due to high debt load and low FCF generation.
Revenue growth has decelerated (Q2 sales flat YoY at $102.9M) despite strong preneed pricing power (+17.3% avg price). Operating margins remain robust at 23.4%, but FCF collapsed to $2.2M from Q1's $11M, undermining deleveraging potential. The balance sheet is critically stressed with debt-to-equity of 196.6x and a current ratio of 1.455. Management has cut FY2026 sales guidance to $435-445M from $440-450M, confirming volume headwinds. While preneed insurance-funded contracts provide backlog resilience, the debt load remains the dominant risk factor.
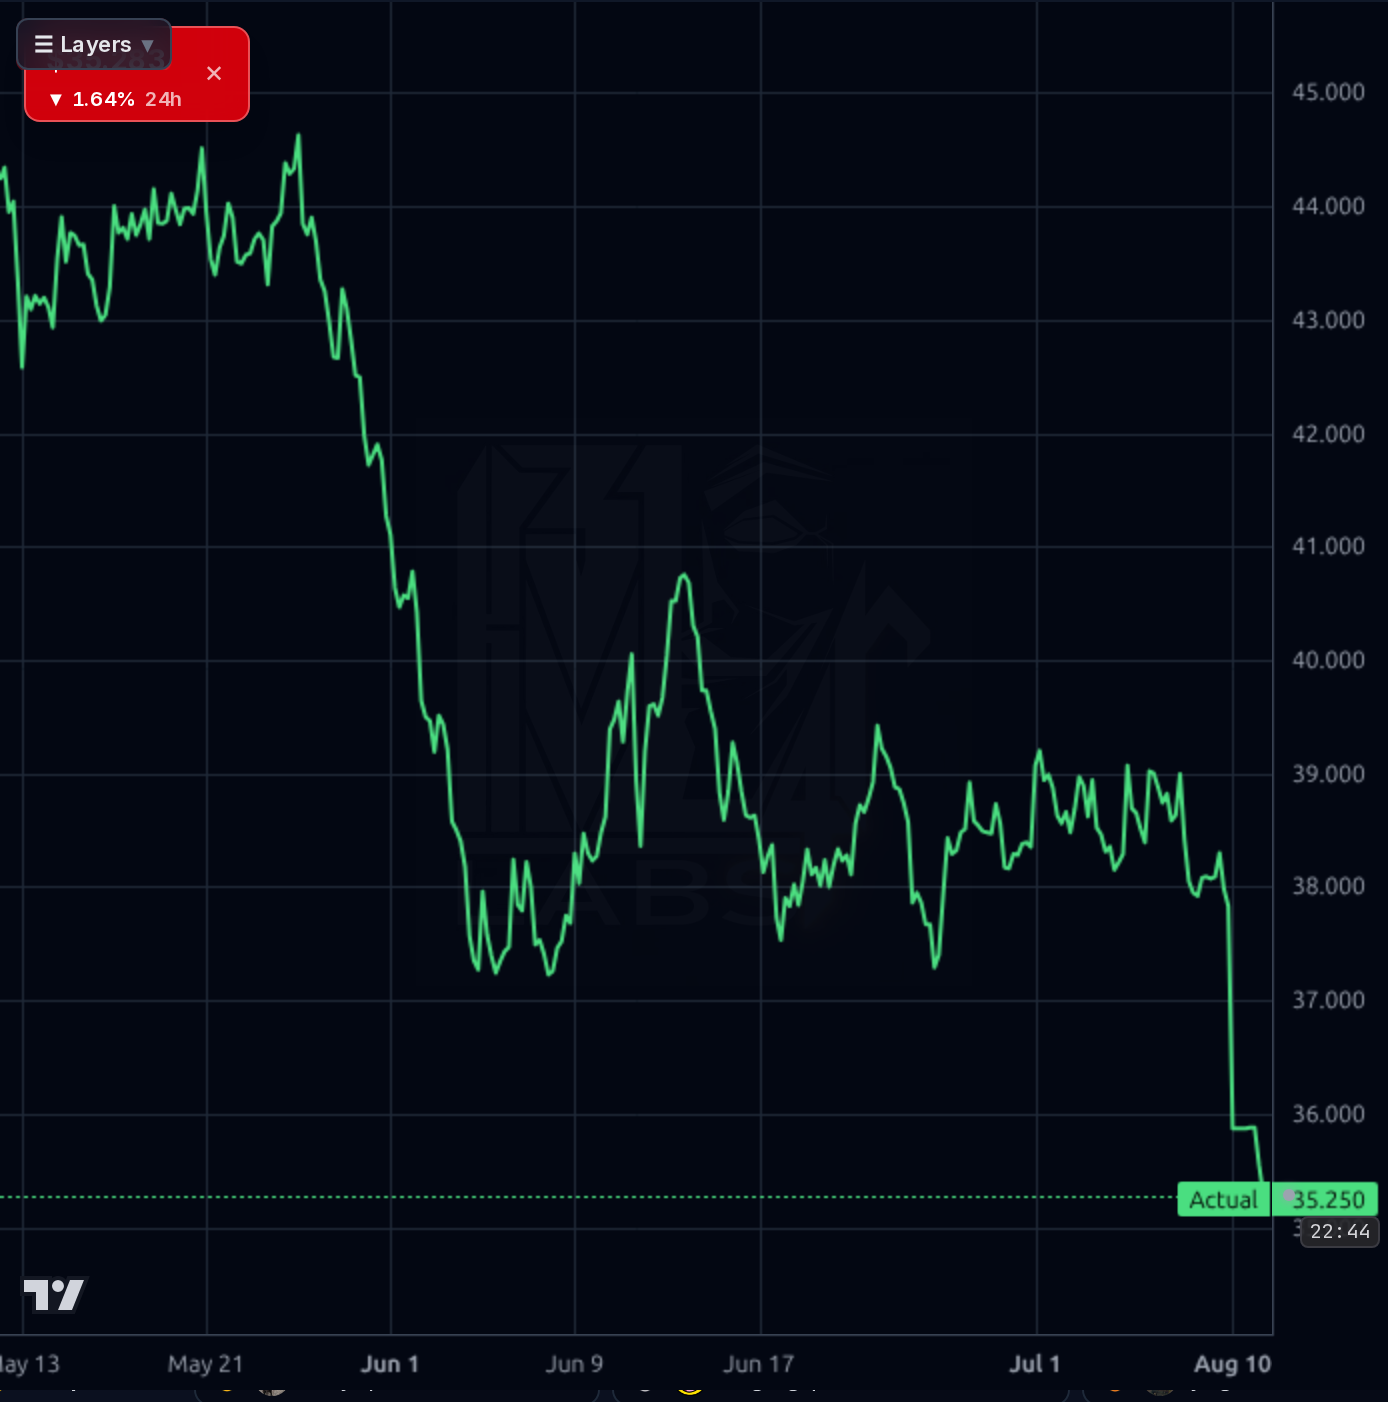
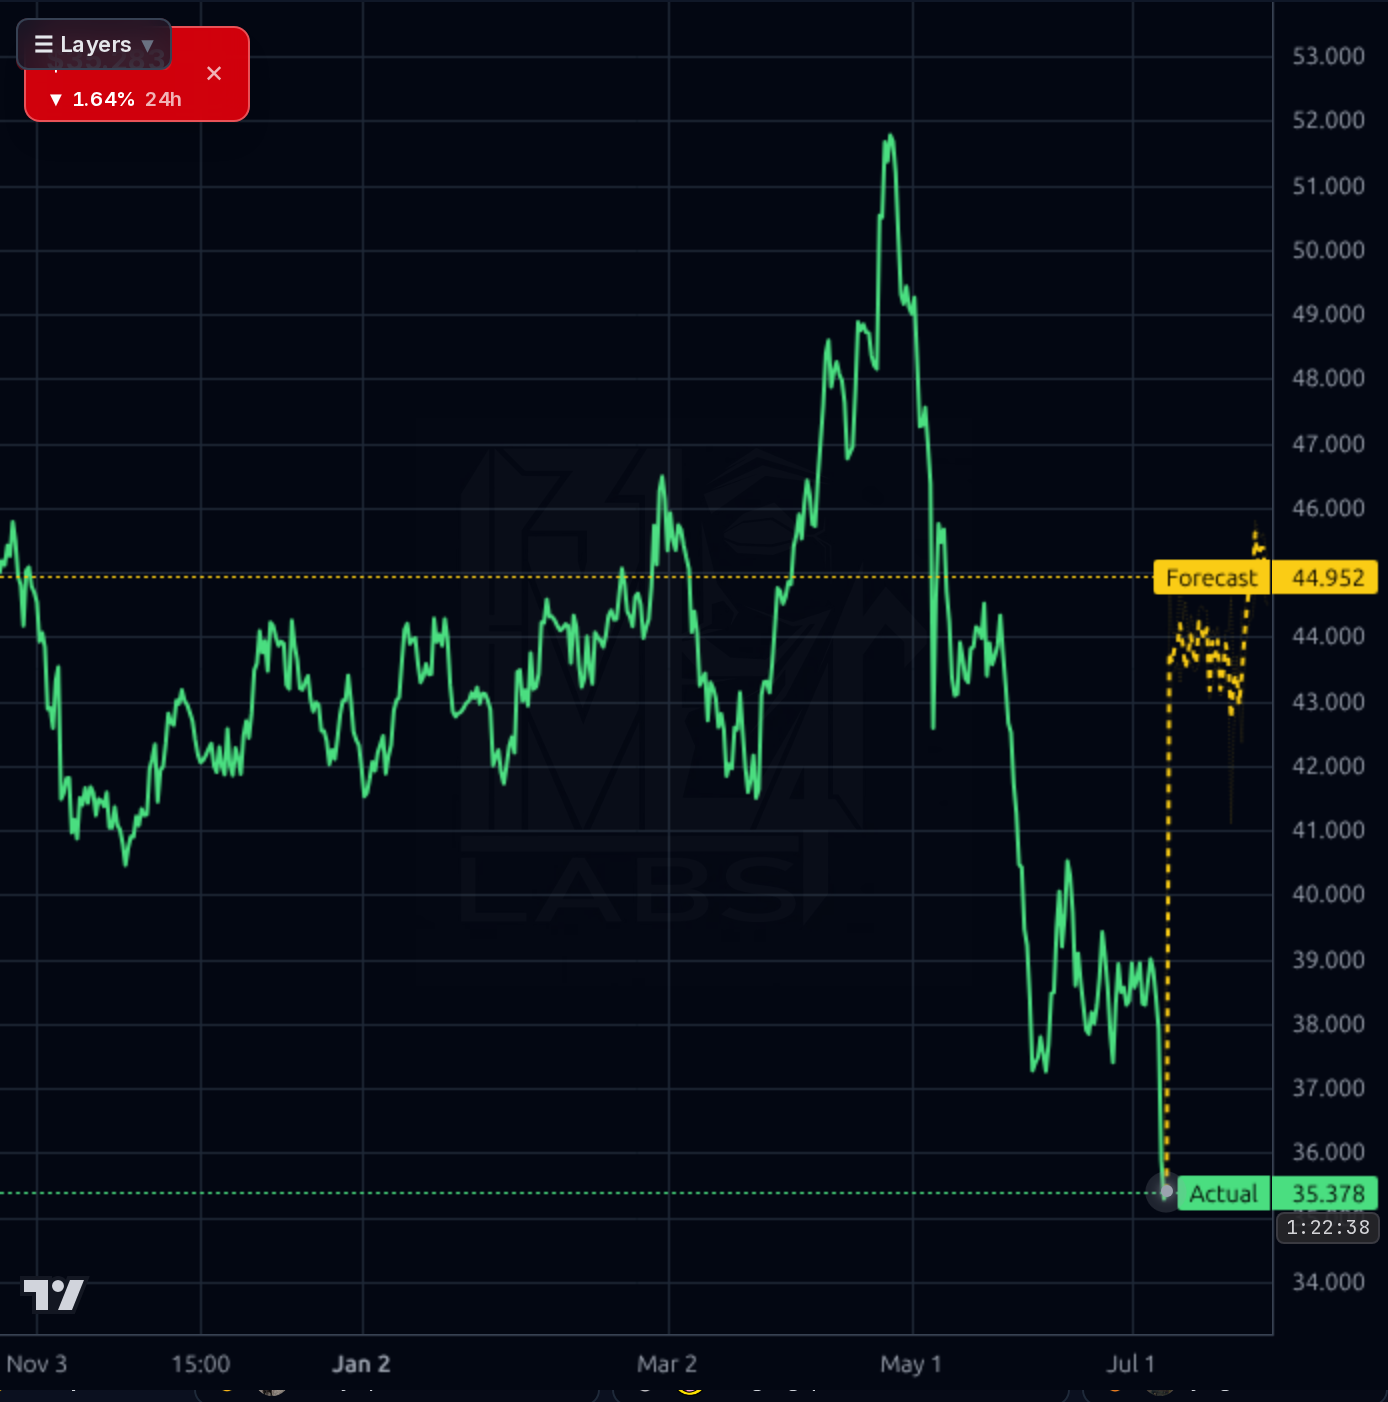
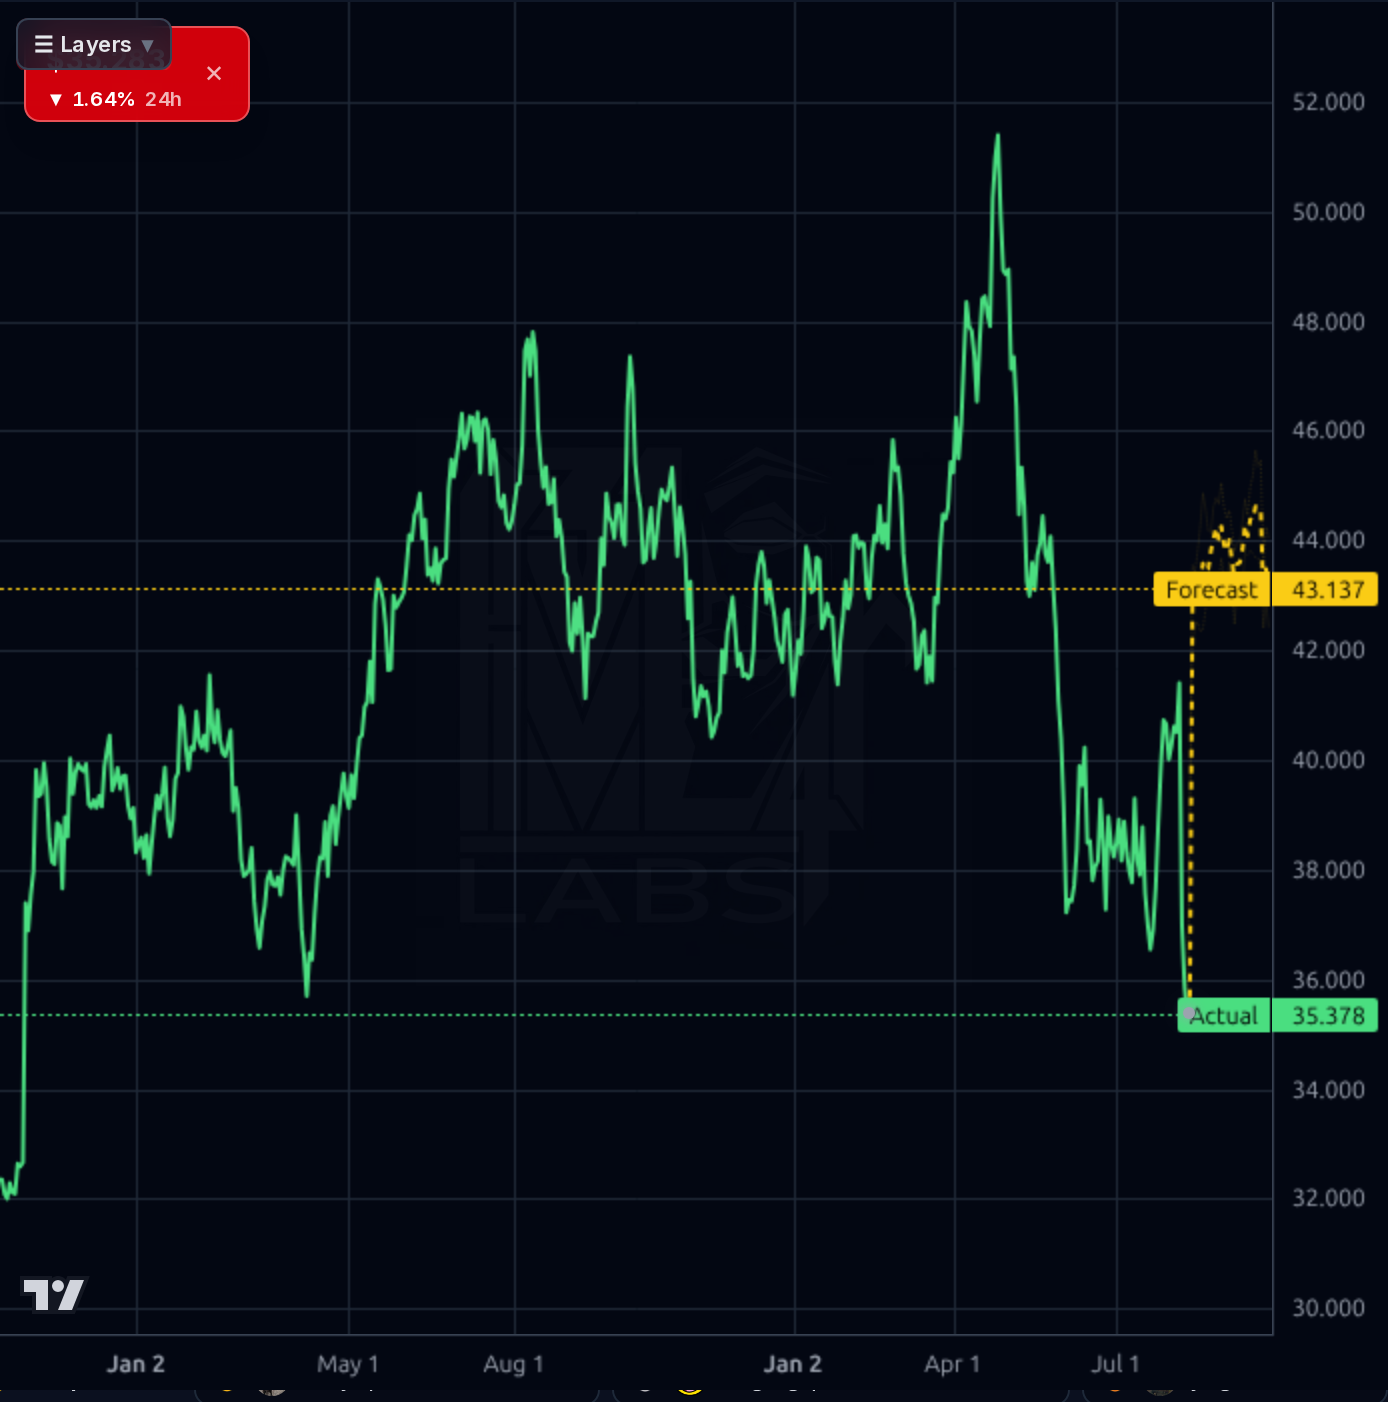
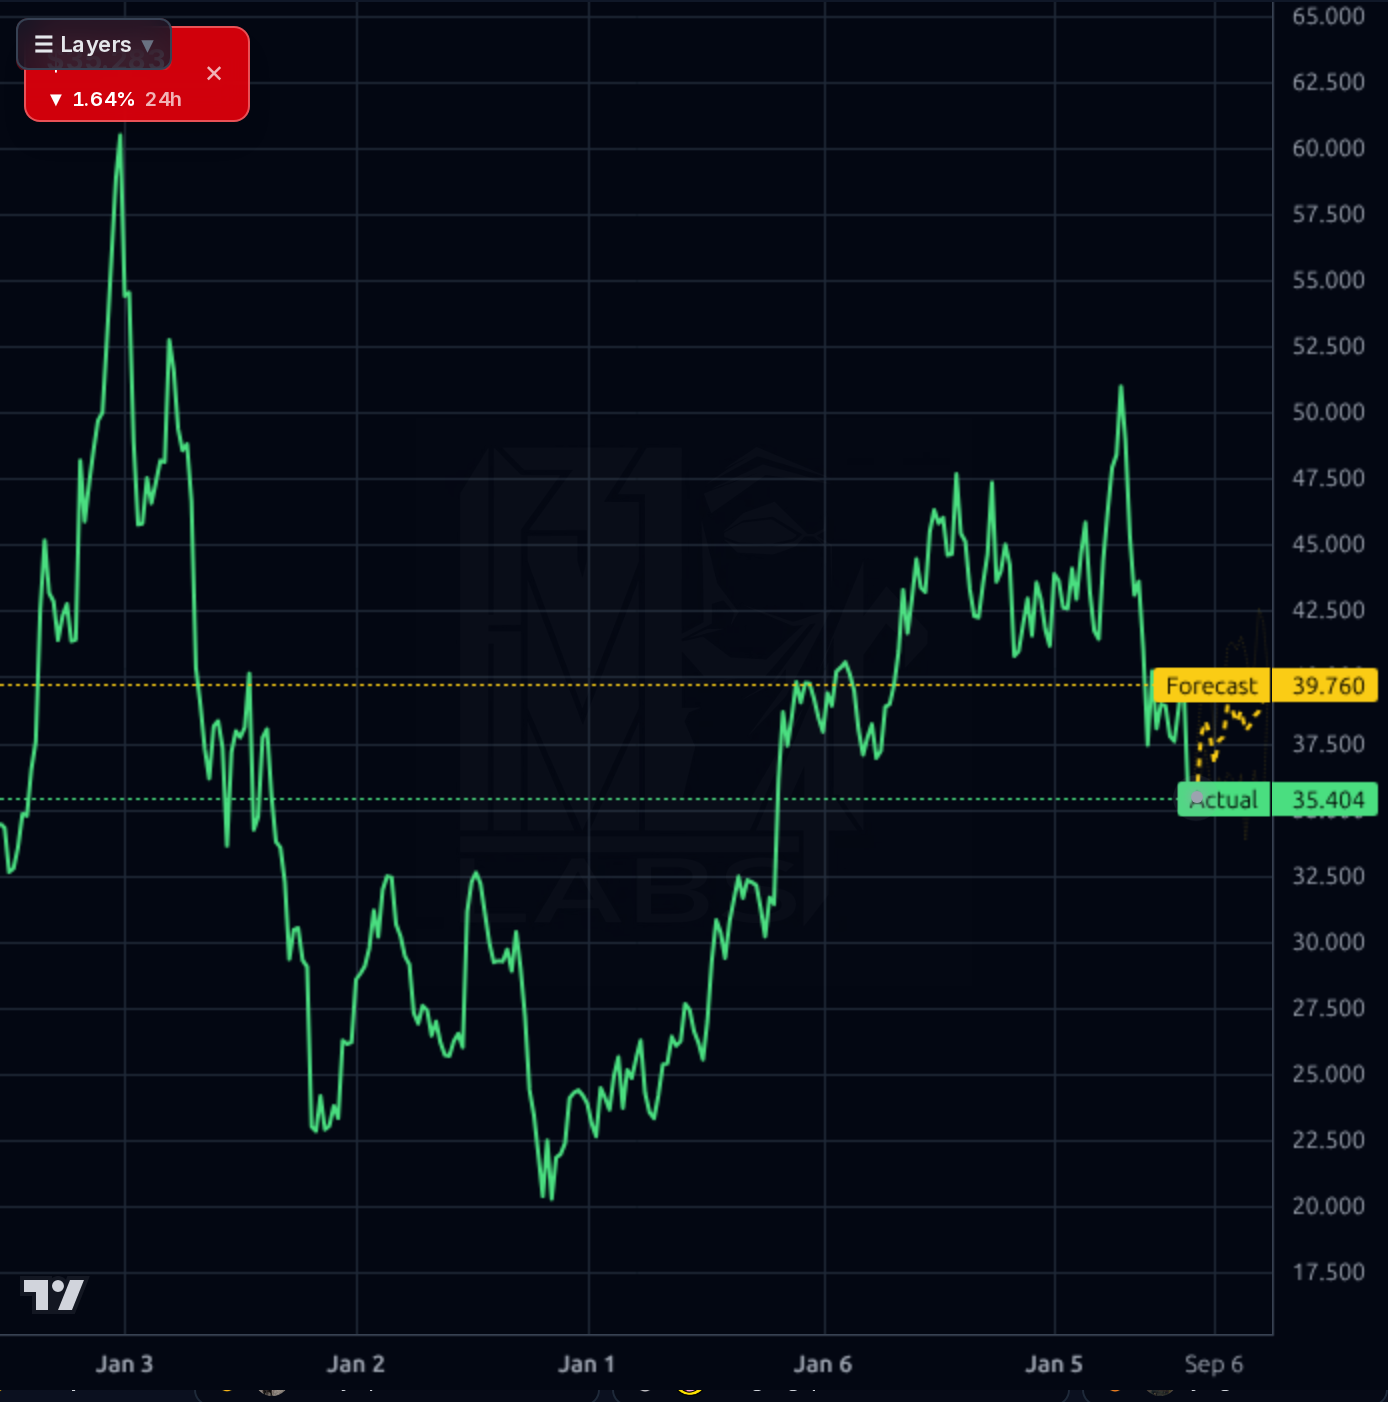
The chart shows a clear breakdown below 52-week lows at $35.87 with no meaningful support in sight. The forecast band (yellow) is significantly above actual price action, indicating model overconfidence. Key resistance levels are broken at $43.13 and $39.76, while the current price sits near the lower end of the 52-week range ($35.29-$52.10). The SMA20 (-7.7%) and SMA50 (-7.63%) are both in negative territory, confirming weak momentum. Technical support at $35.29 is fragile given the recent volume spike to 481K shares.
Recent earnings misses (adj EPS $0.78 vs $0.81 estimate) and sales guidance cuts confirm persistent volume softness. Management cited pricing gains but failed to offset declining funeral volumes, with Q2 revenue flat YoY at $102.9M. The stock's technical breakdown below $35.87 invalidates prior support levels, while the forecast band (yellow) remains above actual price action, suggesting model overconfidence. Retail sentiment is overwhelmingly bullish but irrelevant given structural leverage risks.
- Preneed insurance-funded contract growth continues to build a multi-year revenue backlog
- Q2 pricing gains (+17.3% avg price) offset immediate volume softness
- Extreme leverage ($549M debt vs $279M equity) with no clear refinancing plan
- Confirmed deceleration in sales guidance due to persistent mortality/volume headwinds
- Lumpy FCF undermines predictable deleveraging cadence
- Technical breakdown below 52-week lows suggests further downside discovery
Get AI analysis on any stock
This is one of hundreds of Kronos AI reports — scored fundamentals & technicals, bull/base/bear price targets, a multi-horizon plan, and continuously-updated forecasts across the market. Create a free account to explore them all.
Create your free account →Already a member? Sign in · Join our Discord