CSV — AI Stock Forecast & Price Targets
Published 7/24/2026 · A free sample of K3vl4r’s AI-powered analysis.
Kronos price forecasts, scored fundamentals & technicals, and a multi-horizon plan.
View the live CSV price forecast →
Carriage Services remains a defensive cash-flow business trapped inside a stressed balance sheet ($546M debt vs $267M equity, D/E 2.05) with the stock pinned near 52-week lows at $37.77 and drifting into a binary Aug 5 earnings print. Operational metrics (Op margin 24.1%, GM 36.4%, Q1'26 FCF +$11M) support a modest re-rating case, but the forecast model is unreliable (1d directional accuracy 21% vs 80% baseline), technicals are broken (-12.35% vs SMA200, -21.56% quarter), and prior bull targets in the $46-48 area have repeatedly failed to print — HOLD into the print.
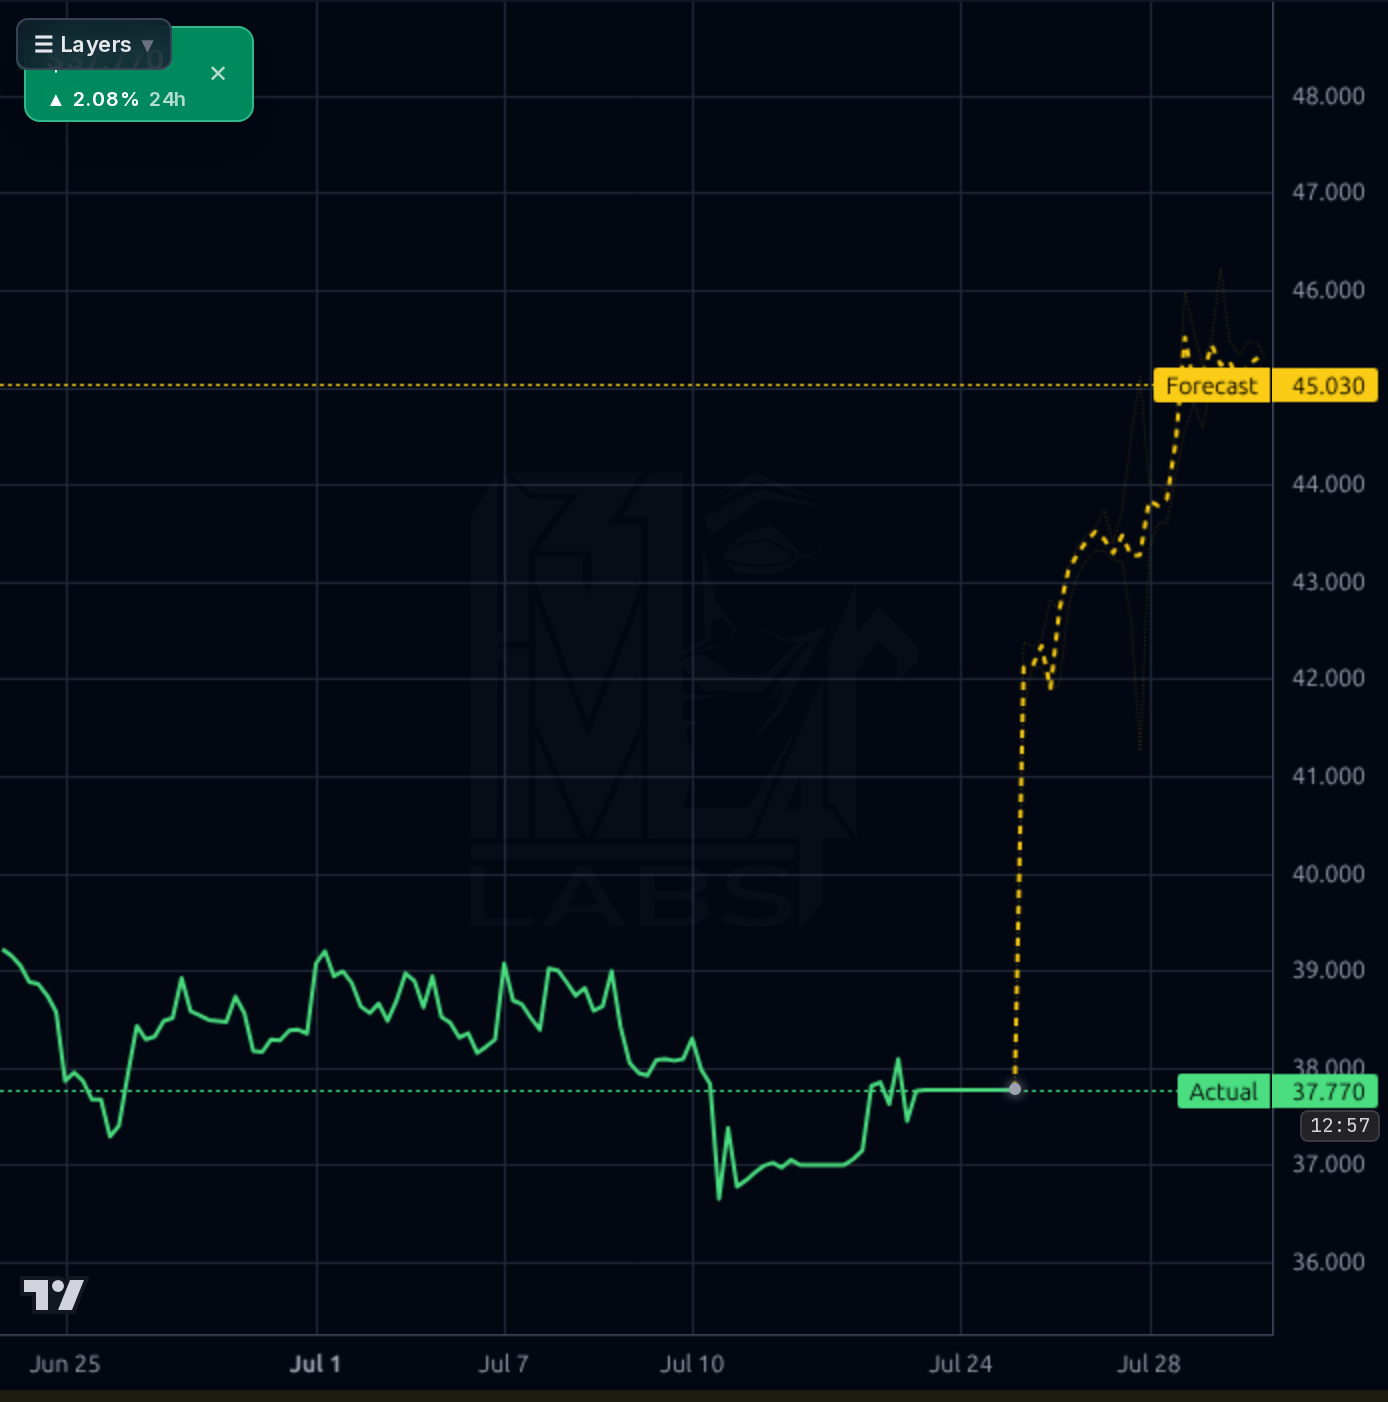
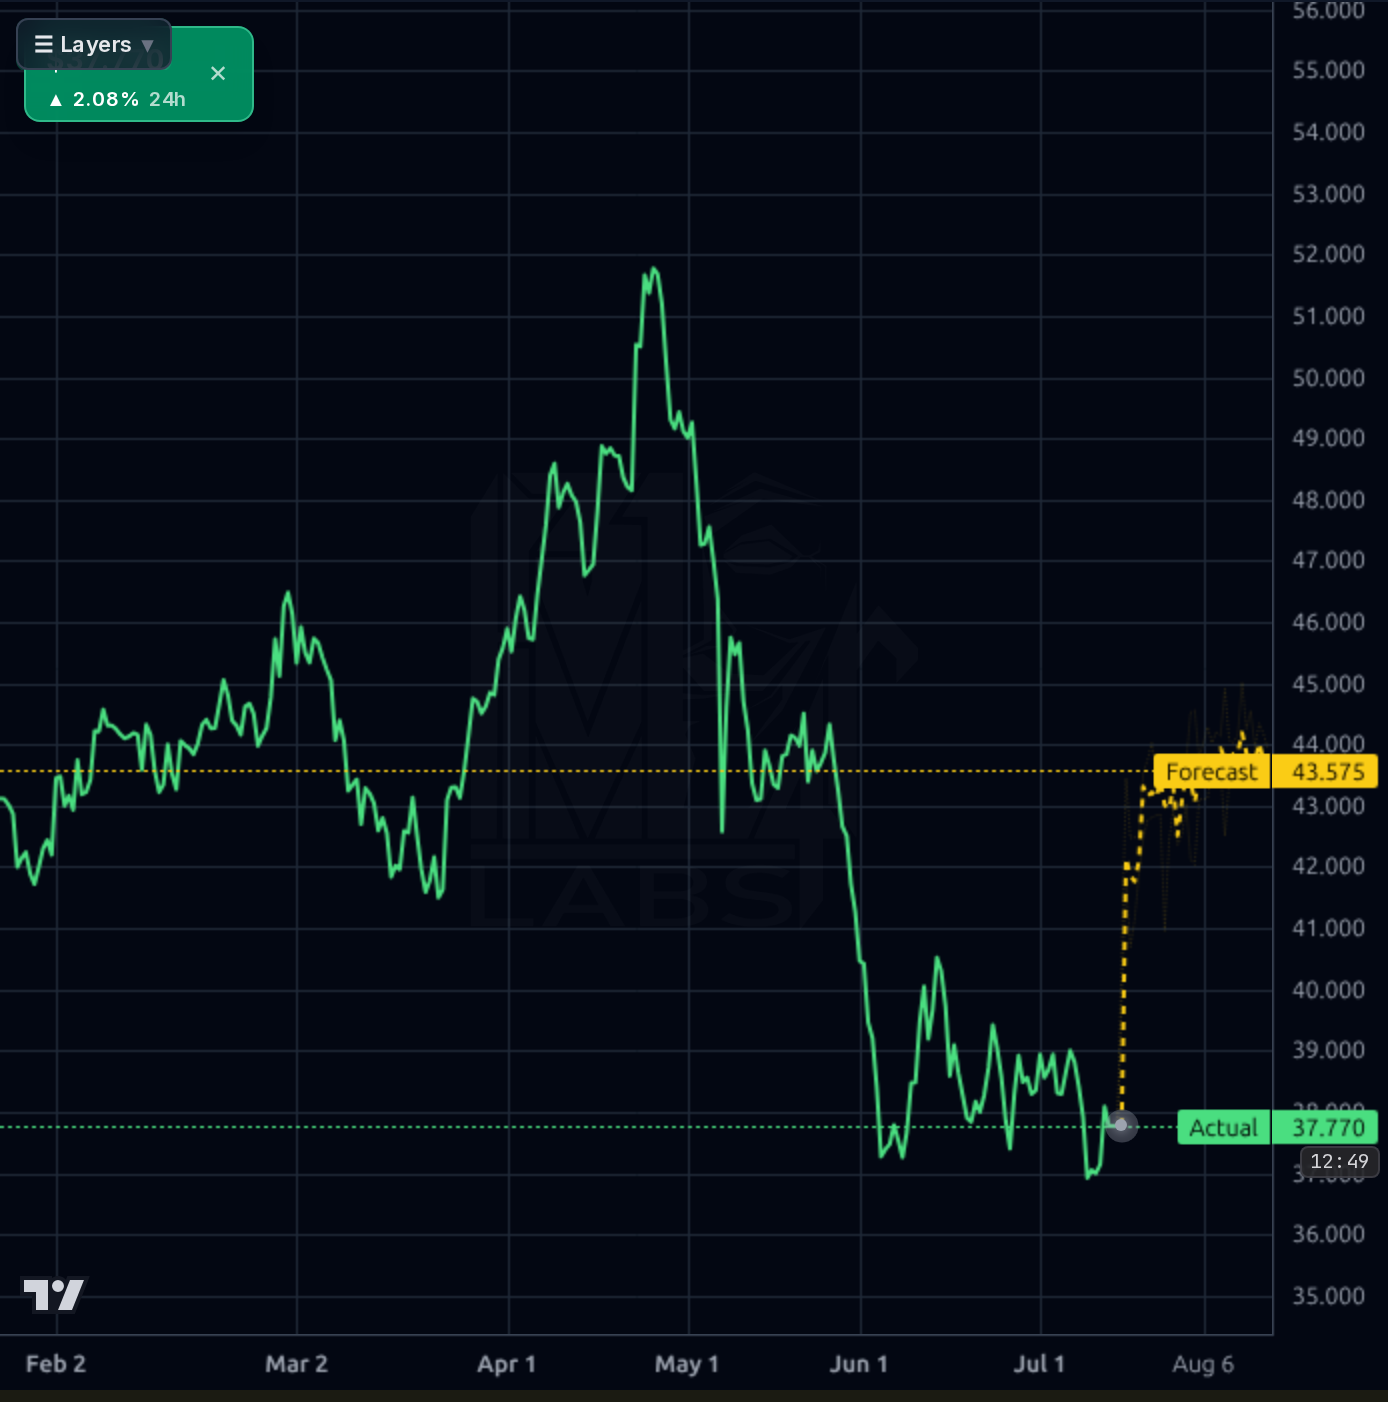
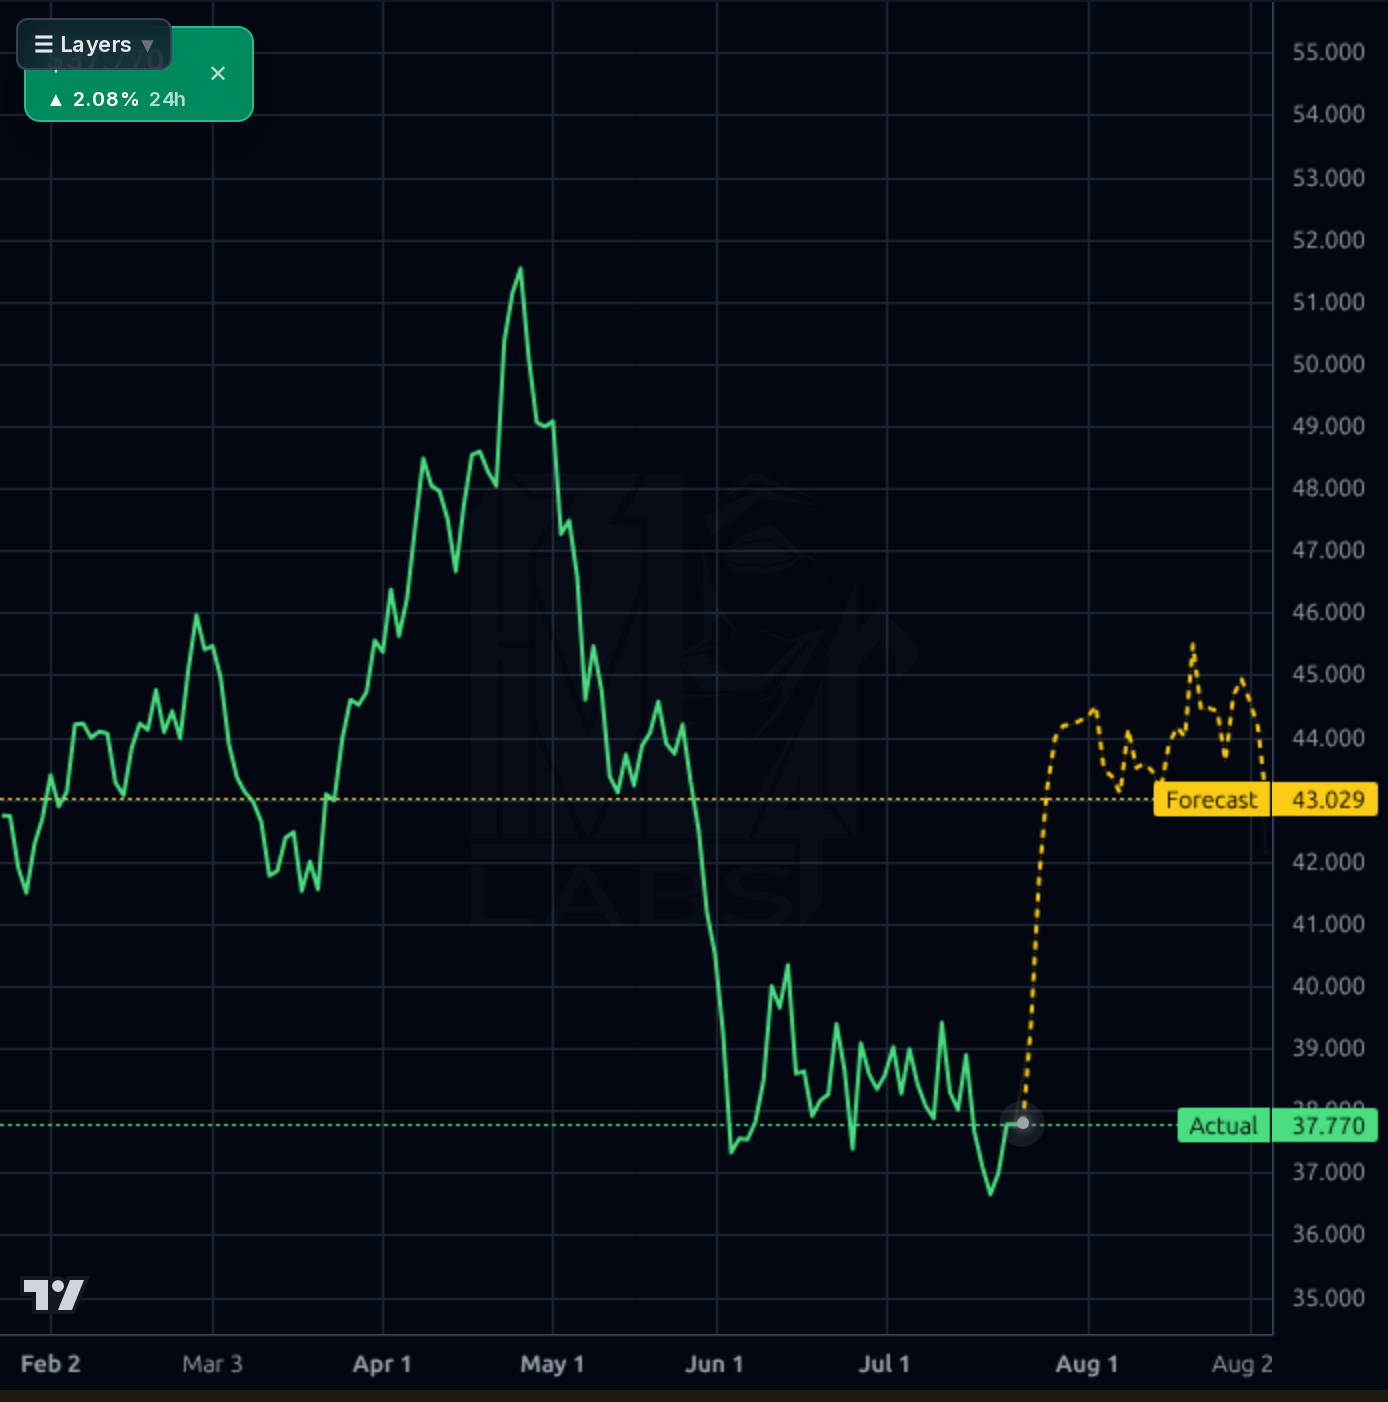
HOLD / do not initiate a swing into the Aug 5 print. The setup is binary: an in-line-or-better beat with any deleveraging commentary could reclaim $39-$40 and open $42; a miss or guide cut breaks $36.39 and targets $33-$34. Analyst recom score of 1.20 and $60 sell-side target set a high expectations bar into the print. For existing holders: trim into any pre-earnings rip toward $39-$40 (which the unreliable model is projecting); consider protective puts given IV will crush post-print. Invalidation for any tactical long: close below $36.39 on volume. Do not trust the model's vertical $45 forecast — 1d directional accuracy is 21% vs 80% naive.
1-6 month base case is a range-bound stock $37-$42 pending confirmation that Q1'26's +$11M FCF and 24% op margin were the start of a trend rather than a one-off. A confirmed reclaim of $40 with a second consecutive positive-FCF quarter and explicit debt-paydown commentary would credit a move to $44-$46 (fwd P/E ~12x on $3.76 EPS). Absent that, gravity toward the low-$30s persists given leverage and a deteriorating small-cap tape. Change-of-mind triggers: sustained close above $40 on volume (bullish), or a broken $36.39 with widening credit spreads (bearish).
1-3 year terminal thesis rests entirely on deleveraging. If management can compound Q1-run-rate FCF (~$45M annualized) and direct it at the $546M debt stack while maintaining 24% op margins, the equity re-rates toward book (~$16.82/sh × improving multiple) plus earnings power — a plausible $50-$60 outcome consistent with the sell-side $60 target. The structural risk is unchanged: refinancing at higher rates, a cemetery pricing-power reversal, or any capex spike (as in Q3'25) resets the deleveraging clock and keeps the equity in a low-multiple penalty box. Secular demographic demand is a floor, not a re-rating catalyst on its own.
Operationally CSV is quietly healthy: TTM revenue $416M with Q1'26 revenue $106.1M (up sequentially from $105.5M/$102.7M/$102.1M), operating margin 24.1%, gross margin 36.4%, and net income $13.5M for the quarter — a clear step-up in profitability versus the $6.6M Q3'25 dip. ROE 17.99% and operating cash flow $61.8M TTM show the underlying utility-like economics are real. The problem is the capital structure: $546M total debt against only $2.9M cash and $267M equity (D/E 2.05, LT Debt/Eq 2.03), a working capital cushion of just $7.5M, and an EV/EBITDA of 9.4x that leaves little room for error. FCF is lumpy — Q1'26 +$11M and Q4'25 +$3.7M look normalized, but Q3'25 was -$38.5M on $63M capex — so a coherent deleveraging story still hasn't been established. Valuation is undemanding (fwd P/E 10.0, P/S 1.44, P/FCF 14.8) IF the implied ~37% forward EPS growth toward $3.76 prints; without that, the multiple isn't cheap enough to overcome the leverage overhang.
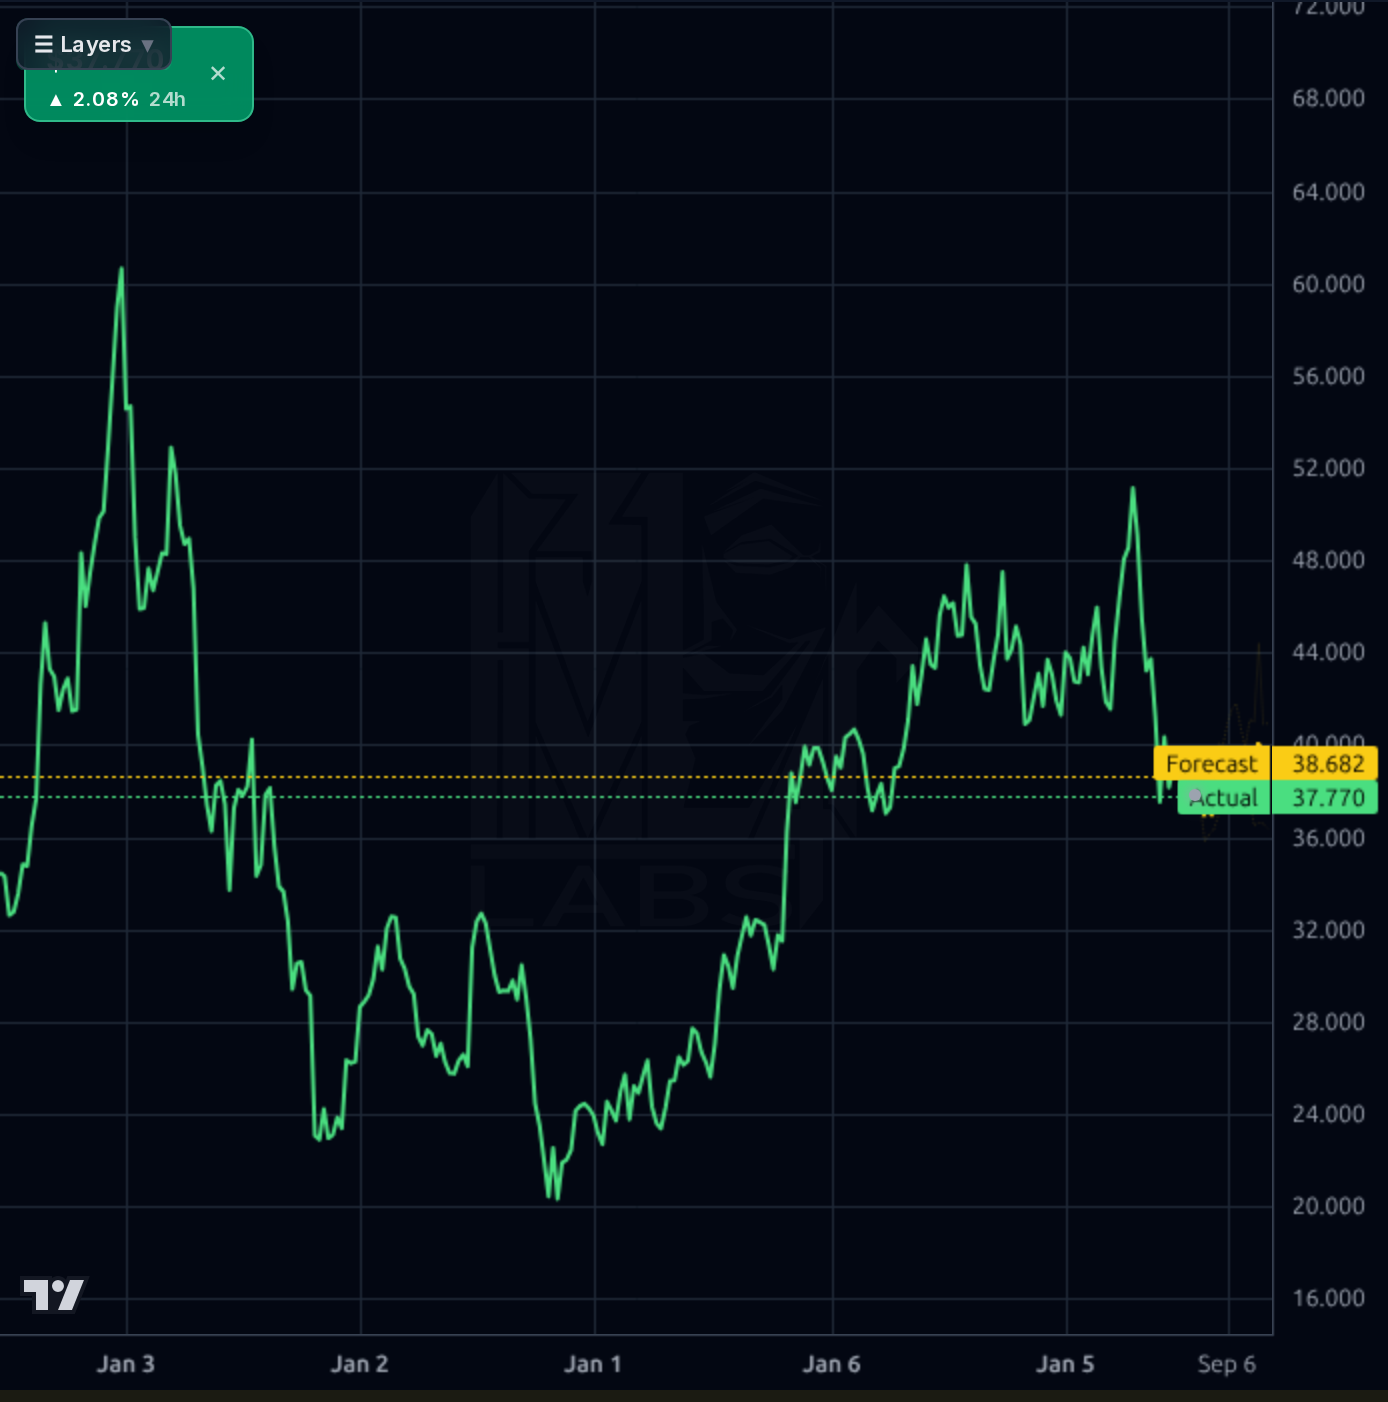
The chart is broken across every timeframe. On the 1D chart CSV has round-tripped from $51 in early May to a fresh 52-week low near $36.39, currently at $37.77 (-27.5% from 52W high, -21.56% quarter, -11.9% half-year), sitting -1.05% below SMA20, -4.92% below SMA50 and -12.35% below SMA200 — a textbook downtrend with SMA200 acting as overhead resistance. RSI 45.7 is neutral-weak, not oversold enough to signal capitulation. Key support is the $36.39-$37.00 shelf that has held twice; loss of it opens air to the low-$30s. Overhead, $39-$40 is the first supply zone (prior consolidation and where the last pop was sold per crowd chatter), then $42-$44, then $46. The model's yellow forecast band projects a vertical rip to $43-$45 within days across all three timeframes — but realized directional accuracy is 21% (1d) and 17% (1wk) vs naive baselines of 80%+, meaning the model is systematically wrong in this regime and its bullish gap projection should be heavily discounted. Prior bull targets at $46+ have failed to print for multiple cycles.
Signal: (1) A July 21 sell-side piece explicitly frames CSV as a sell candidate after a 13.5% six-month drawdown versus SPY +8.4%, reinforcing the technical breakdown narrative. (2) Management declared a quarterly dividend (ex-date Aug 3, ~$0.45 annualized, 1.19% yield, payout 13.8%) — a small positive on capital allocation discipline but immaterial to the deleveraging math. (3) A contrarian Seeking Alpha piece ("Buried But Not Forgotten") suggests deep-value interest is forming. Noise: Crypto and rate-expectation headlines are irrelevant to a domestic funeral operator. The macro backdrop (SPY late markup/distribution, breadth deteriorating to 49.6% >200dMA) is a modest headwind for a broken small-cap chart but not decisive. The key catalyst is the Aug 5 AMC earnings print — everything else is secondary.
- Aug 5 earnings print — must validate ~37% forward EPS growth trajectory implied by $3.76 fwd EPS vs $2.75 TTM
- Sustained free cash flow normalization after Q1'26 +$11M and Q4'25 +$3.7M, needed to establish a coherent debt-paydown narrative against $546M total debt
- Cemetery Operations pricing-driven margin expansion — gross margin already at 36.4%, operating margin sustaining 24%+
- Any explicit refinancing / debt reduction guidance from management to compress the leverage-driven multiple discount (currently fwd P/E ~10x vs peers)
- Dividend continuity (Aug 3 ex-date, 13.8% payout ratio leaves ample room) as a signal of management confidence in cash generation
- Balance sheet: $546M debt vs $2.9M cash and $267M equity (D/E 2.05) with refinancing risk in a higher-rate environment
- Aug 5 binary earnings event with EPS/Sales surprise history negative (-1.83%/-4.73%) and stock already at 52-week lows
- Technical breakdown: -27.5% from 52W high, -12.35% below SMA200, no confirmed base — a break of $36.39 opens the low-$30s
- Model unreliability in this regime — 1d directional accuracy 21% vs 80% naive baseline means the bullish forecast band should not be traded
- Lumpy FCF: Q3'25 was -$38.5M on $63M capex, undermining any straight-line deleveraging narrative
- Small-cap headwind: RUT-listed name in a market where breadth is deteriorating (49.6% >200dMA) and small-caps underperforming
- Concentrated insider/institutional ownership (Inst 80%, Insider 11%) with only 14.1M float means forced-selling episodes can be violent
Get AI analysis on any stock
This is one of hundreds of Kronos AI reports — scored fundamentals & technicals, bull/base/bear price targets, a multi-horizon plan, and continuously-updated forecasts across the market. Create a free account to explore them all.
Create your free account →Already a member? Sign in · Join our Discord