DHI — AI Stock Forecast & Price Targets
Published 7/31/2026 · A free sample of K3vl4r’s AI-powered analysis.
Kronos price forecasts, scored fundamentals & technicals, and a multi-horizon plan.
View the live DHI price forecast →
D.R. Horton (DHI) shows resilience despite cyclical headwinds with strong fundamentals and a contrarian buy setup, but technicals indicate near-term pressure from a 24h downtrend and forecast bands suggesting volatility. The stock trades at a discount to its 52-week high with solid cash flow and margin quality, though elevated mortgage rates pose a key risk.
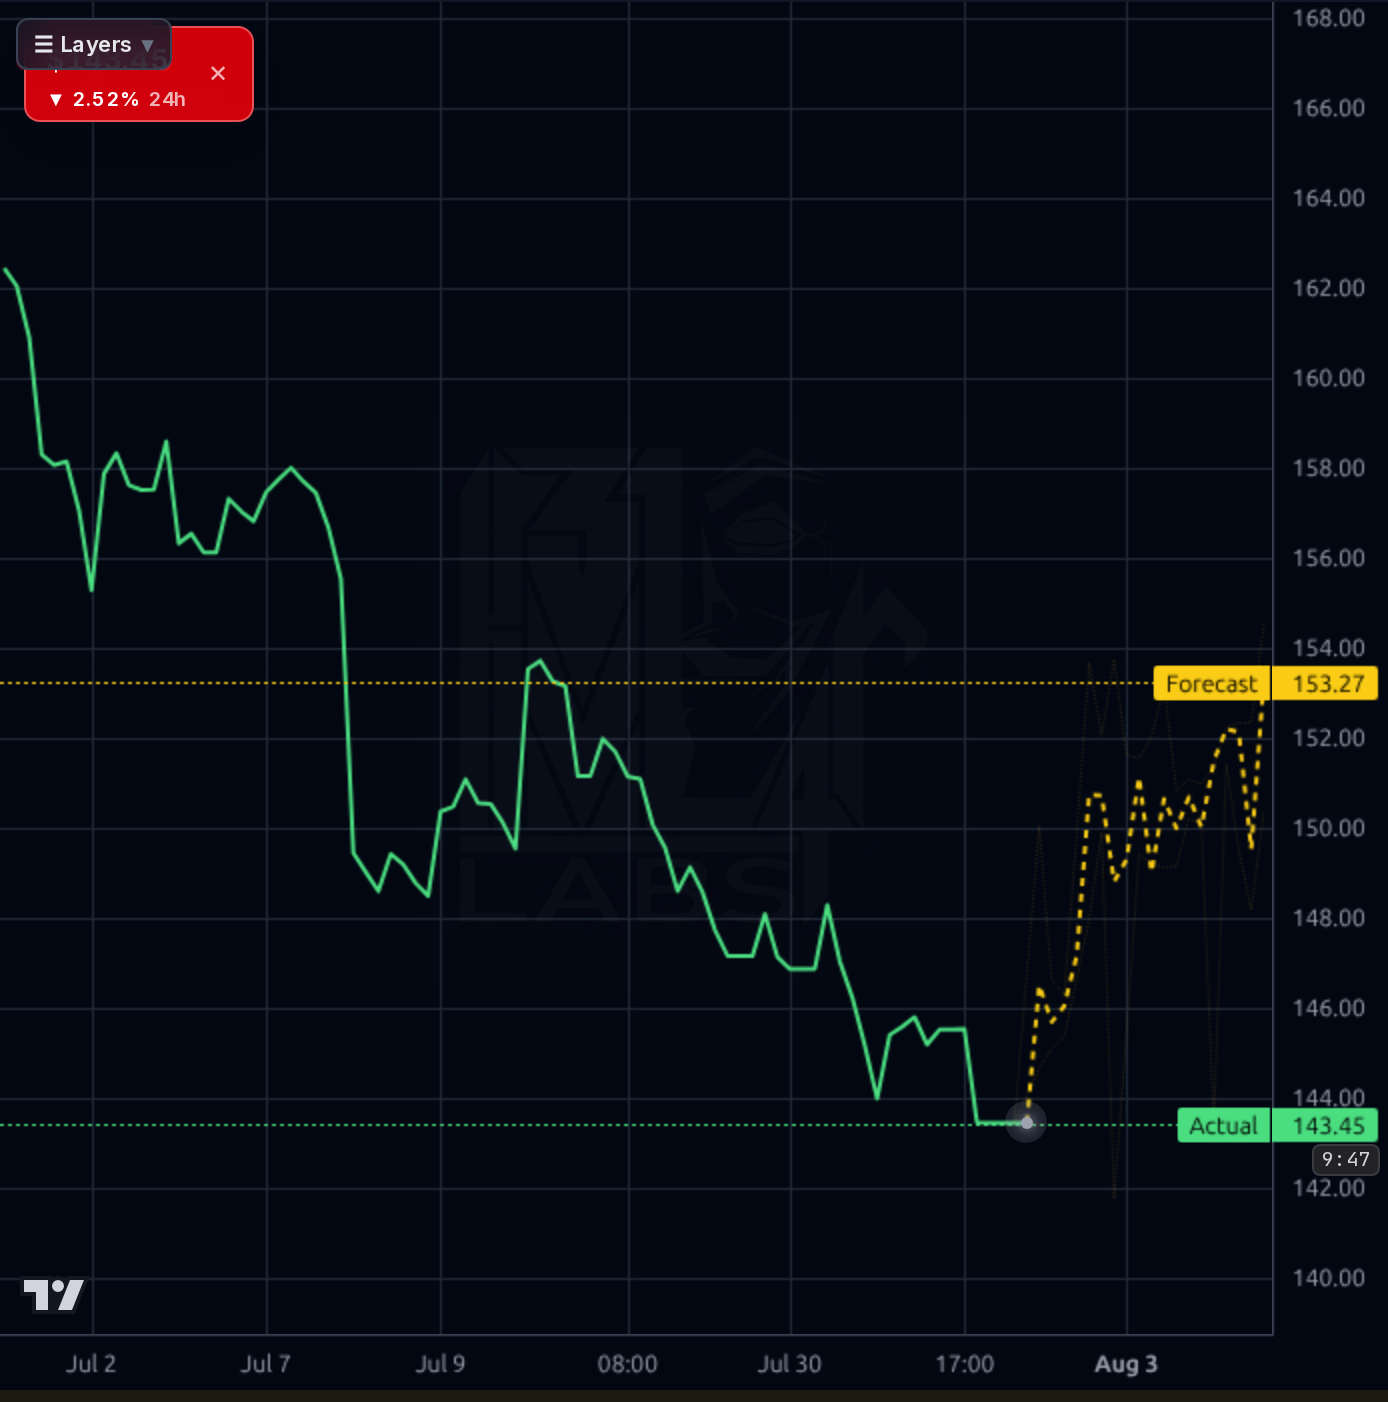
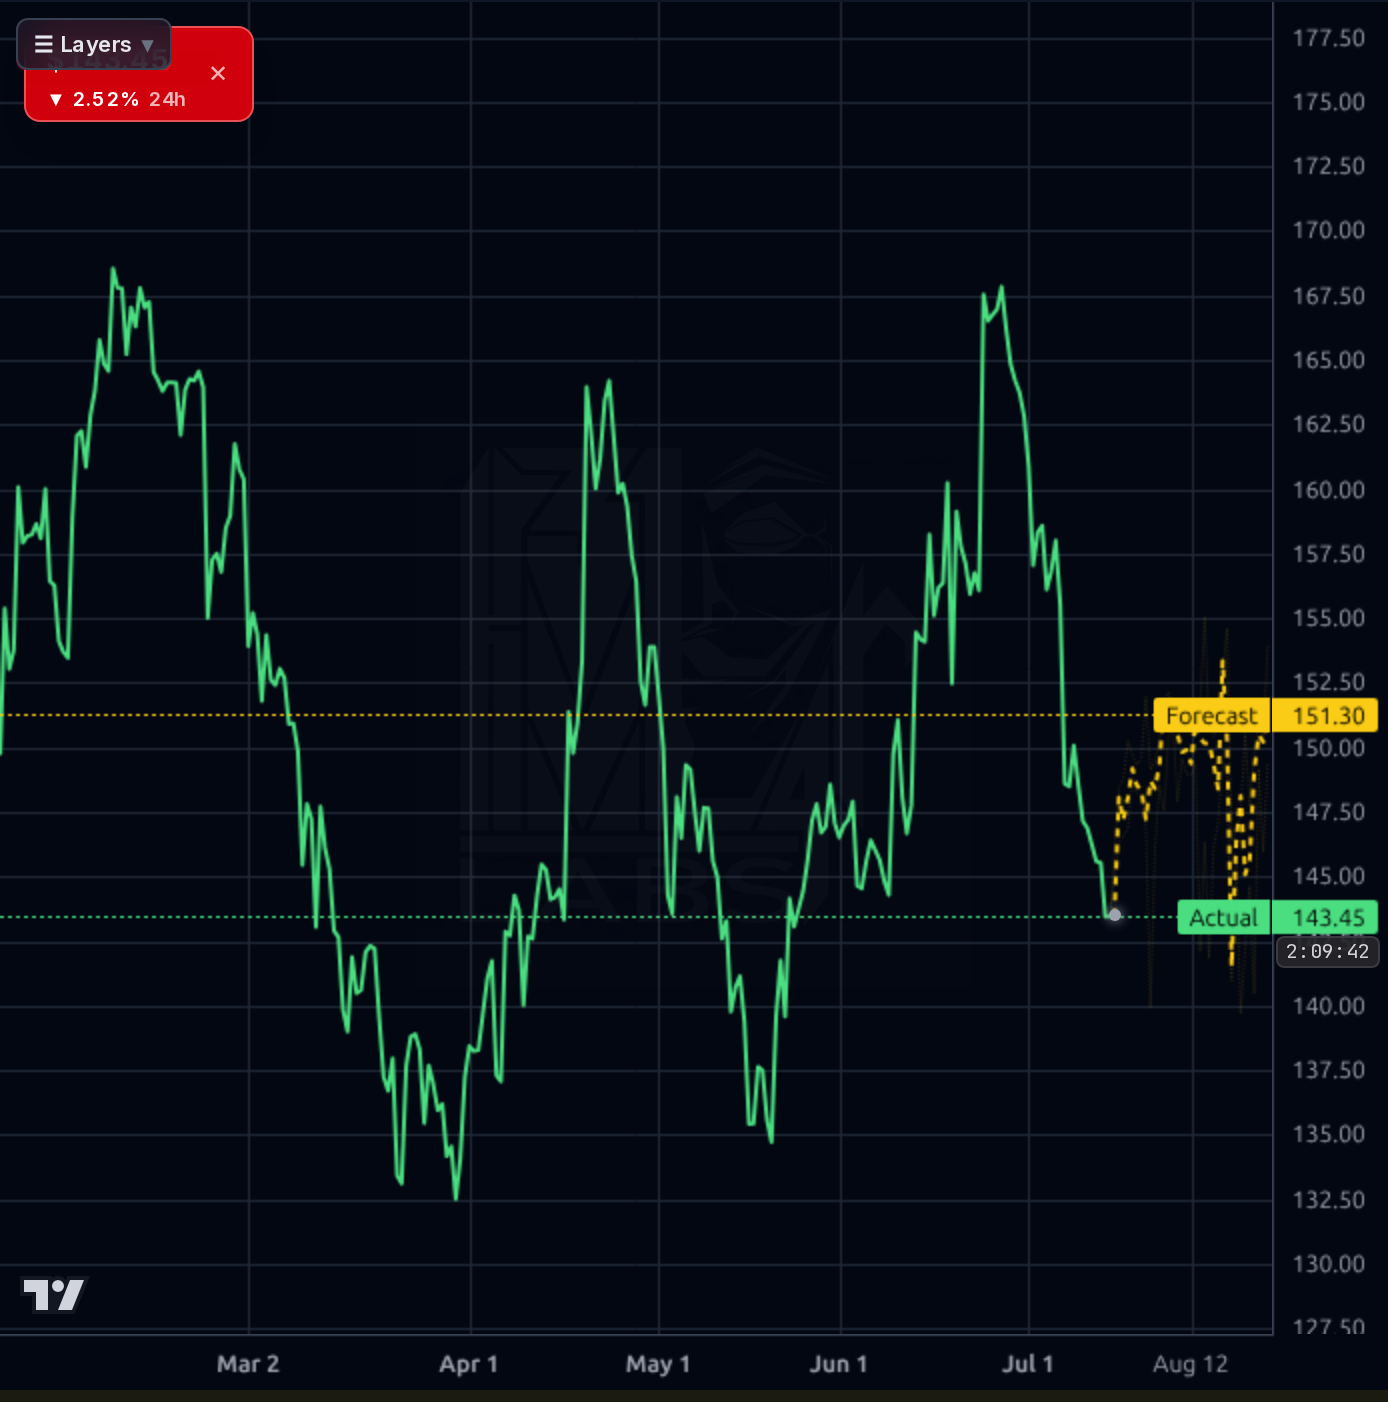
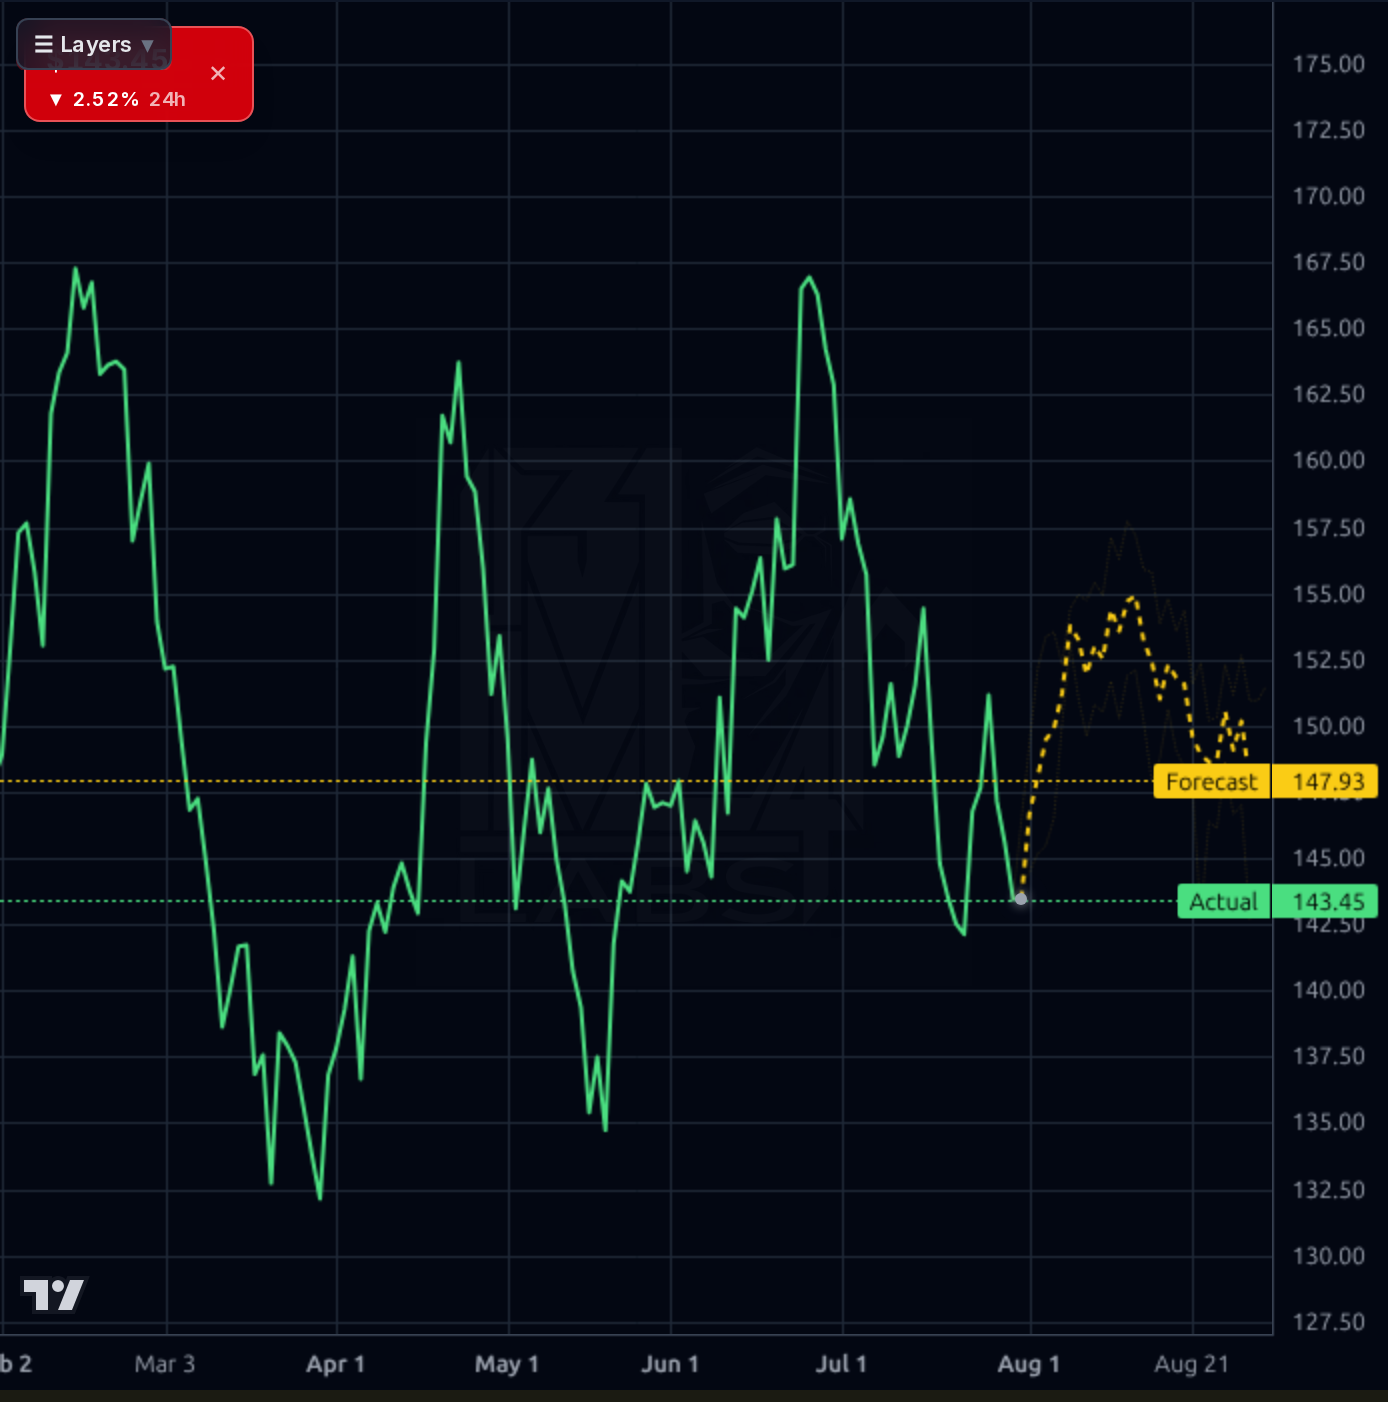
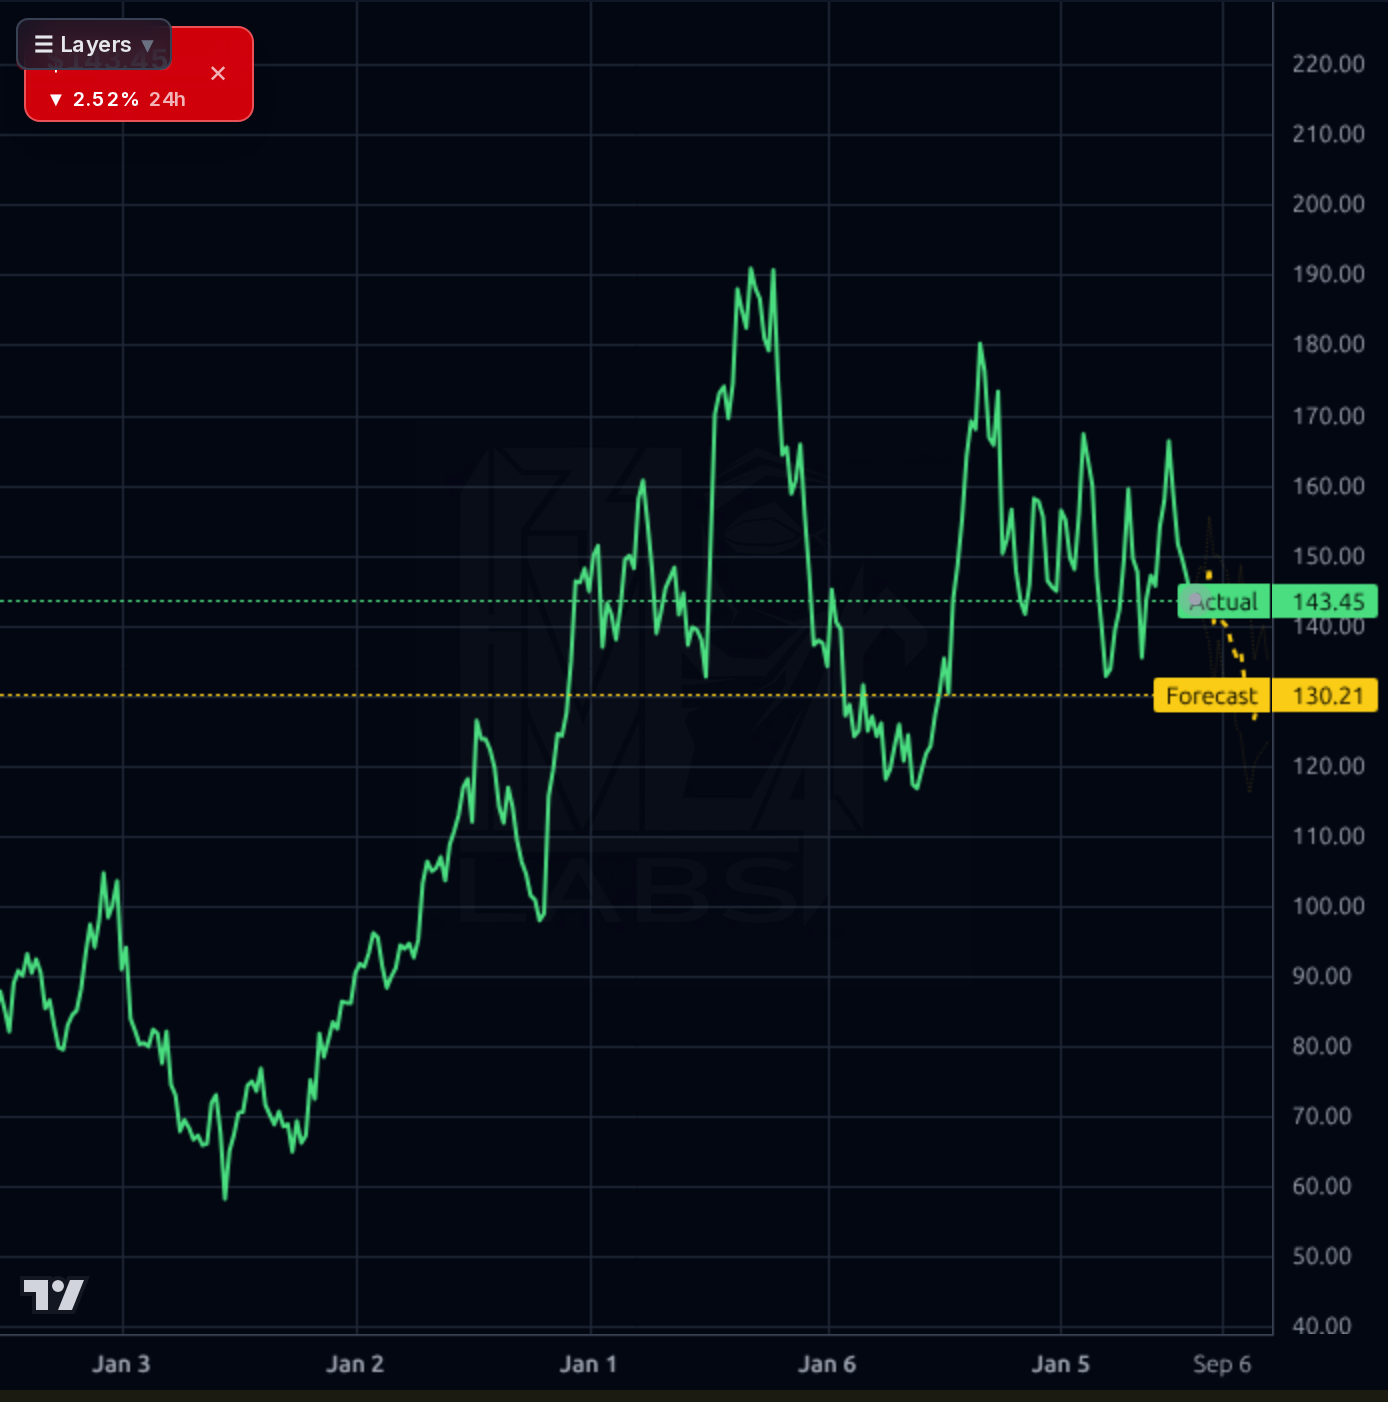
Hold near $145.53; invalidation below $142.93 (forecast low) would trigger trimming. Target short-term upside of +2% to $148.00 if the 20-day SMA holds above $143.00.
Accumulate on dips with a target range of $150-$165 over 6 months, driven by Q4 earnings and potential rate normalization. Catalysts include dividend growth and buyback activity; invalidation is below $140.00.
Long-term thesis hinges on housing market recovery and DHI's strong balance sheet. Terminal value could reach $180-$200 if the company captures market share in a rebound, but secular risks like affordability pressures and interest rate sensitivity remain significant risks.
Revenue has stabilized at $9.2B (Q2 2026) with gross margins holding at 22.6% despite a 11.86% 30-day price drop. Operating cash flow is robust ($4.3B in Q2), and the company maintains strong balance sheet metrics including a current ratio of 10.45 and debt-to-equity of 0.30. However, declining quarterly revenue (from $9.23B to $6.89B) and compressed margins reflect cyclical slowdowns. The dividend yield of 1.22% is attractive but vulnerable to rate hikes. Capital allocation remains sound with buybacks and dividends supporting shareholder value.
The chart shows a downtrend from the 52-week high ($184.55) with recent price action at $145.53, below the 20-day SMA (-2.53%) and 50-day SMA (-3.46%). Support is near $142.93 (forecast low), while resistance lies at $147.93 (forecast high). The Kronos AI forecast band suggests volatility with a 1d target of $146.33 and 1wk drift toward $142.93, indicating short-term pressure. RSI at 43.81 shows neutral momentum but the 24h drop (-2.52%) signals near-term selling pressure.
Recent news highlights DHI's contrarian potential: a buyback program and dividend affirmation (July 25) suggest confidence, while NewEdge Wealth's 68.4% position reduction (July 29) indicates institutional caution. The housing market remains 'pretty good' per PulteGroup CEO but affordability pressures persist. DHI trades at a discount to its 52-week high with strong fundamentals, though elevated mortgage rates and cyclical slowdowns are key risks.
- Dividend growth with 1.22% yield supported by buybacks and earnings stability
- Elevated mortgage rates compressing demand and margins
- Cyclical slowdown in housing market reducing sales volume
- Affordability pressures limiting first-time buyer entry
Get AI analysis on any stock
This is one of hundreds of Kronos AI reports — scored fundamentals & technicals, bull/base/bear price targets, a multi-horizon plan, and continuously-updated forecasts across the market. Create a free account to explore them all.
Create your free account →Already a member? Sign in · Join our Discord