DOX — AI Stock Forecast & Price Targets
Published 8/7/2026 · A free sample of K3vl4r’s AI-powered analysis.
Kronos price forecasts, scored fundamentals & technicals, and a multi-horizon plan.
View the live DOX price forecast →
Amdocs just cleared its binary Q3 FY26 earnings catalyst with in-line non-GAAP results ($1.84 EPS, $1.175B revenue) but LOWERED FY26 GAAP EPS guidance from $5.66-5.81 to $4.80-4.90, yet the stock is ripping +6.93% today on relief/short-cover dynamics (9.29% short float, RSI 64.7). At 7.4x forward P/E, ~3.85% yield, and $84.67 sell-side target, deep-value optionality remains intact — but the guide-down on GAAP earnings is a yellow flag that argues for measured accumulation on dips rather than chasing strength.
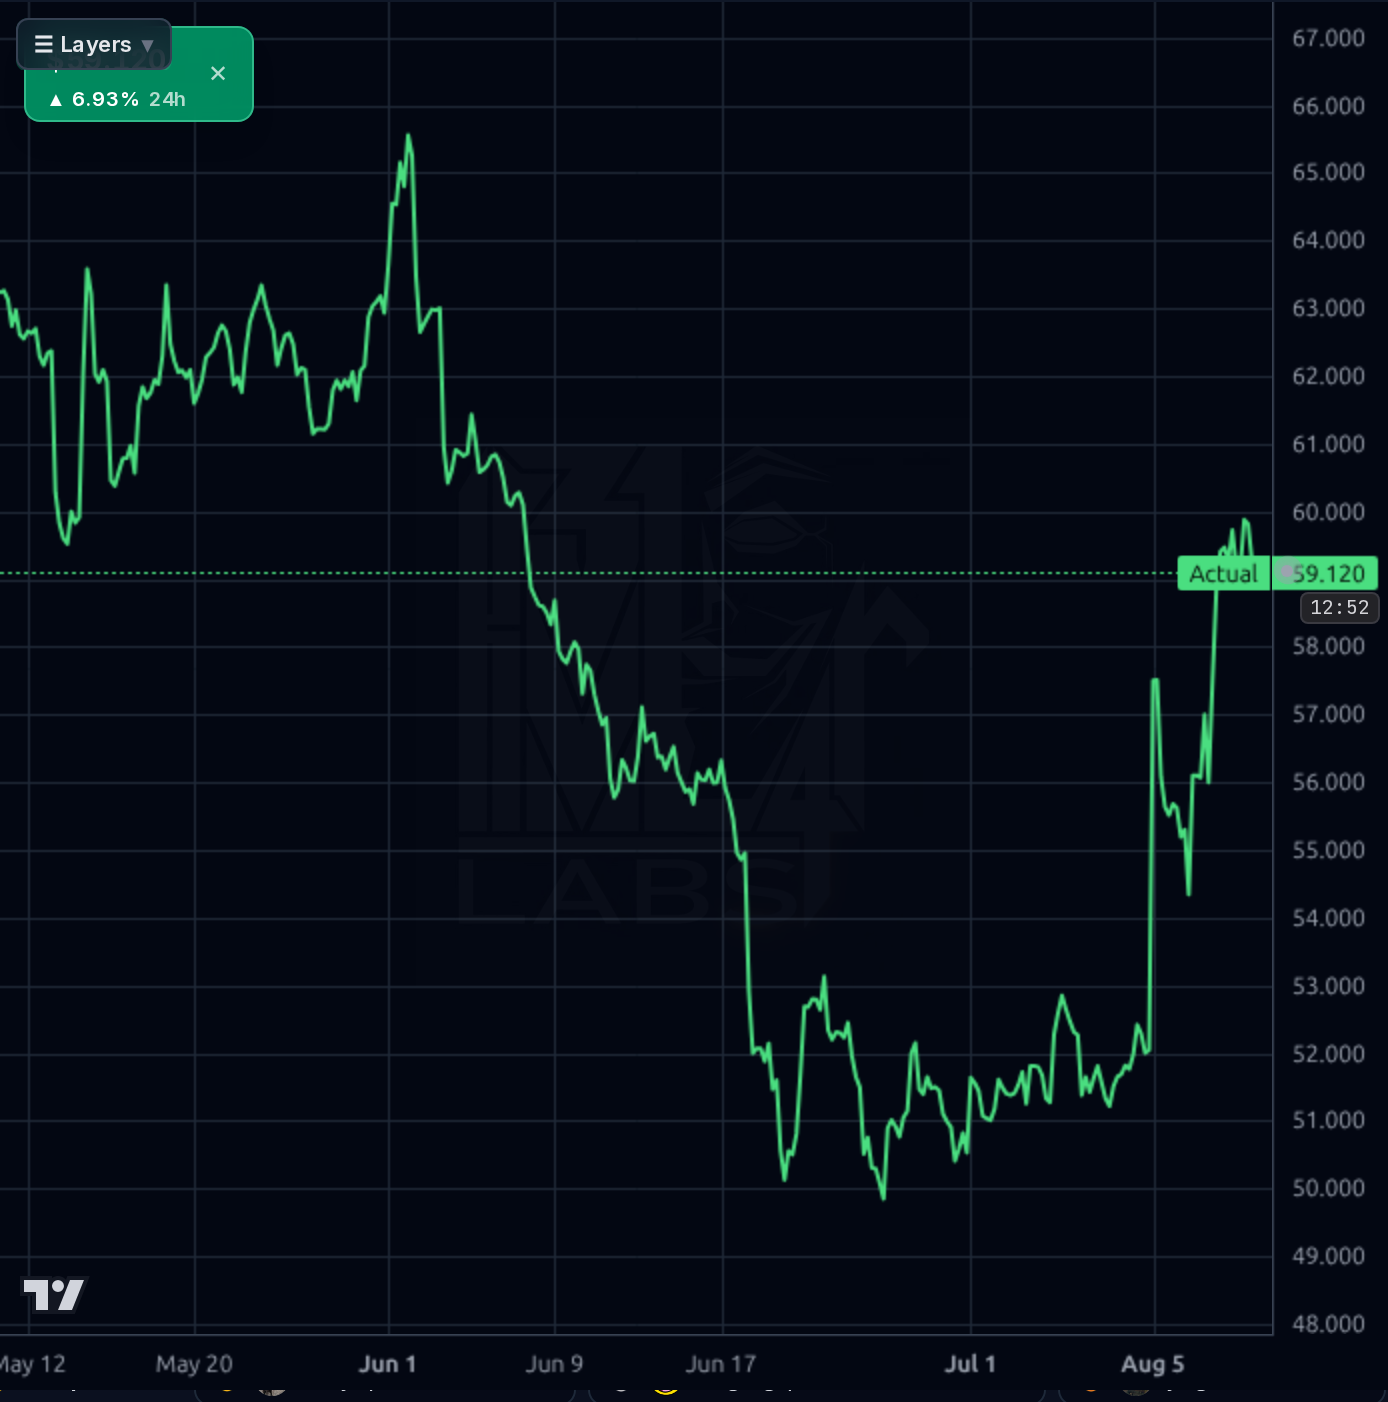
The stock is +6.93% today with RSI 64.7 and 9.29% short float — a short-covering component is in play. Do NOT chase into $60-62 resistance. Preferred tactic: wait for a pullback to $56-57 (breakout retest) to add. Invalidation of the near-term bounce is a close back below $54.50. Trim/take partial profits into $62-64 if reached quickly. Position sizing: modest given lingering GAAP guidance concerns.
Over 1-6 months, the thesis is that with the binary catalyst behind us, the stock can grind back toward the $62-68 zone as multiple compression reverses, supported by 7.4x fwd P/E and a well-covered ~3.85% yield. Expected return range: 5-15% base case, with buybacks and dividend adding ~2%. Catalysts: Q4 FY26 print, FY27 guidance framework, any large CES25/GenAI mandate wins. Change of mind: another sequential OCF decline, further GAAP EPS cuts, or loss of a top-5 telecom customer.
Multi-year, DOX is a mature BSS/OSS incumbent with sticky telecom relationships and durable FCF (~$690M TTM) generating shareholder yield via buybacks + dividend. Terminal thesis: high-single-digit total return from ~3.8% yield + ~2-4% revenue growth + modest multiple re-rating from today's depressed 7.4x fwd P/E toward 10-11x. The biggest structural risk is hyperscaler verticalization (AWS/Azure/GCP building telco-native stacks) compressing traditional telco BSS spend, plus persistent FX headwinds masking already-modest organic growth (+2.2% cc).
Q3 FY26 results printed roughly in-line: revenue $1.175B (+2.7% reported, +2.2% cc), non-GAAP EPS $1.84 (matched midpoint). Sequential revenue continued a modest upward slope ($1.144B → $1.150B → $1.156B → $1.172B → ~$1.175B). Margins are stable: TTM gross ~38%, operating ~17-18%, net ~11.6%. However, two concerns: (1) FY26 GAAP EPS guidance was cut materially from $5.66-5.81 to $4.80-4.90, implying restructuring/one-time charges or amortization pressure; (2) working capital swung negative in the March quarter (-$30M) and OCF remains lumpy (Q2FY26 $101M vs prior $220-241M run-rate) — Q3 cash flow disclosure will be critical. That said, TTM FCF ~$690M, dividend covered at 40.8% payout, debt/equity 0.32, EV/EBITDA 7.2x, forward P/E 7.4x, PEG 0.77 — the valuation absorbs a lot of bad news. ROE 15.6%, ROIC 12.9%. Capital allocation continues to favor buybacks and a growing dividend (3/5Y dividend growth ~10%).
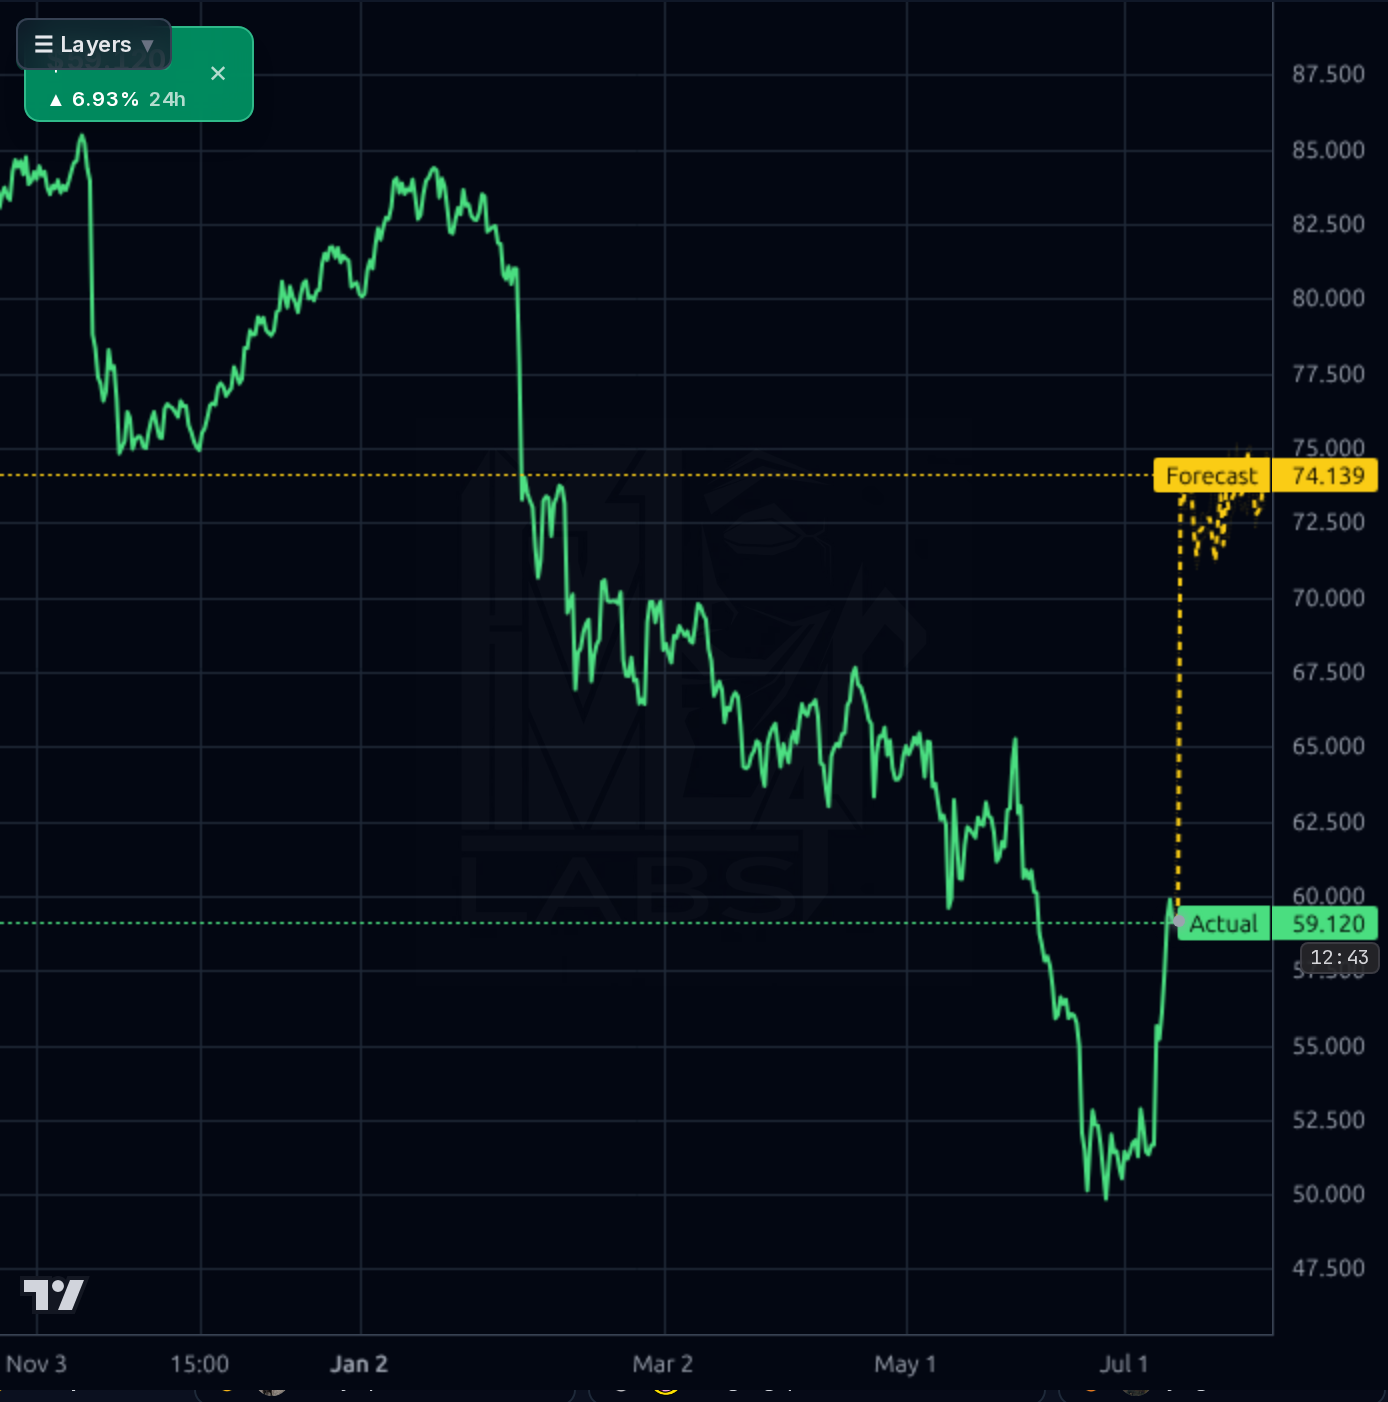
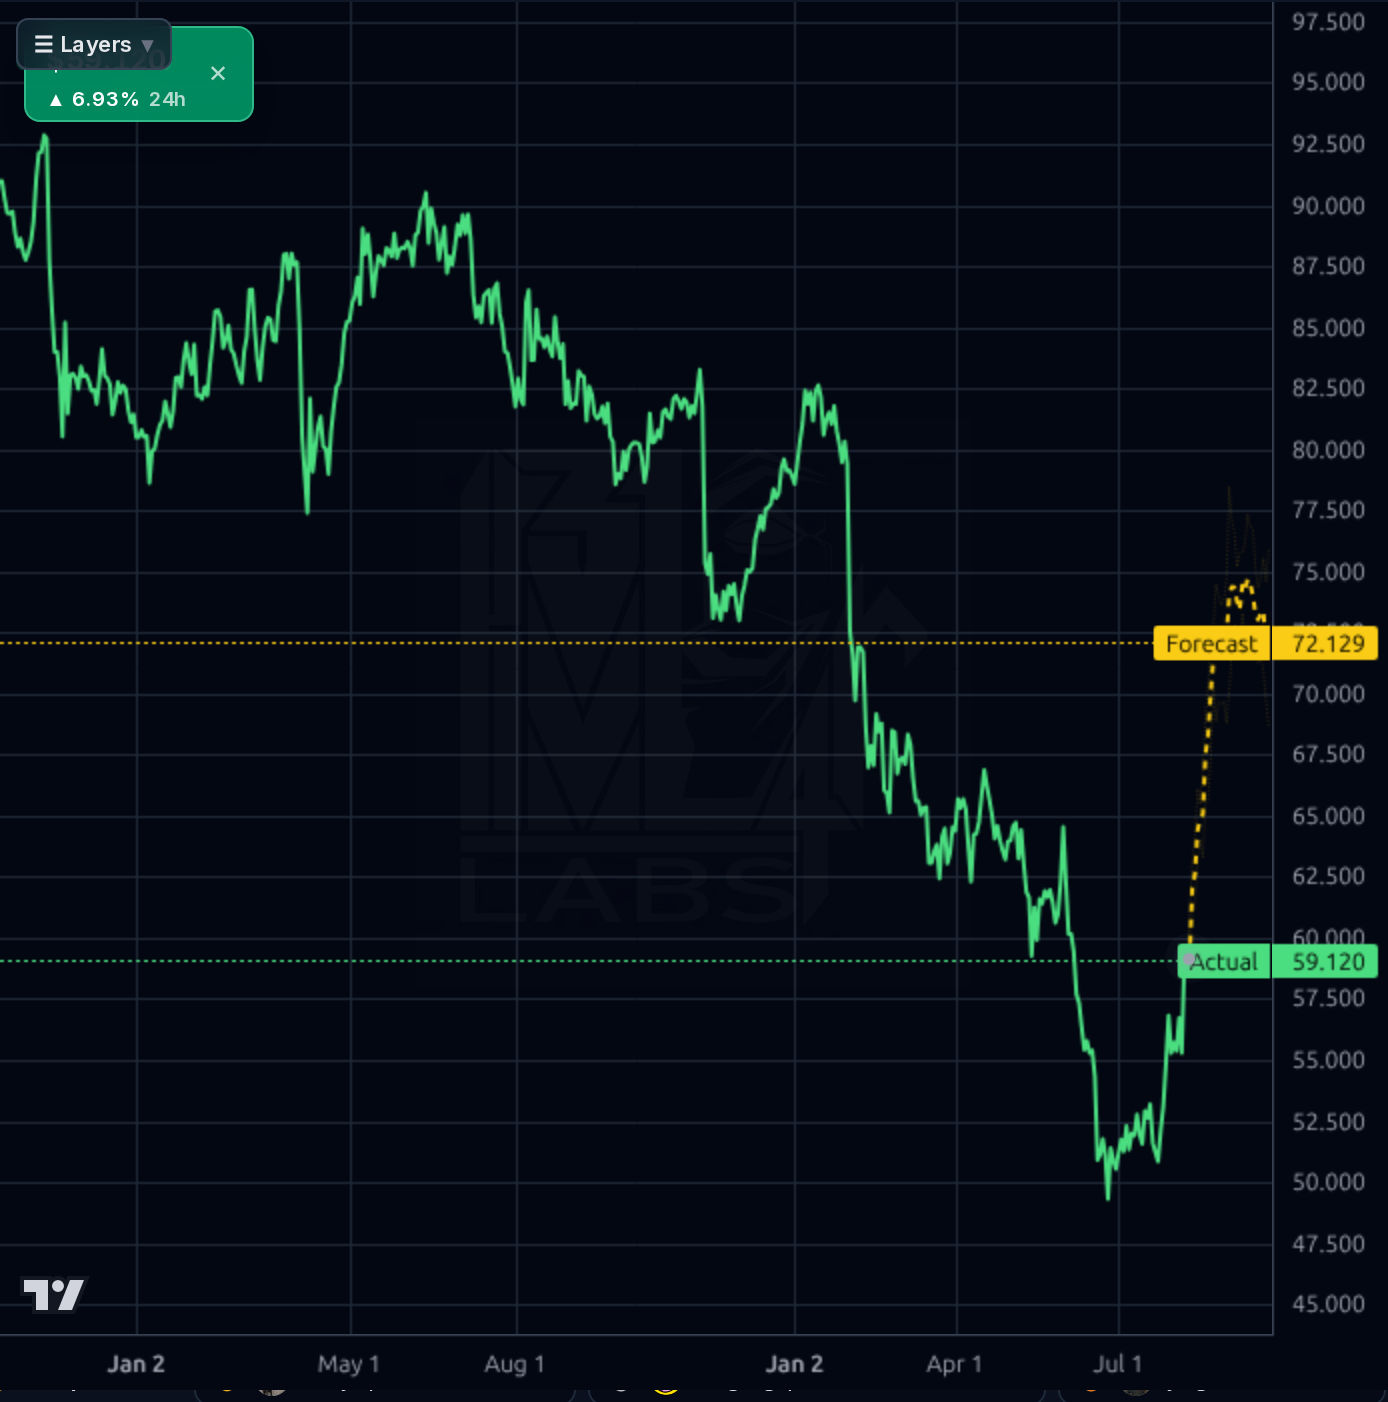
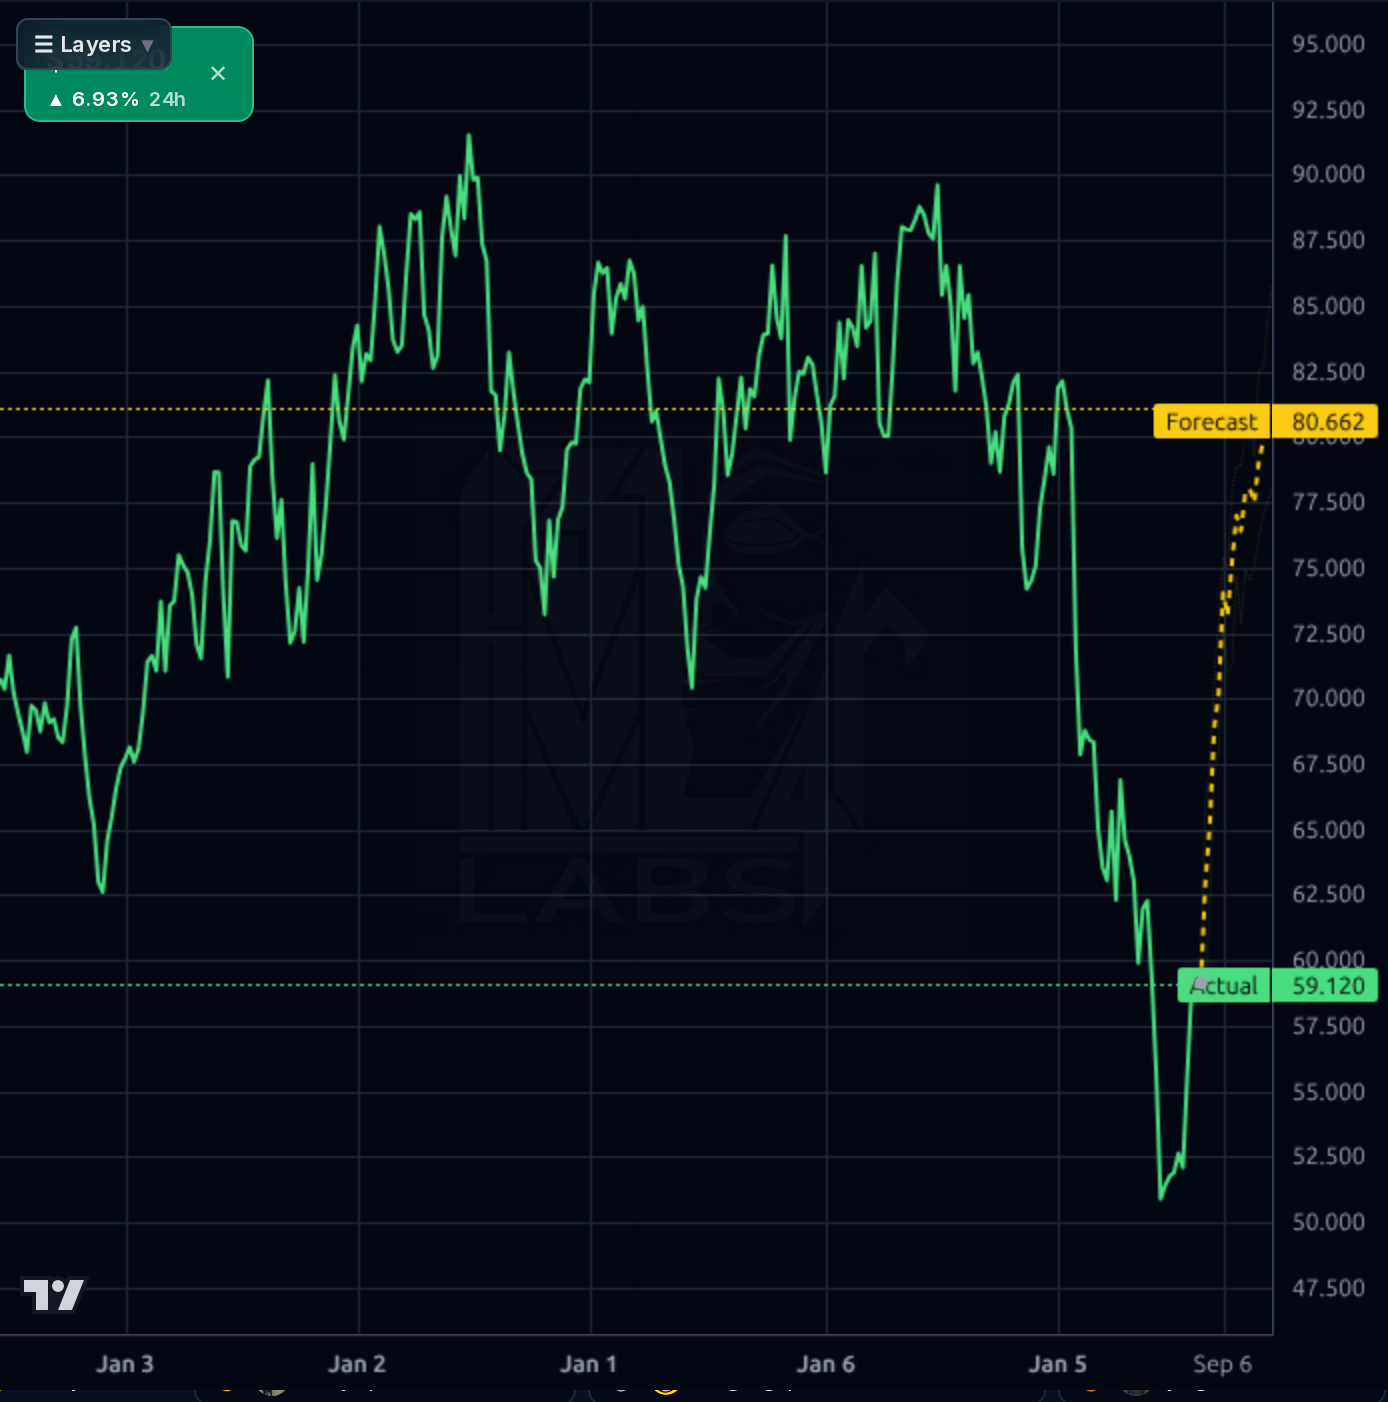
The daily/weekly charts show a multi-quarter downtrend from the $90 high to a $49.74 washout low, with price now mean-reverting sharply off support. Live at $59.12 with today +6.93%, above SMA20 (+10%) and SMA50 (+7.7%) but still -13.9% below SMA200 and -34.5% off the 52w high. RSI 64.7 signals momentum without being extremely overbought. Immediate resistance is $60-62 (prior consolidation shelf and psych round-number), then $65-67 (Jun 1 swing high on the 1h chart), then the SMA200/gap-fill zone near $68-70. Support: $57.5 (breakout retest), $55-56, then $52 and the $49.74 low. The model forecasts diverge: 1h flat at ~$59, but 4h/1d/1wk project $72-80 — those bull bands have systematically failed to print for this name and should be discounted. Reliability data confirms directional accuracy roughly matches the naive baseline, so treat forecasts as low-conviction.
The dominant news is the Aug 5 Q3 print: non-GAAP results in-line, revenue slight miss (-0.04%), and — importantly — a downward revision to FY26 GAAP EPS guidance ($5.66-5.81 → $4.80-4.90). Despite the GAAP guide-down, the stock is rallying, indicating the buy-side was braced for worse (the print resolved the binary catalyst that had capped shares). Simply Wall St flags the name as undervalued after the 35.7% one-year drop. Sister company Liberty Latin America reported broadly stable telco spending, a modest positive for Amdocs' end-market. Retail sentiment on Stocktwits is 100% bullish among tagged messages — a mild contrarian yellow flag but low sample.
- CES25 GenAI-embedded customer experience suite adoption — repeat mandates would validate recurring high-margin revenue streams
- Amdocs eSIM Cloud capturing the structural shift from physical to digital SIM provisioning at carriers
- MarketONE SaaS platform expanding TAM into adjacent media, gaming, security verticals beyond core telco
- $690M TTM FCF funding continued buybacks (float already reduced) and ~10% dividend growth CAGR
- Managed services + AI/RPA-driven operational offerings extending stickiness with hyperscaler-partner deals
- FY26 GAAP EPS guidance cut from $5.66-5.81 to $4.80-4.90 signals underlying charges/amortization pressure not captured in non-GAAP framing
- Sequential OCF volatility ($241M → $220M → $101M) and negative working capital raise cash-conversion questions
- Hyperscaler (AWS/Azure/GCP) verticalization into telco stacks structurally pressures long-term BSS/OSS pricing power
- Currency tailwind masking weak organic growth — reported +2.7% Y/Y vs constant-currency +2.2% Y/Y in Q3
- Customer concentration in a small group of Tier-1 carriers whose capex cycles remain soft
- Overhead from $84.67 sell-side target (+43% from live) that has systematically failed to print, indicating persistent analyst overoptimism
- 9.29% short float means a squeeze can extend the rally, but also that positioning could reverse violently on any disappointment
Get AI analysis on any stock
This is one of hundreds of Kronos AI reports — scored fundamentals & technicals, bull/base/bear price targets, a multi-horizon plan, and continuously-updated forecasts across the market. Create a free account to explore them all.
Create your free account →Already a member? Sign in · Join our Discord