DOX — AI Stock Forecast & Price Targets
Published 7/29/2026 · A free sample of K3vl4r’s AI-powered analysis.
Kronos price forecasts, scored fundamentals & technicals, and a multi-horizon plan.
View the live DOX price forecast →
Amdocs trades at ~6.6x forward P/E with a 4.3% dividend yield after a ~39% drawdown from 52-week highs, offering deep-value optionality anchored by strong FCF. The August 5 earnings print is a binary catalyst: sequential OCF deterioration (241M → 220M → 101M over three quarters) and negative working capital must reverse to validate the base. Technicals show early basing near $55 with reclaim of $56 needed to confirm; forecast model signals bullish across timeframes but with unreliable magnitudes.
HOLD into the August 5 earnings print — do NOT add size ahead of a binary event with 9.3% short float and elevated IV. Current $54.87 sits mid-range between $52.50 support and $56/$60 resistance. If earnings deliver OCF reversal AND stable guidance, expect a gap toward $60-62 fill. If they miss on cash flow or guide cautiously, expect a retest of $49.74 with break-risk to $46. Invalidation: close below $52 pre-earnings signals leakage. Existing positions: hold single-sized; do not stack.
1-6 month view assumes OCF stabilizes and the print does not fundamentally break the thesis. In that scenario, a re-rating toward $60-64 (7.5-8x fwd P/E) is achievable as the market prices in dividend durability plus modest SaaS mix contribution. Expected return range +5% to +18% base case. Catalysts: OCF normalization, SaaS/managed services quantified traction, further transformation wins. What would change my mind: a second consecutive quarter of OCF decline, dividend coverage strain, or evidence of accelerating hyperscaler wins in core BSS accounts.
1-3 year terminal thesis: DOX remains the entrenched BSS/OSS incumbent for tier-1 telcos, with CES25/connectX SaaS transition slowly shifting revenue mix toward recurring. If the SaaS transition succeeds, the multiple can rerate to 10-12x fwd P/E (~$85-100) with dividend compounding at ~10% annually. Terminal downside is a 20-30% revenue erosion over 5 years as hyperscalers verticalize telecom software — the biggest structural risk. Base case: mid-single-digit total return CAGR (dividend + modest multiple expansion + flat-to-low-growth topline). Bull case requires management to demonstrably win on GenAI-native telecom platforms.
Amdocs is a cash-generative telecom software vendor with structurally sound but decelerating fundamentals. TTM revenue is $4.62B with -2.7% Y/Y growth, though the most recent quarter showed sequential improvement (+3.9% Q/Q to $1.17B). Gross margin held at 38.8% and operating margin at 16.5%, with net margin near 11.8%. The concerning signal is operational cash flow deterioration: OCF fell from $241M (Jun-25) to $220M (Dec-25) to just $102M (Mar-26), with FCF collapsing to $80M in the latest quarter and working capital swinging negative to -$30M. Cash dropped from $325M to $214M while total debt rose from $826M to $1.07B — the balance sheet is deteriorating on the margin though still manageable at 0.32 D/E. Capital allocation remains disciplined: 40.8% payout ratio funds a 4% dividend with 10%+ 3/5Y dividend growth history. ROE 15.6%, ROIC 12.9%. At 6.6x fwd P/E, 8.7x P/FCF, and 6.8x EV/EBITDA versus a Software-Infrastructure peer group, the multiple discounts real execution risk but is defensible if OCF normalizes.
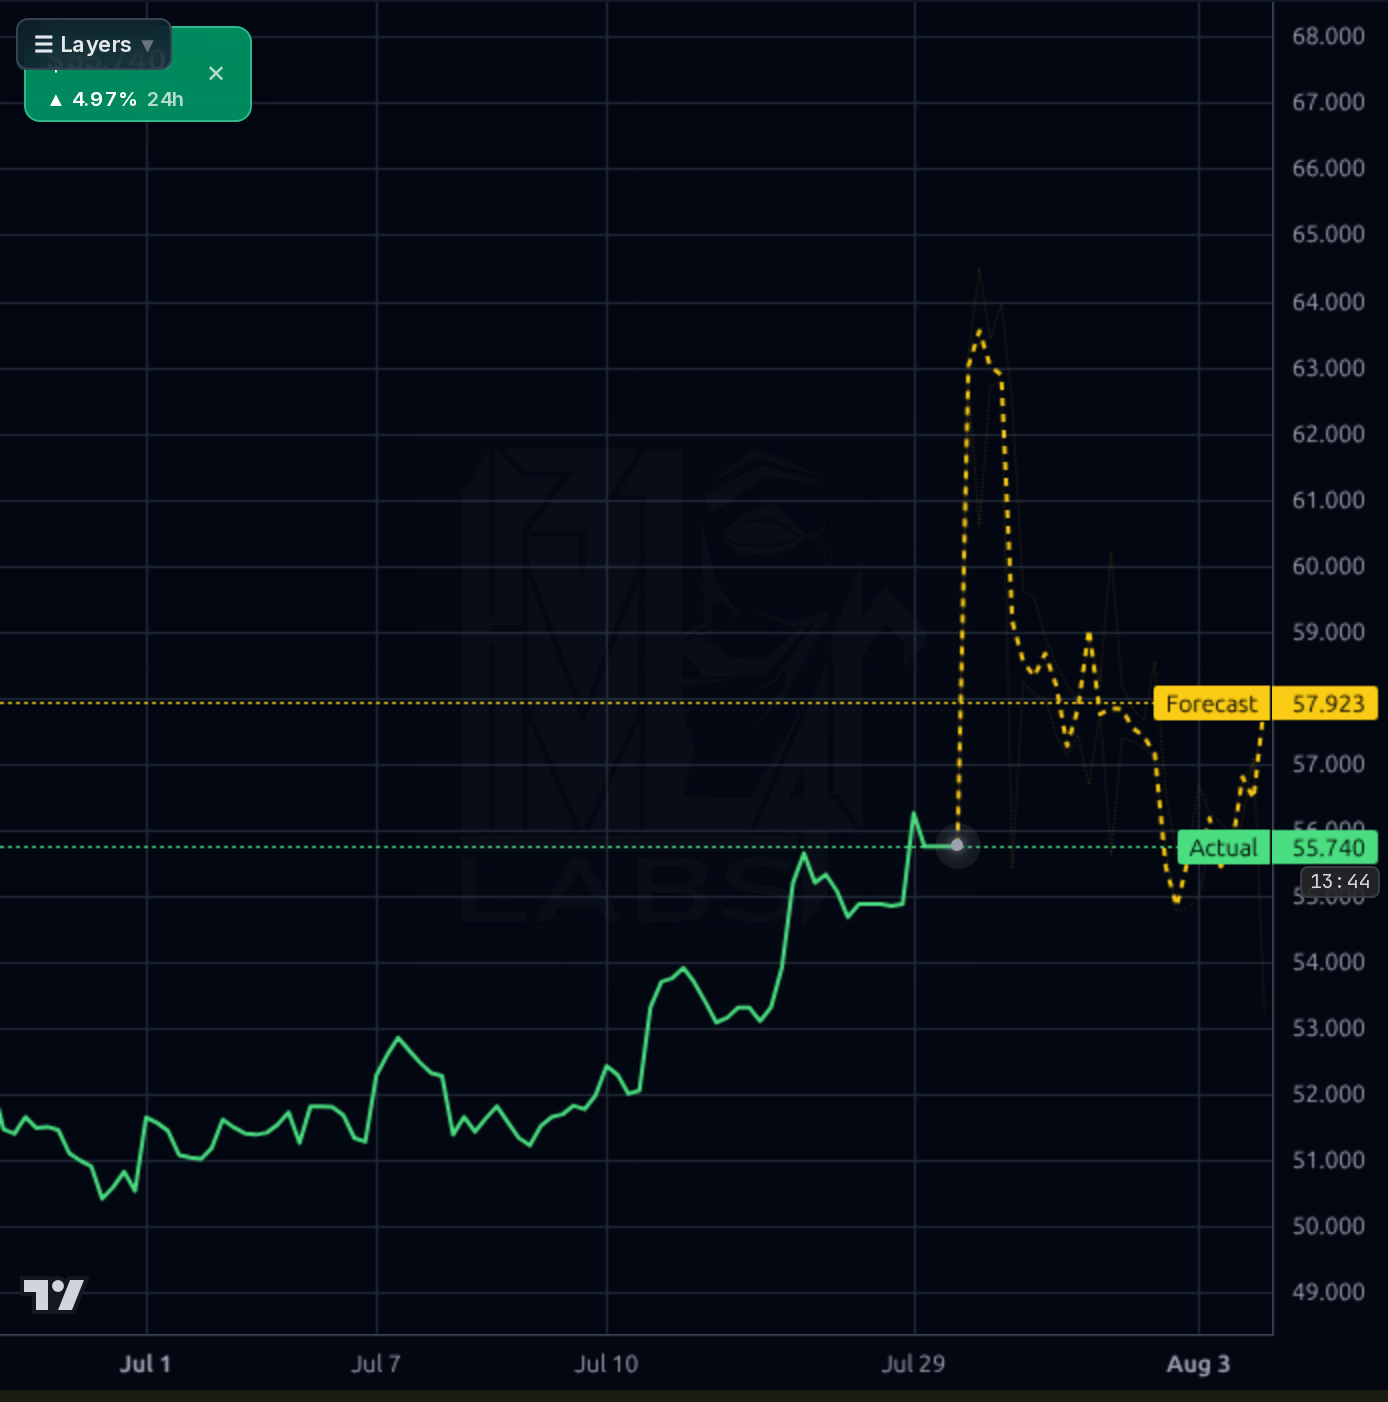
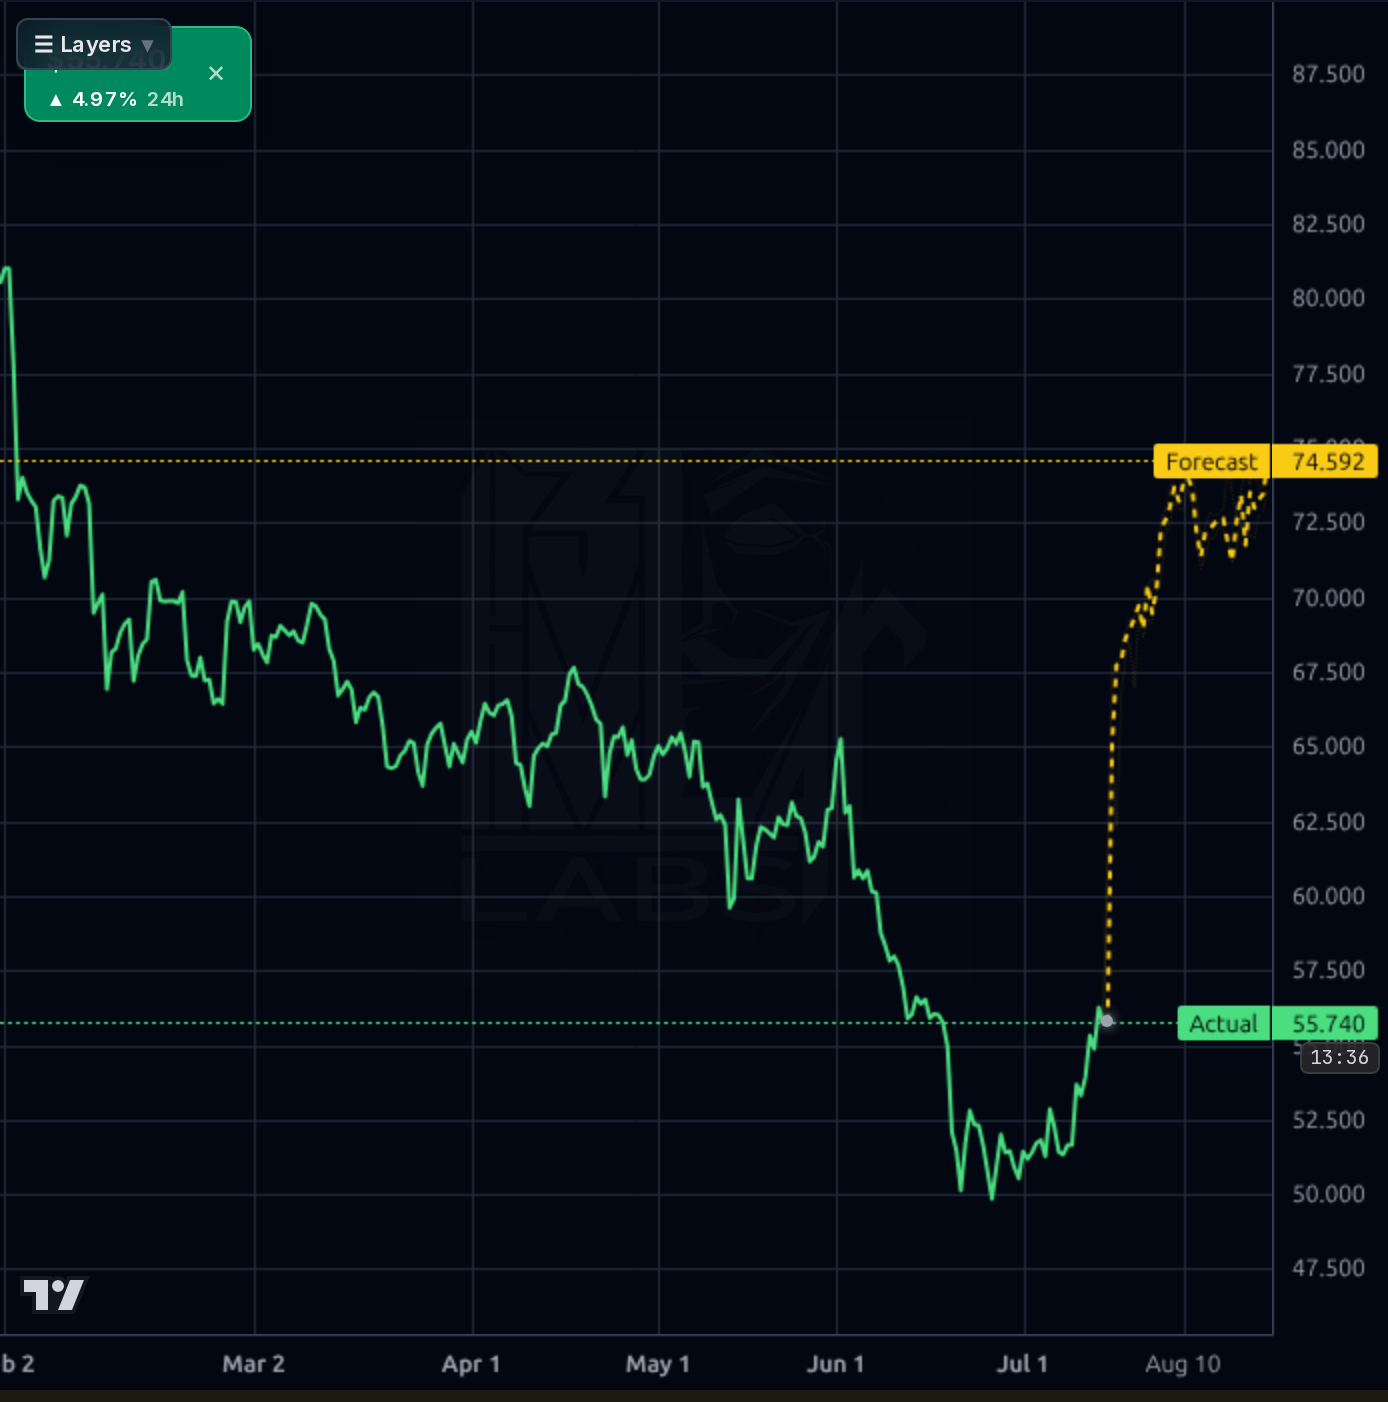
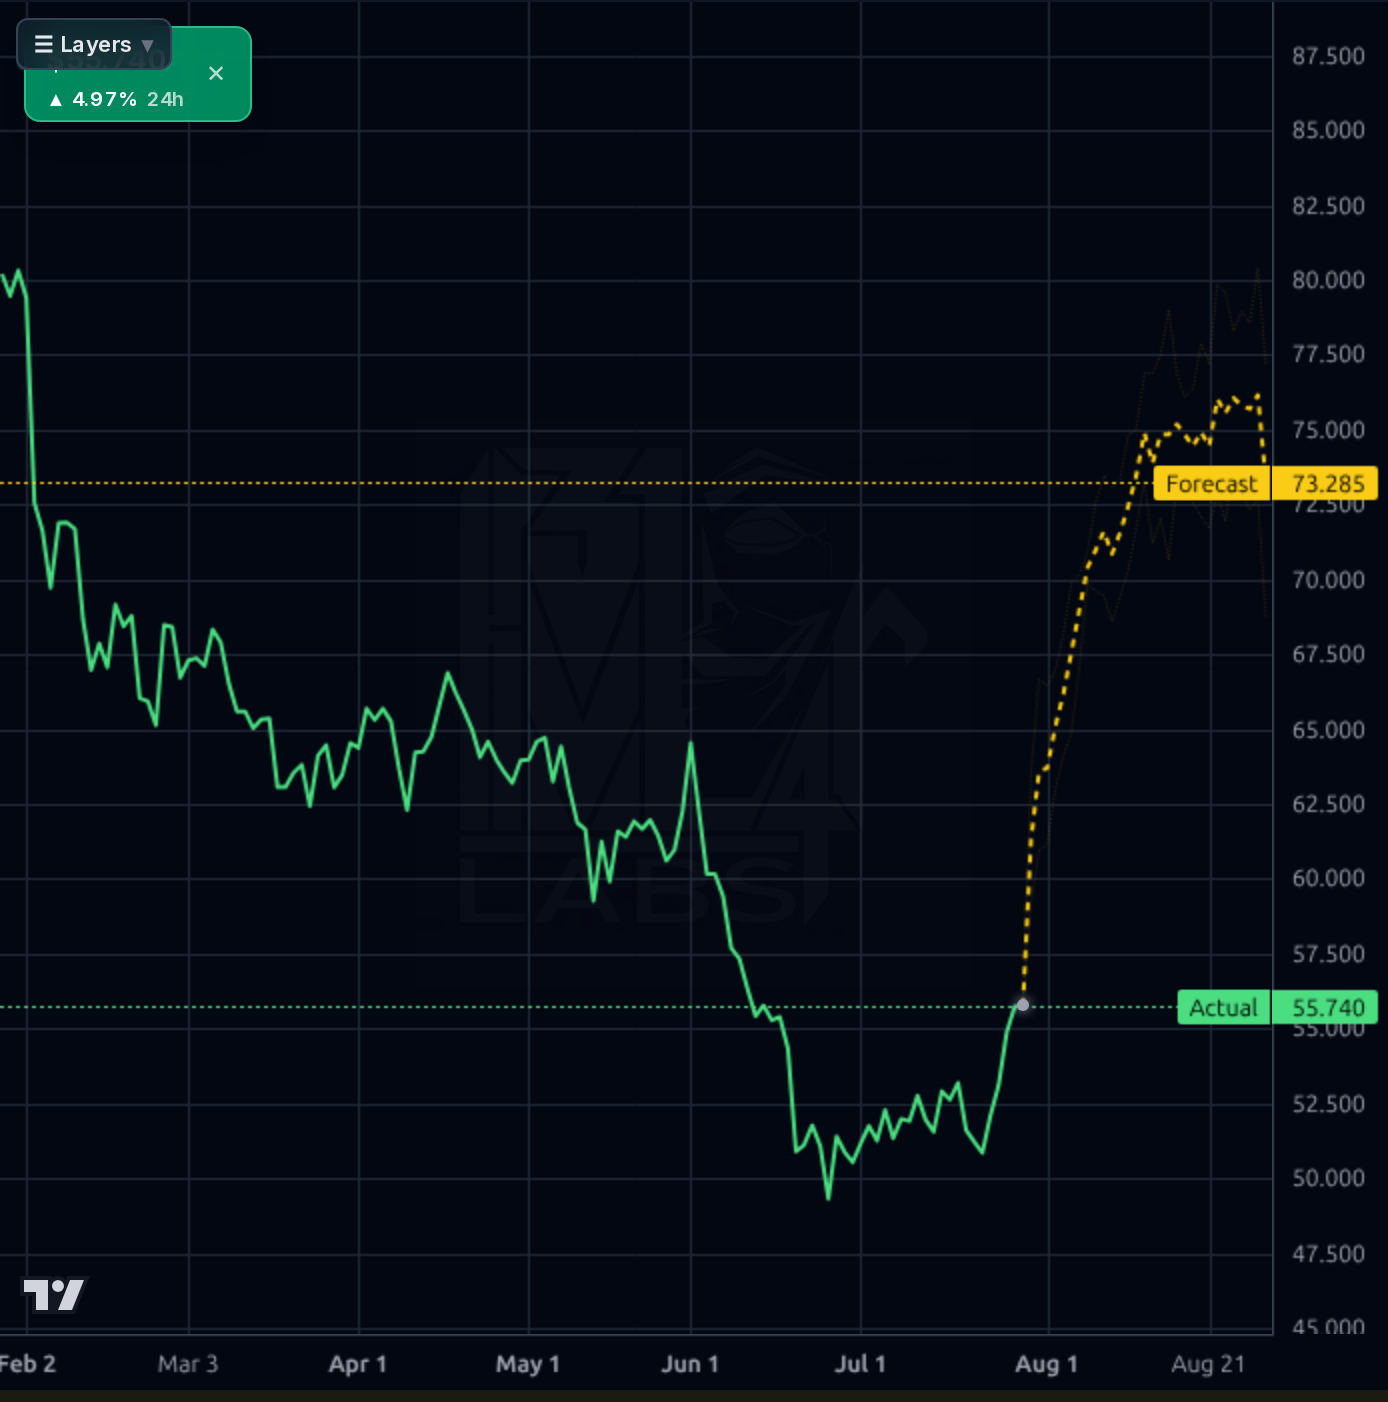
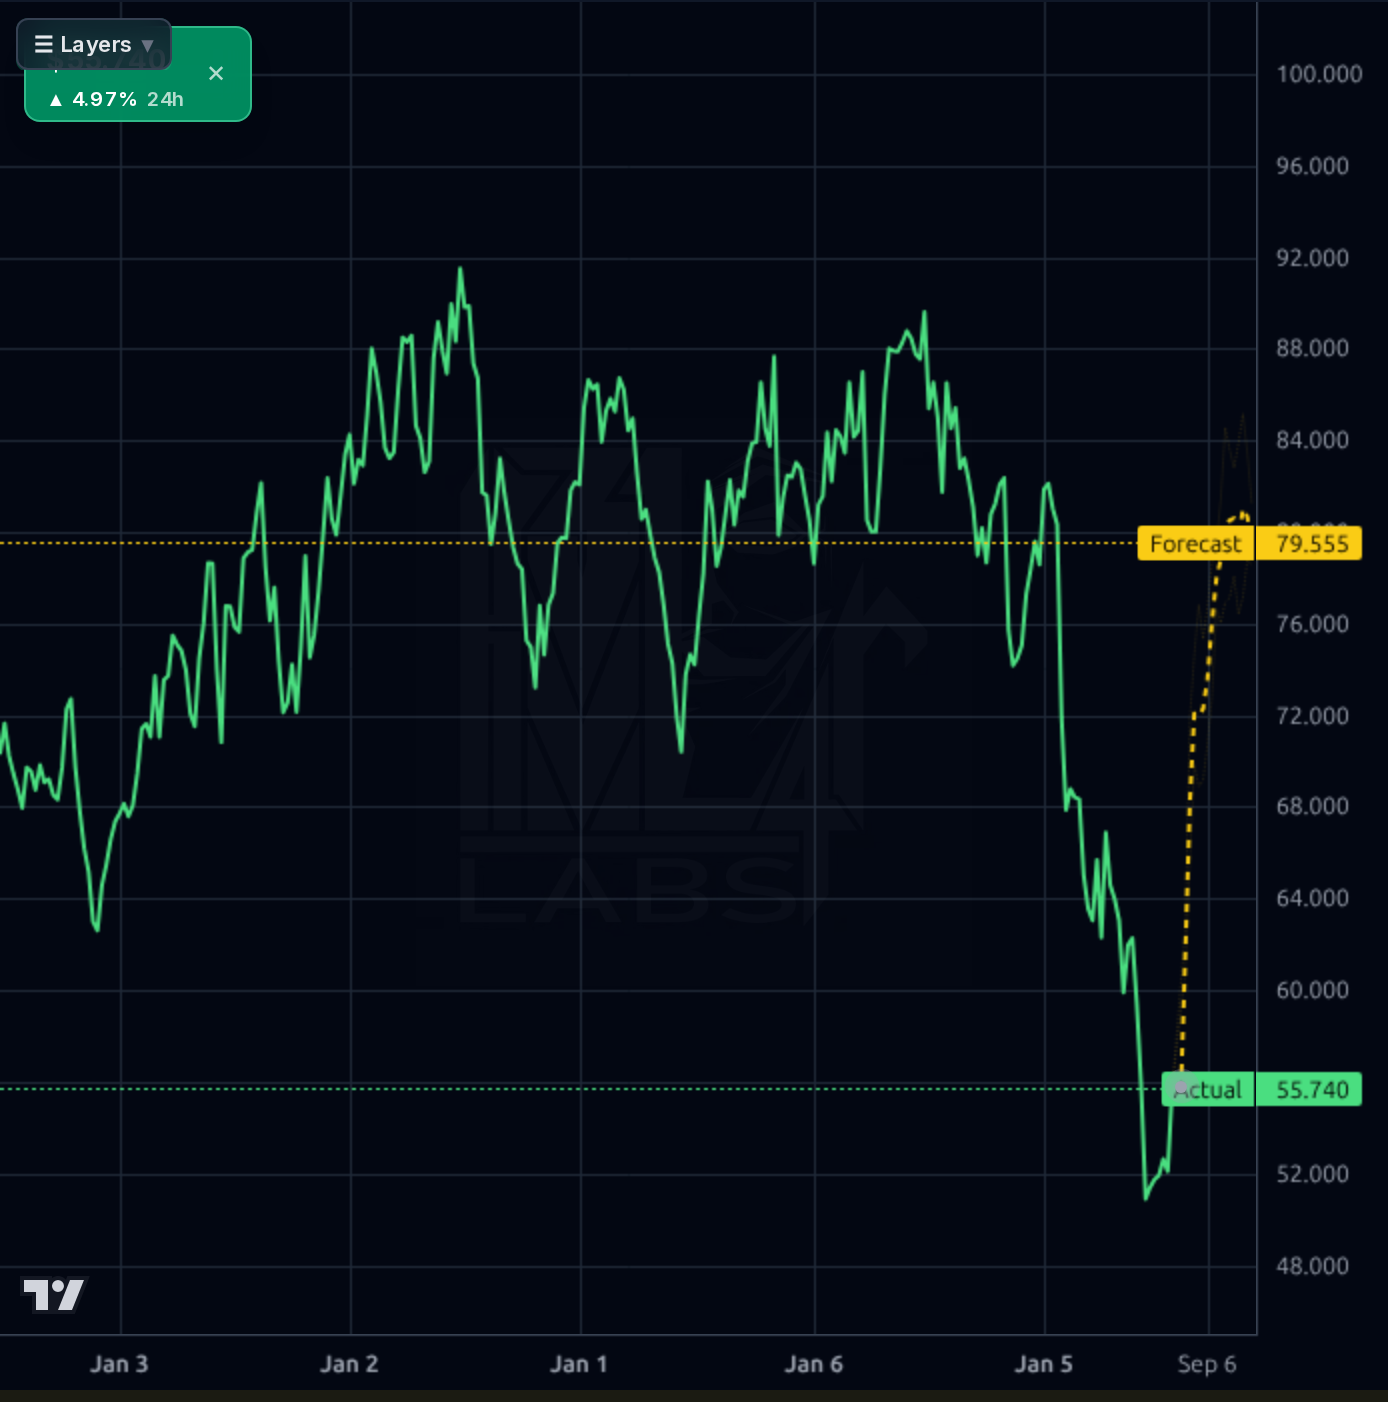
Across timeframes the setup is a washout-into-basing pattern. The weekly chart shows a broken uptrend with price down from $92 highs to a $50-52 capitulation low, now $54.87 with a 6.3% weekly gain and RSI 56.9 — improving but not overbought. Daily shows a clear V-recovery off $49.74 with price now +10.3% off the 52-week low but still -39.2% off the high; SMA20 is +5.4% (bullish), SMA50 -1.5% (neutral), SMA200 -21.1% (bearish overhead pressure). The 1h chart shows a clean stair-step higher from $51 to $55.74, with immediate resistance at $56 (prior swing) then the $57.92 forecast level. The model forecast bands are bullish across all timeframes (1d: $57.92, 4h: $74.59, 1wk: $79.56) but historical MAPE of 27% on 1d and the model matching (not beating) the naive baseline means directionally useful but magnitude-unreliable. Key levels: support $52.50 then critical $49.74; resistance $56 then $60-62 gap-fill zone.
Recent coverage skews constructively but is dominated by valuation-focused commentary rather than fresh operational catalysts. Multiple outlets (ChartMill, Zacks, SeekingAlpha, GuruFocus) have flagged DOX as a single-digit P/E, 4%+ yield value play, and Zacks/GuruFocus specifically place it in value screens. Operationally, the Three Scandinavia digital transformation win (Sweden/Denmark) and KeyBanc initiating coverage at Sector Weight are the most substantive items — validating BSS/OSS relevance but not yet quantifying incremental revenue. The recent analyst rating downgrade (1.86 → 2.25) is a real signal of sell-side caution heading into the print, offsetting the June upgrade momentum. The AI-fear narrative in SeekingAlpha's 'shareholder yield monster' piece captures the core debate: is hyperscaler verticalization a structural threat, or is the AI RAN partnership angle a re-rating catalyst? Consensus price target of $84.67 implies ~54% upside but has been repeatedly wrong on this name.
- Three Scandinavia partnership for digital transformation across Sweden and Denmark — a marquee European transformation mandate validating platform relevance
- CES25 GenAI-led customer experience suite rollout, embedded with telecom-specific AI agents and CatalogONE cross-suite integration
- connectX cloud-native telco-in-a-box SaaS platform targeting digital telecom brands — key to shifting revenue toward recurring
- Amdocs eSIM Cloud and MarketONE monetization platforms tapping into new digital service revenue streams beyond core BSS
- KeyBanc initiation (Sector Weight) reintroducing sell-side attention that had thinned during the drawdown
- August 5 earnings is a binary event — a third consecutive OCF miss or weak FY guide could gap the stock below $49.74 support
- Sequential OCF collapse from $241M → $102M over three quarters is the most acute operational red flag, not yet explained
- 9.29% short interest and 7.18 short ratio create asymmetric downside pressure if the print disappoints
- Structural hyperscaler competition (AWS, Azure, GCP) verticalizing into telecom BSS/OSS is a multi-year moat risk
- Recent analyst downgrade (1.86 → 2.25) signals waning sell-side conviction into the catalyst
- Total debt rose from $826M to $1.07B in three quarters while cash fell — balance sheet drift needs monitoring
- TTM revenue -2.7% Y/Y confirms telecom capex cycle weakness has not yet inflected
- Forward P/E of 6.6x could compress further if FY26 EPS guide comes in below the $8.06 estimate
Get AI analysis on any stock
This is one of hundreds of Kronos AI reports — scored fundamentals & technicals, bull/base/bear price targets, a multi-horizon plan, and continuously-updated forecasts across the market. Create a free account to explore them all.
Create your free account →Already a member? Sign in · Join our Discord