EPAM — AI Stock Forecast & Price Targets
Published 7/23/2026 · A free sample of K3vl4r’s AI-powered analysis.
Kronos price forecasts, scored fundamentals & technicals, and a multi-horizon plan.
View the live EPAM price forecast →
EPAM is a deep-value IT services franchise trading at ~6.1x forward P/E with a fortress balance sheet ($1.04B cash, D/E 0.08), but the entire near-term setup is dominated by the August 6 earnings binary that must reverse Q1'26 margin compression (GM 27.7%) and -$36M OCF. Technicals show basing above $80 support with a mild positive tilt (RSI 47, +1.8% vs SMA20, +13.9% MTD), but 22.4% short float and a -58% YTD drawdown reflect deep skepticism about structural TAM erosion from AI-driven client insourcing. Recommendation: HOLD into the print — the setup is asymmetric but binary, and prior bull targets have systematically failed to print.
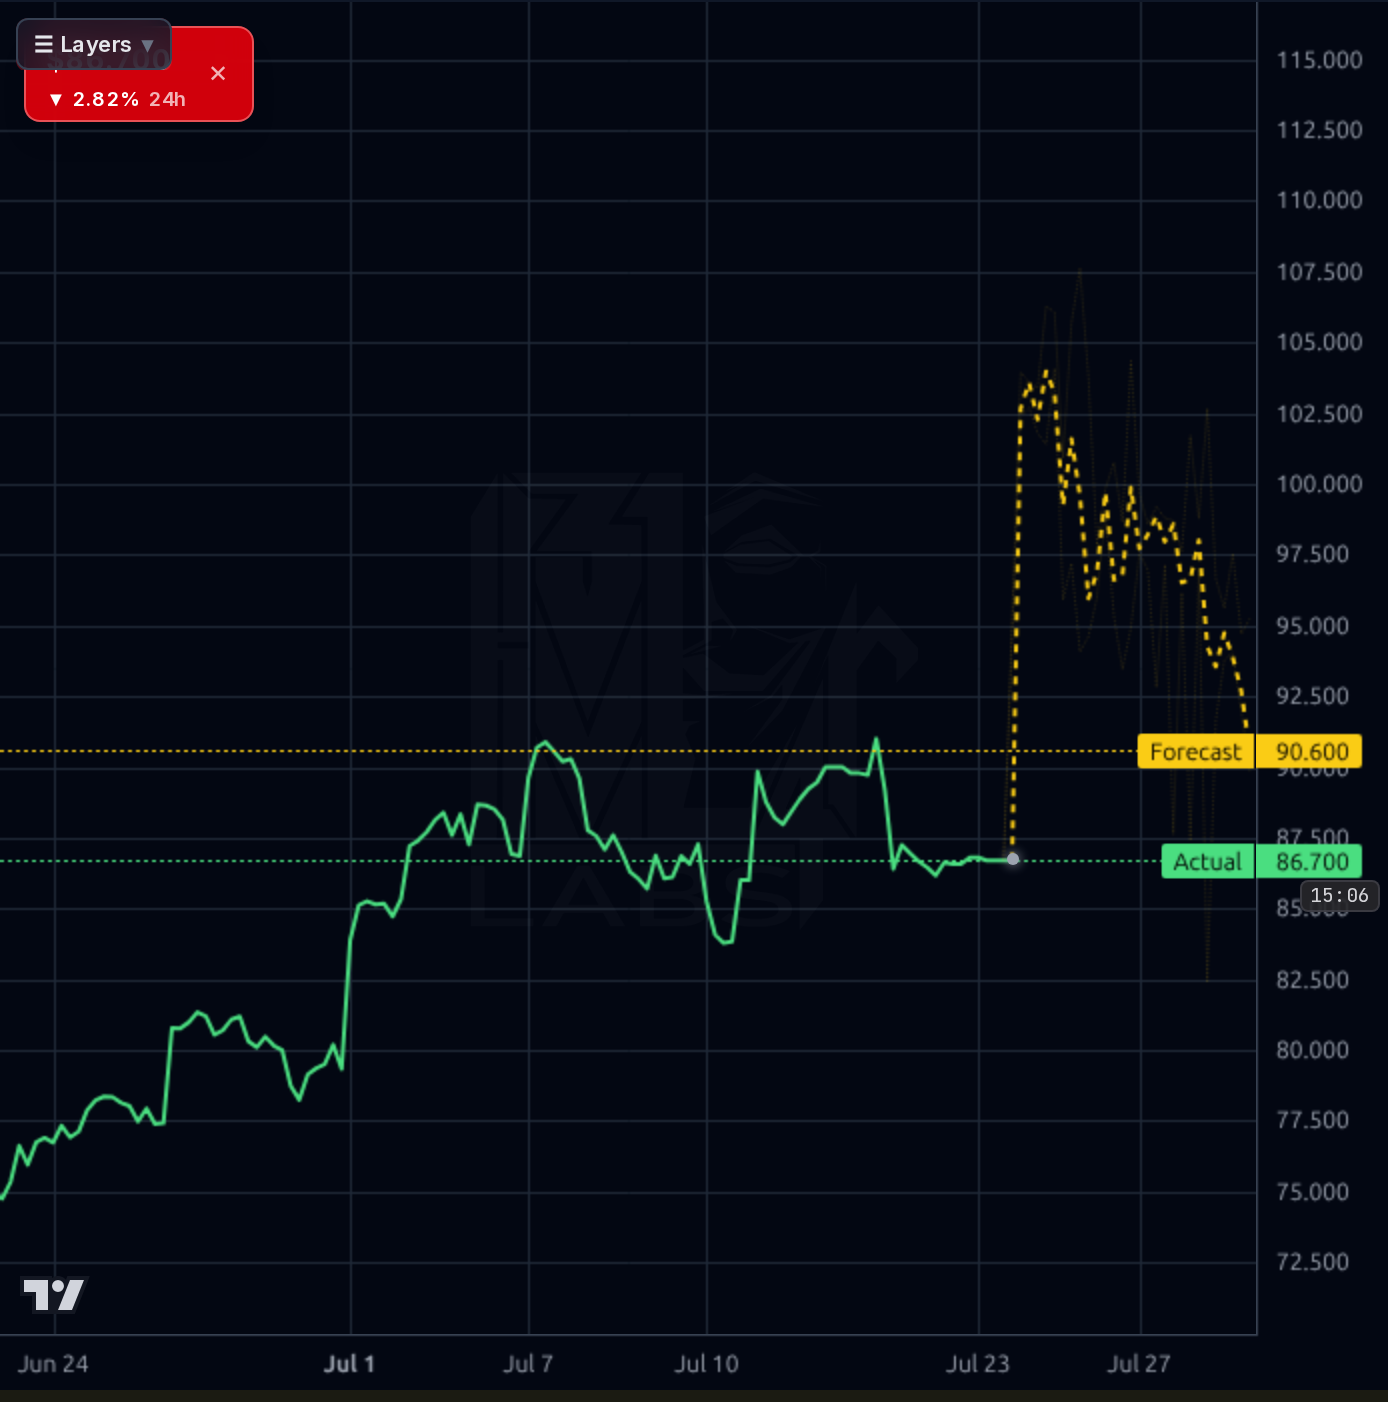
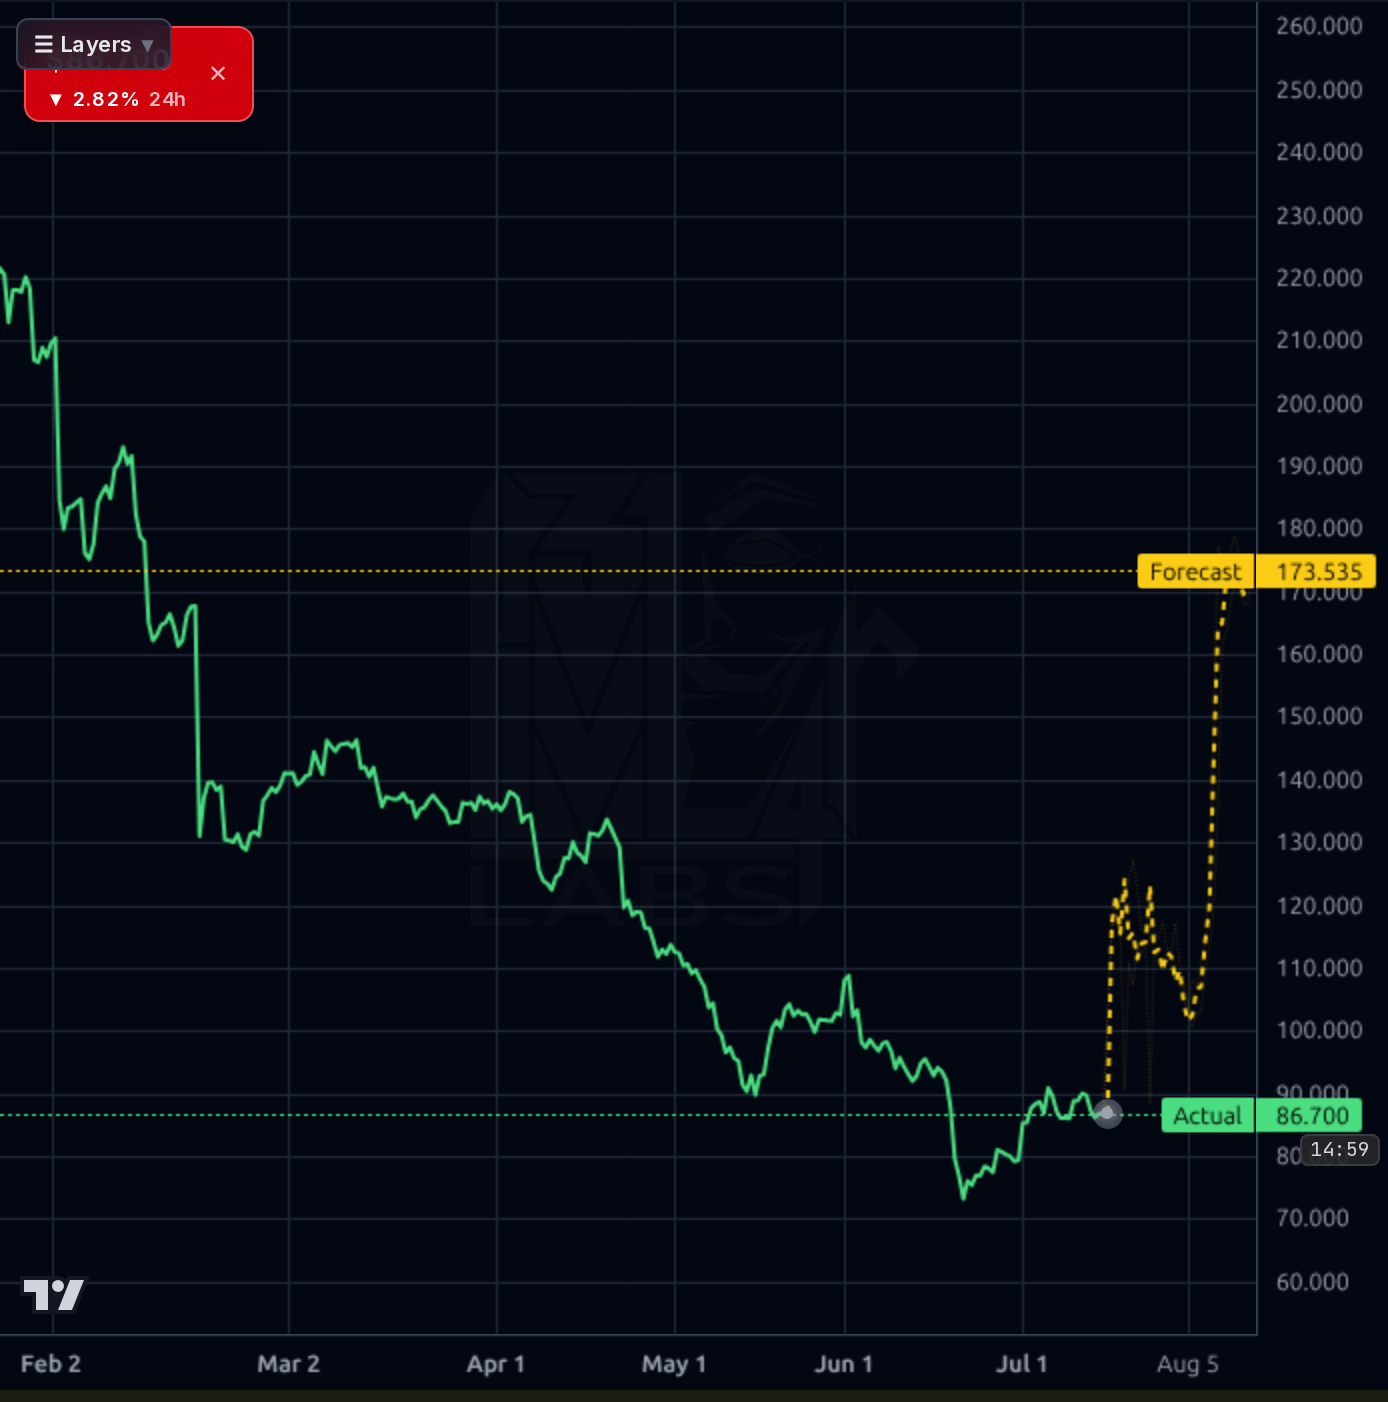
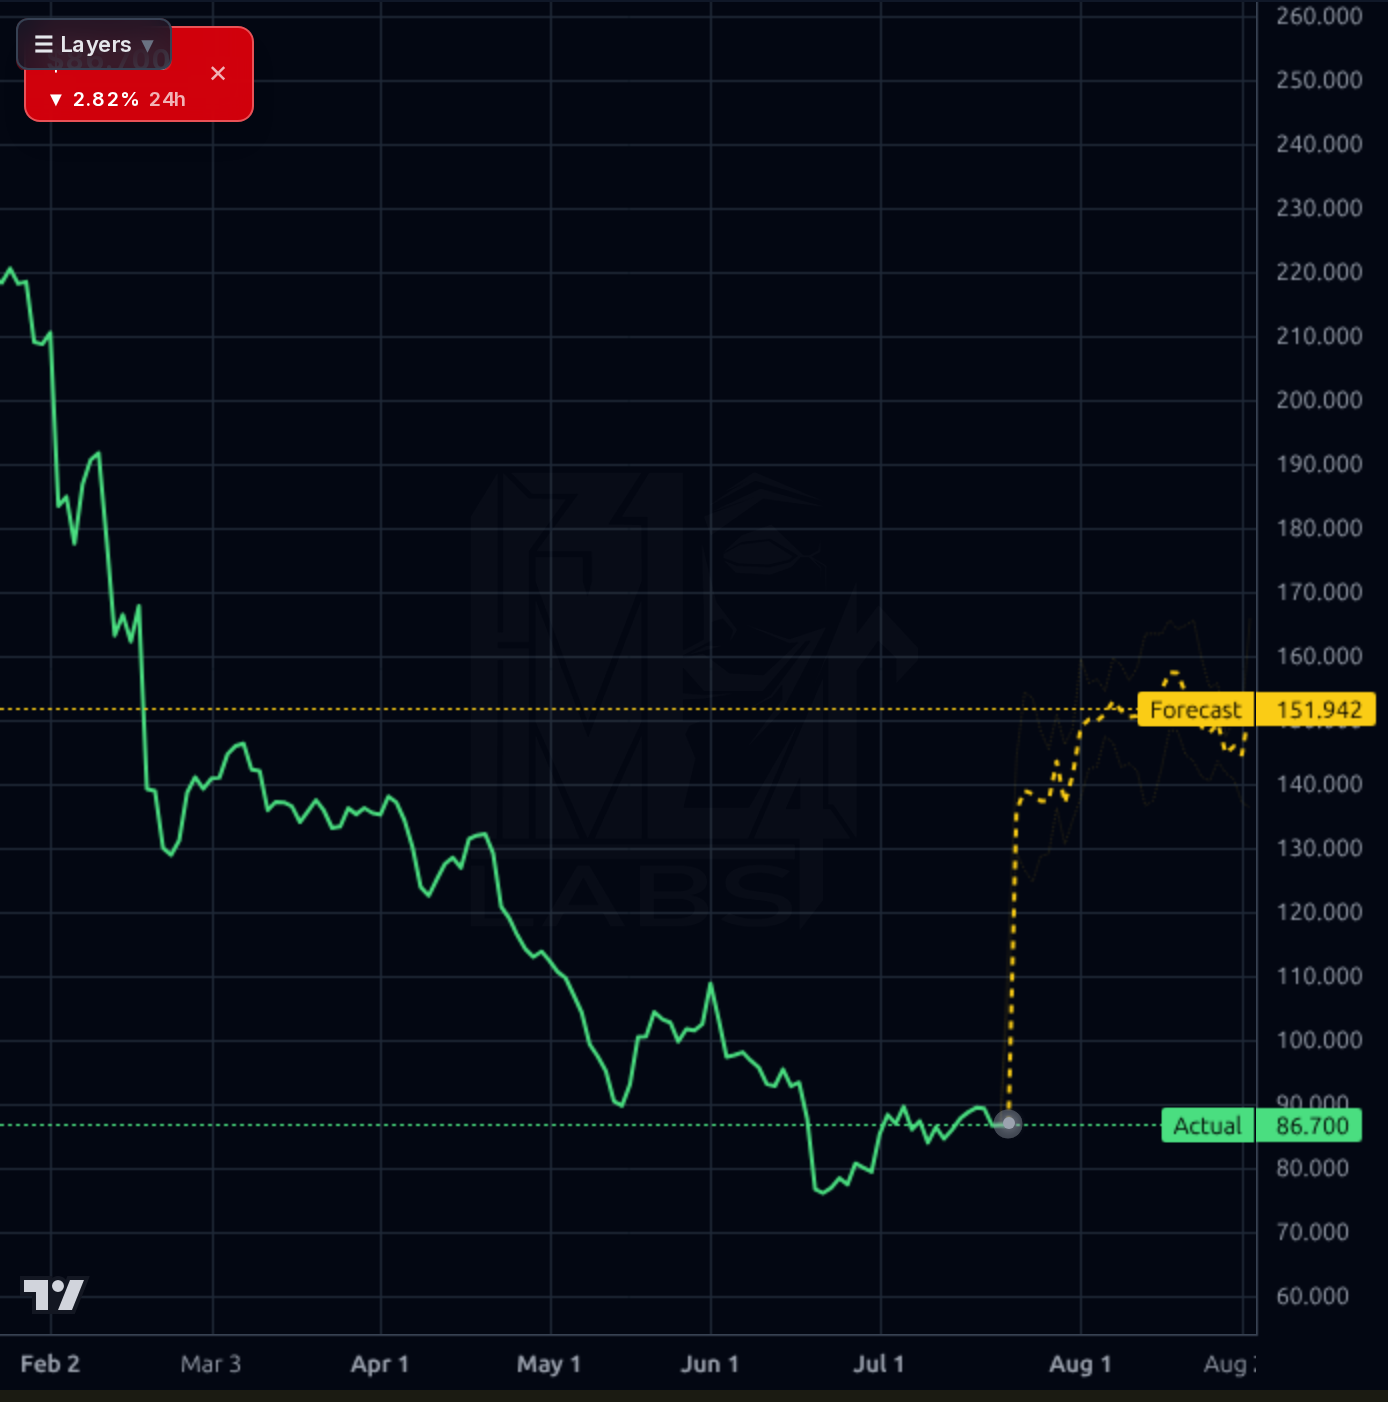
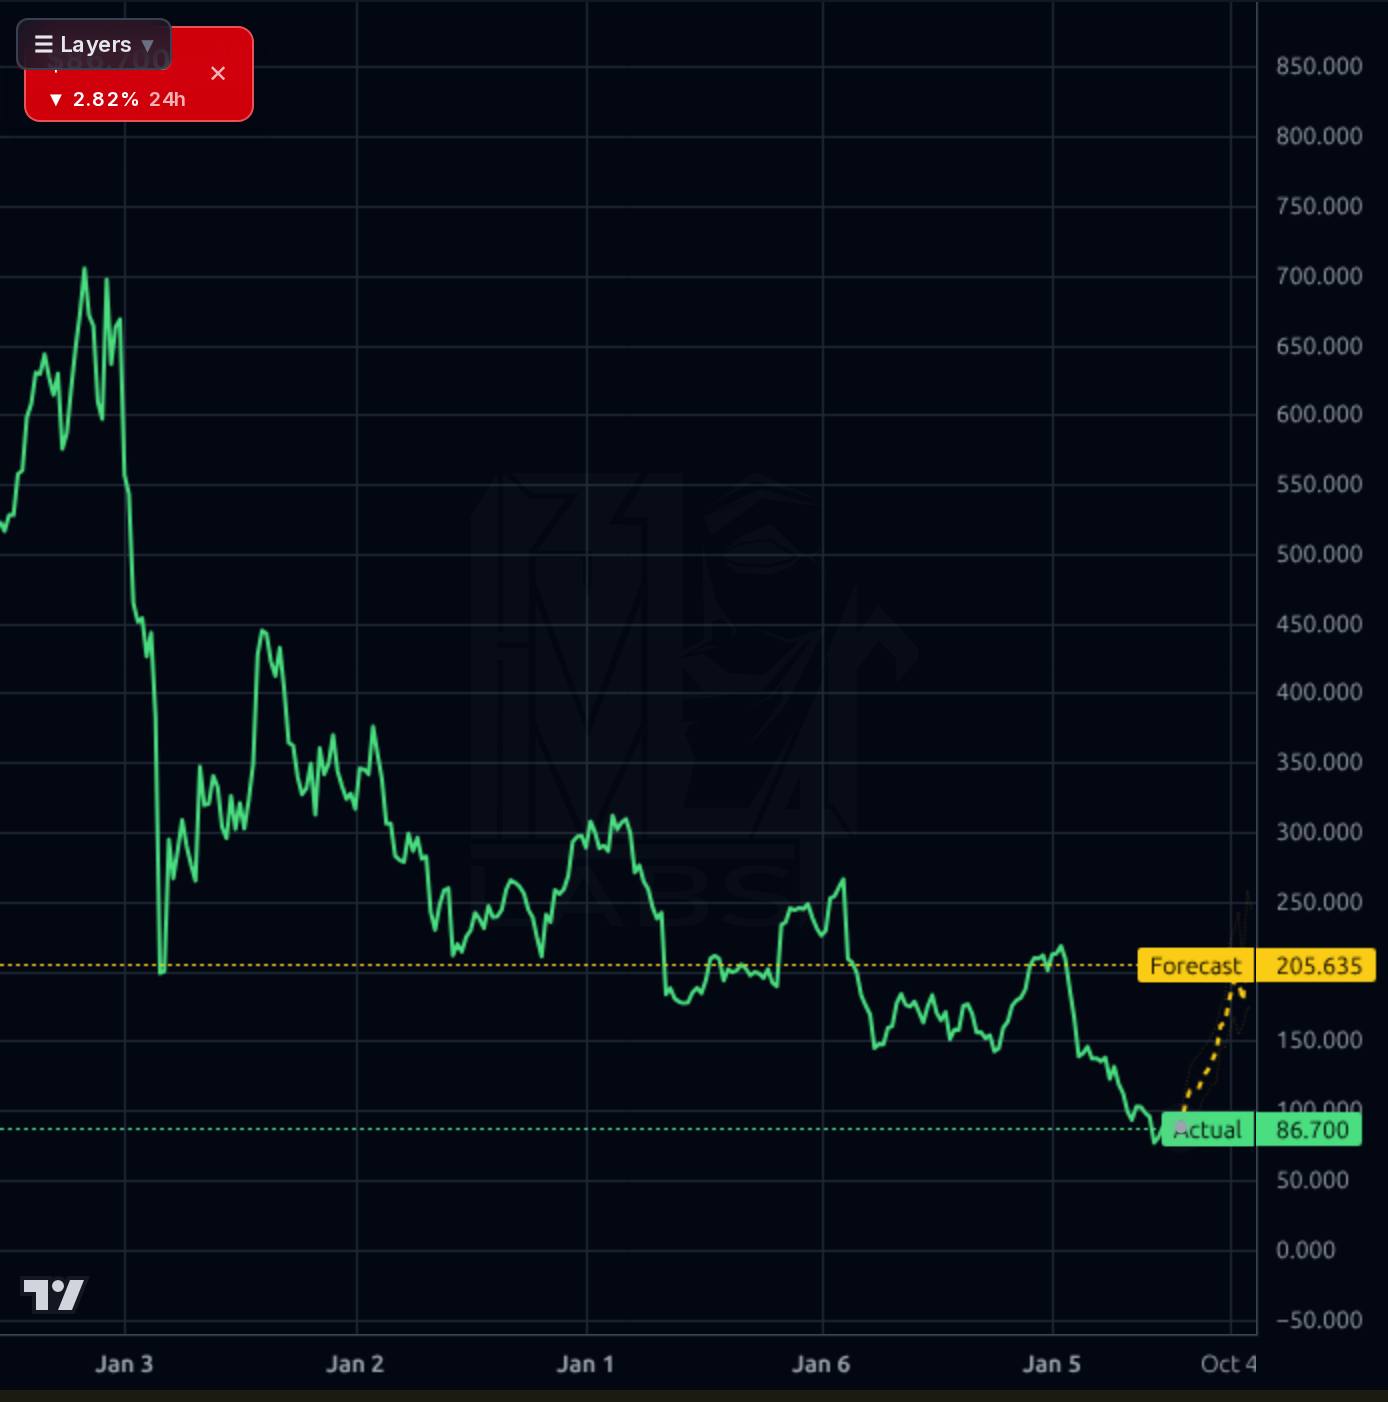
1-4 week view: HOLD into the Aug 6 earnings print, no new entries. This is a binary catalyst 14 days out — do not size a swing trade into it. If long, hold existing exposure unhedged (the 22.4% short float makes hedges expensive and creates squeeze risk on a beat). Key levels: $80 is hard invalidation (breach triggers exit to $73 52-week low); $92 reclaim would be the first constructive signal; $95-$100 is the likely gap zone on a beat. IV crush post-print is guaranteed — do not buy calls into the event. Earnings stance: neutral-to-cautiously-constructive given trough valuation and derated expectations, but explicit no-trade window.
1-6 month view: The thesis is binary and post-earnings driven. Bull path ($115-$130): if Aug 6 shows GM recovery toward 29%+, OCF returns positive, and 2026 guide holds 4-6.5% growth, expect multiple re-rating toward 8-9x forward P/E on $14.13 forward EPS = $113-$127. Bear path ($68-$75): if margins compress further or guide is cut, expect a break of $80 support and a retest of the $73 52-week low with air pocket to high-$60s. Base case ($92-$100): in-line print, modest relief rally as shorts cover, but no sustained breakout without evidence of AI-native transition monetizing. What would change my mind: (1) a clear signal that AI-driven client insourcing is compressing pricing structurally, not cyclically; (2) OCF failing to normalize in Q2; (3) reversal of the recent institutional ownership build (+3.7pp to 120.6%).
1-3 year view: EPAM's terminal value depends on whether it can pivot from a body-shop IT services model to an 'AI-native' delivery model where 250 engineering leads + 10,000 cloud architects can justify premium pricing through agentic automation rather than headcount arbitrage. The Anthropic partnership, AI/RUN platform, and Databricks 2026 SI of the Year award are directional positives but must show up as gross margin expansion above 30% and operating margins toward mid-teens by 2027. Biggest structural risk: the multi-year TAM for offshore/nearshore IT consulting is genuinely threatened by GenAI-enabled client insourcing — if this proves secular, EPAM's revenue base could stagnate at $5.5-6B for years while margins compress toward mid-single-digits, justifying the current 6x P/E. Optionality: $1.04B cash position enables aggressive M&A or buybacks that could accelerate the transition. Terminal fair value range: $60 (broken thesis) to $180 (successful AI-native re-rating), skewed lower until Aug 6 proves the cyclical case.
EPAM's fundamentals show a bifurcated picture: TTM revenue of $5.56B is growing +14.2% Y/Y with Q1'26 revenue of $1.40B (+7.6% Y/Y implied) demonstrating demand resilience, but profitability metrics are compressing — Q1'26 gross margin fell to 27.7% (vs 30.1% in Q4'25 and ~29% run-rate), operating margin dropped to 8.3%, and operating cash flow swung negative to -$36M from +$283M in Q4'25. The balance sheet remains a fortress with $1.04B cash, only $288M total debt (D/E 0.08 by net), and $3.43B stockholders equity — providing meaningful downside insulation. Capital allocation is shareholder-friendly with $264M in Q1 buybacks per the research, and free cash flow trailing at $693M supports ongoing repurchases. The Q1 OCF miss is the key concern — management must clarify on Aug 6 whether it was working-capital timing (seasonally common) or structural pricing pressure. Forward P/E of 6.1x and P/FCF of 8.3x are trough valuations, but ROE has compressed to 10.9% (from mid-teens historically), reflecting the margin issue rather than a broken model.
Across timeframes the picture is 'basing, not breaking out.' The 1h chart shows sideways consolidation between $84-$90 for the past 10 days after a run from $75 in late June, with price at $86.70 sitting -2.8% intraday. The 4h and daily charts show EPAM has stabilized above the $80 support after a violent H1 2026 decline from $220+ — RSI 47 is neutral, SMA20 distance is +1.8% (slight positive), but SMA50 is still -5.2% and SMA200 is -41.1%, confirming a broken longer-term trend. The weekly chart makes the damage explicit: -84% from 5-year highs and -58% YTD. The forecast band shows aggressive upside targets ($102-$205 across horizons) that must be heavily discounted given the model's 1d directional accuracy (74%) trails the naive baseline (77%) and MAPE of 53% — only the 1wk band (83% accuracy, MAPE 3%) carries weight, and it suggests near-term stability rather than a vertical breakout. Key levels: $80 must hold as invalidation; $92 is the immediate resistance to reclaim; $95-$100 is the earnings-gap zone. The 22.4% short float creates squeeze potential on any positive print.
The news flow is dominated by sell-side derating heading into the Aug 6 print: Deutsche Bank cut its target to $85 (from $110) on 7/10, Wells Fargo cut to $125 (from $151) while maintaining Overweight, and TD Cowen cut to $131 (from $170) while maintaining Buy. The consensus target of $135.94 still implies +57% upside, and the Recom score of 1.86 remains constructive — this is analysts marking down magnitude, not conviction. Zacks flagged the name as an undervalued play and highlighted a positive earnings surprise history. The prior Anthropic partnership and AI/RUN platform narrative provides a growth story but has not yet translated to reported financials. Signal: sell-side is de-risking into the print, which historically sets up either a beat-driven squeeze (given 22% short float) or a further leg down if margins disappoint. Noise: retail sentiment on Stocktwits is uniformly bullish with '$220 soon' calls that are disconnected from current fundamentals.
- Aug 6 earnings print: consensus EPS $3.14 with margin recovery from Q1'26's compressed GM 27.7% back toward the 29-30% run-rate is the critical validation
- Anthropic multiyear partnership announced May 2026 with 250 engineering 'Black Belts' and 10,000 cloud-certified architects to accelerate enterprise AI delivery
- AI/RUN platform and Empathy Lab internal IP designed to operationalize AI at scale — pure AI revenues cited at $125M with double-digit sequential growth
- 2026 Databricks Consulting & Systems Integrator AI Partner of the Year award validates positioning in data/AI stack
- $264M Q1'26 buybacks against $1.04B cash pile — capital return acceleration is a plausible near-term catalyst independent of operational recovery
- Binary Aug 6 earnings risk: failure to reverse Q1'26 GM compression (27.7%) and -$36M OCF triggers a break of $80 support with air pocket to $73
- Structural TAM erosion from GenAI-enabled client insourcing is the multi-year thesis breaker — could permanently cap revenue and margins
- 22.4% short float creates two-way tail risk: squeeze on a beat, cascade lower on a miss with limited natural buyers
- Sell-side PT cuts (DB to $85, WFC to $125, TD Cowen to $131) reflect eroding conviction on magnitude even where ratings remain constructive
- Cash flow quality is inconsistent — Q4'25 OCF +$283M vs Q1'26 -$36M — needs Q2 to confirm normalization vs structural working capital deterioration
- Prior bull targets ($145+) have systematically failed to print on this name; realistic upper bound closer to $115-$130 absent a decisive earnings surprise
- SMA200 distance of -41% confirms a broken longer-term trend that requires sustained recovery, not just a bounce, to repair
Get AI analysis on any stock
This is one of hundreds of Kronos AI reports — scored fundamentals & technicals, bull/base/bear price targets, a multi-horizon plan, and continuously-updated forecasts across the market. Create a free account to explore them all.
Create your free account →Already a member? Sign in · Join our Discord