EPAM — AI Stock Forecast & Price Targets
Published 7/14/2026 · A free sample of K3vl4r’s AI-powered analysis.
Kronos price forecasts, scored fundamentals & technicals, and a multi-horizon plan.
View the live EPAM price forecast →
EPAM trades at 6.1x forward EPS with $1.04B cash and D/E 0.08 after a devastating -58% YTD drawdown, offering deep-value optionality but with legitimate structural questions about AI-driven client insourcing eroding the IT services TAM. The August 6th earnings print (~23 days away) is a binary catalyst — Q1's gross margin compression to 27.7% and negative $36M OCF must reverse to validate the cyclical trough thesis. Position sizing must respect the pre-earnings binary; short-term forecast model is not reliable enough to fade the print.
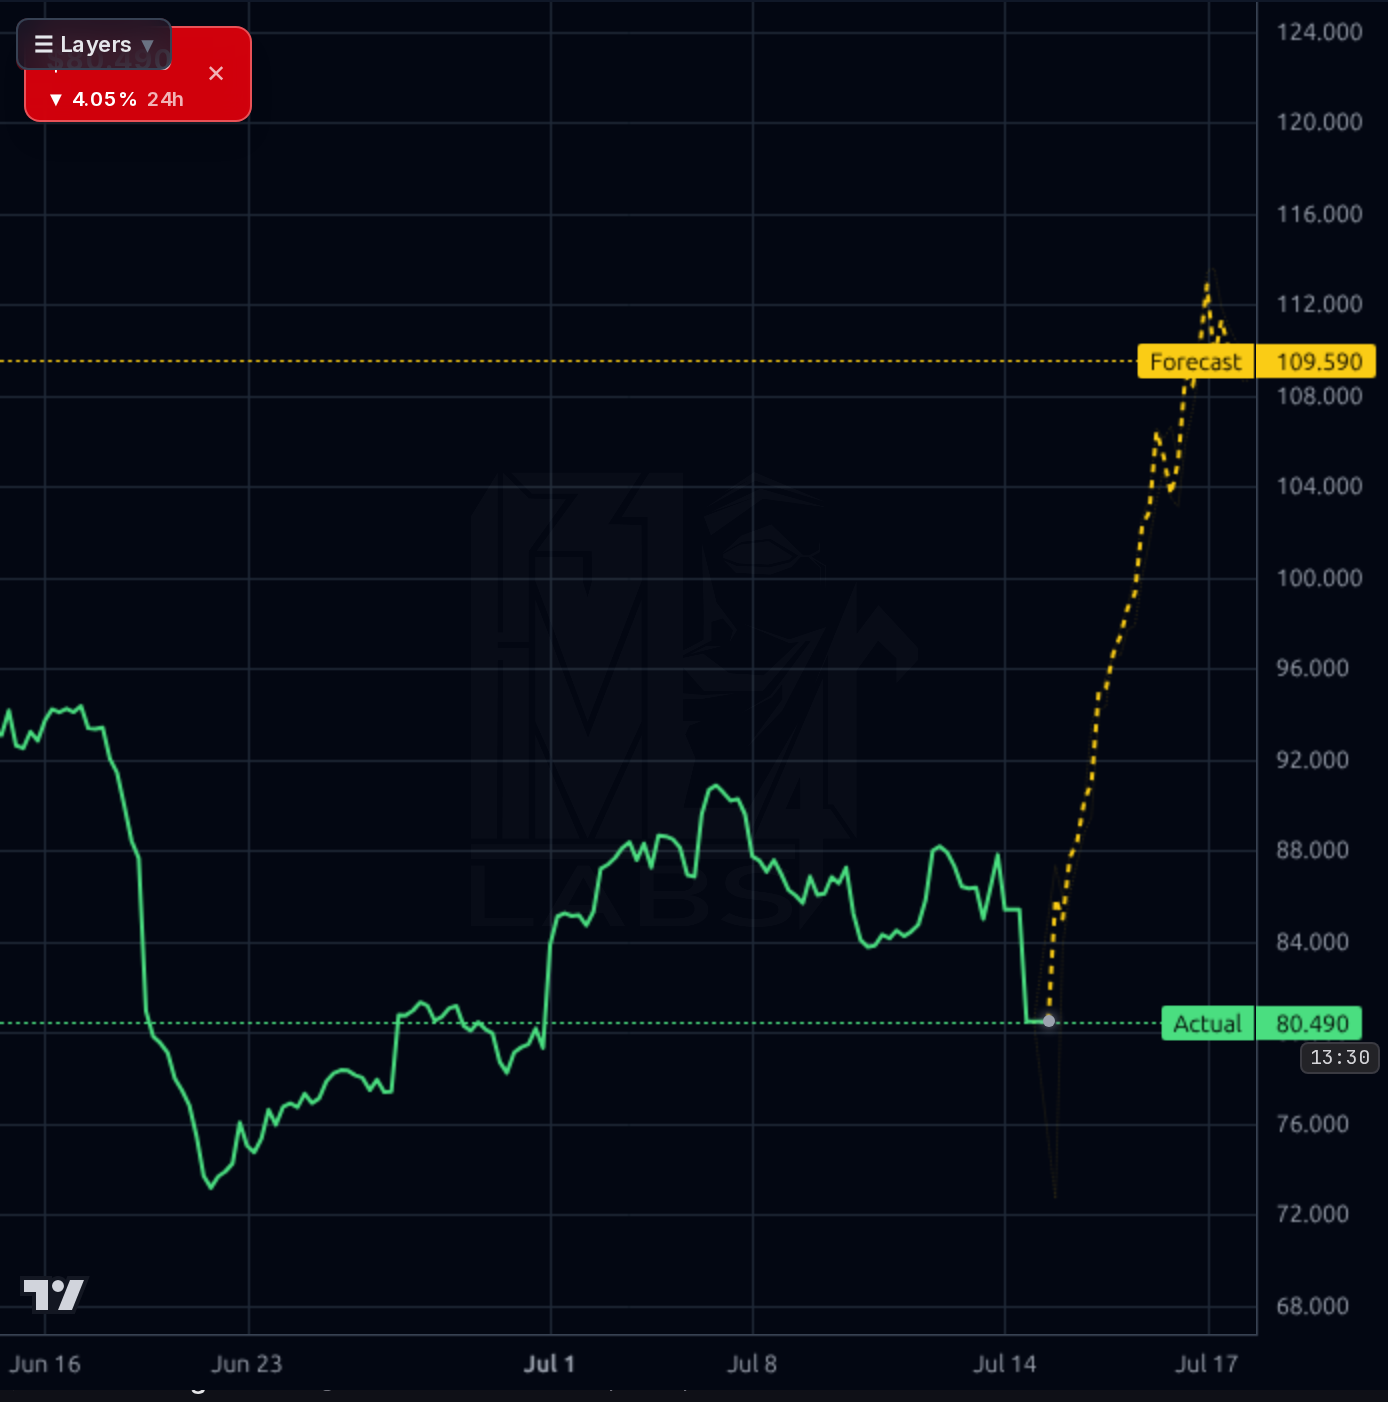
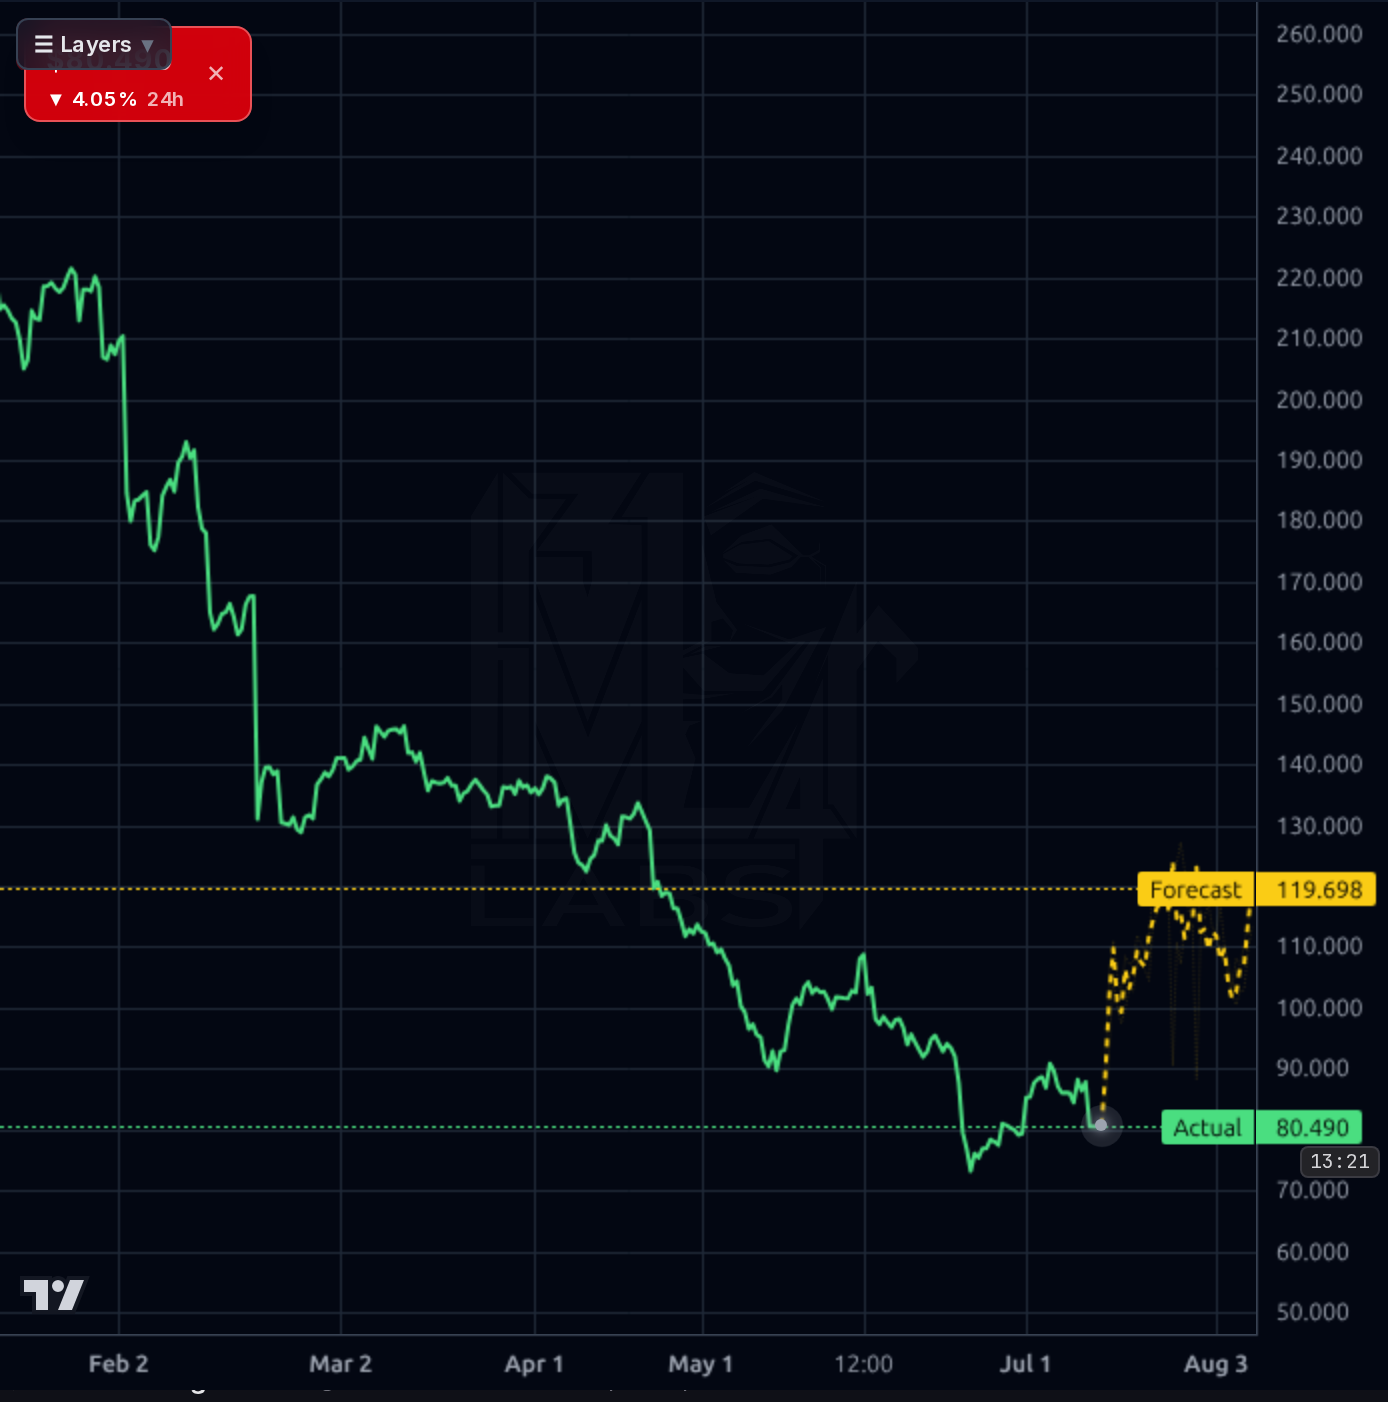
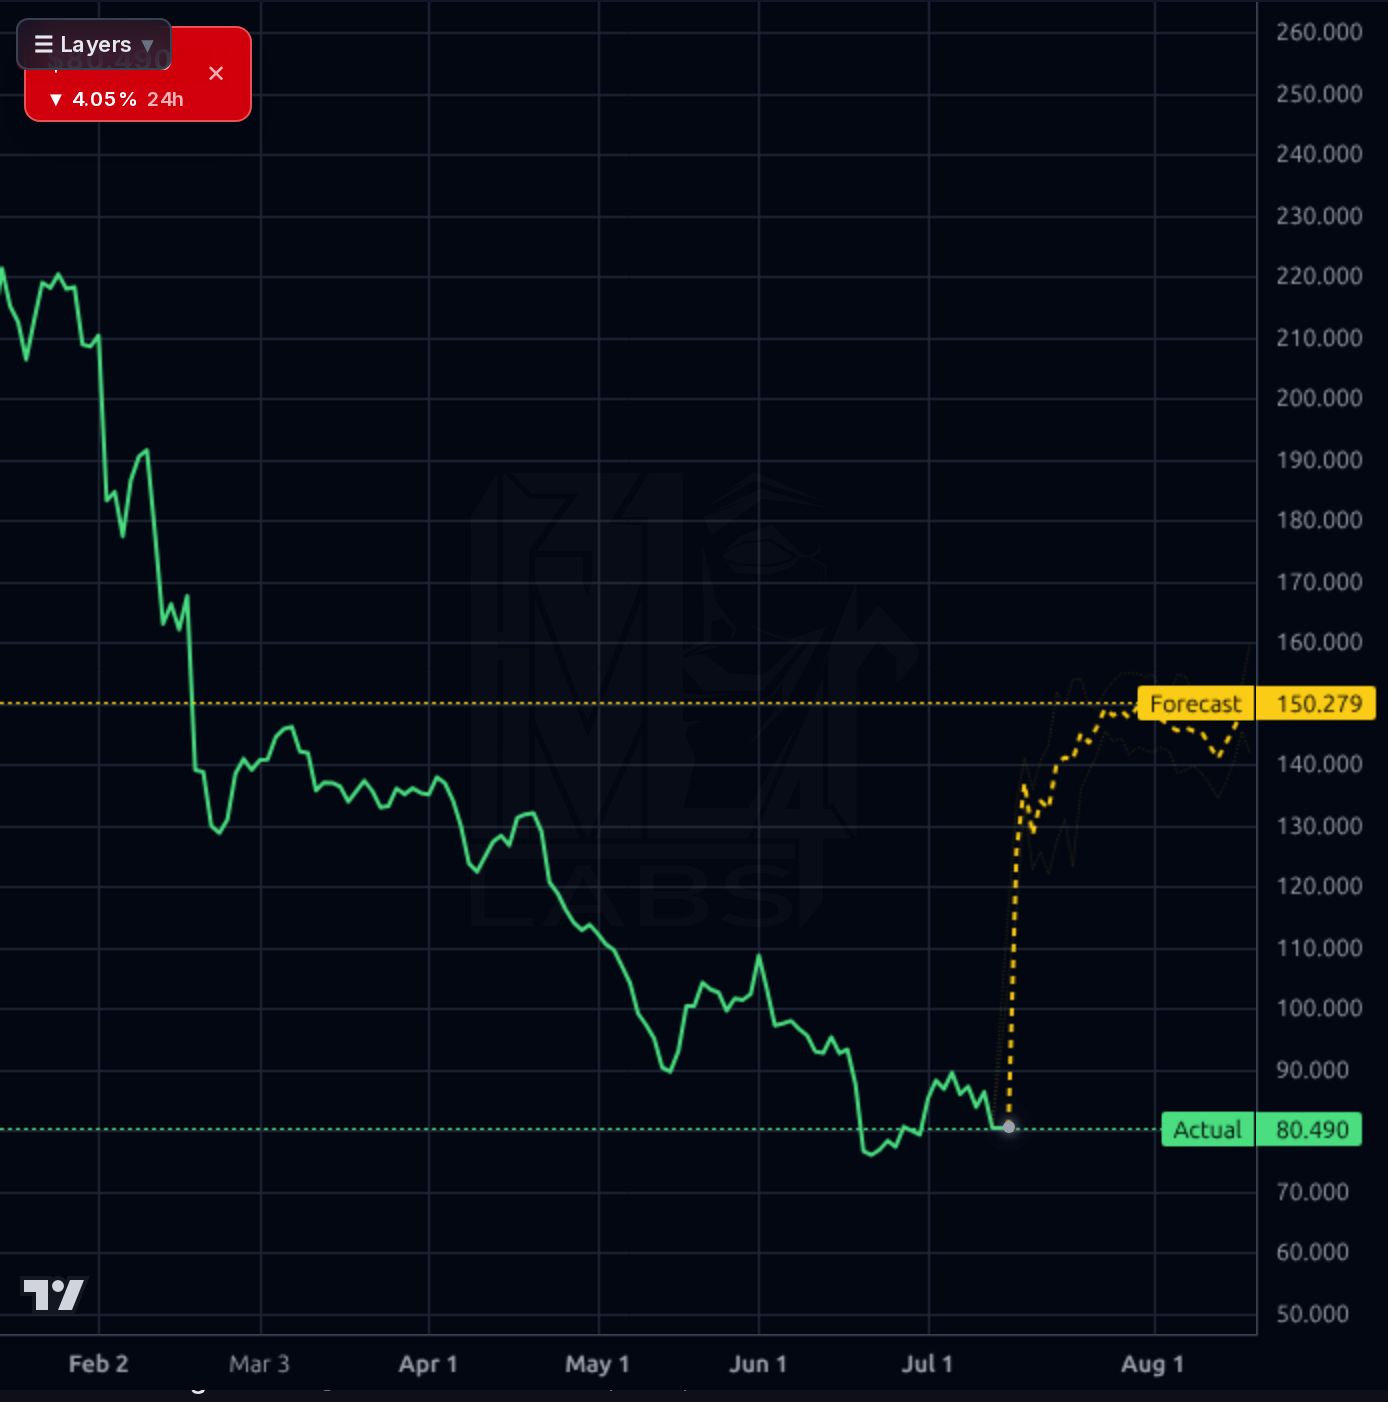
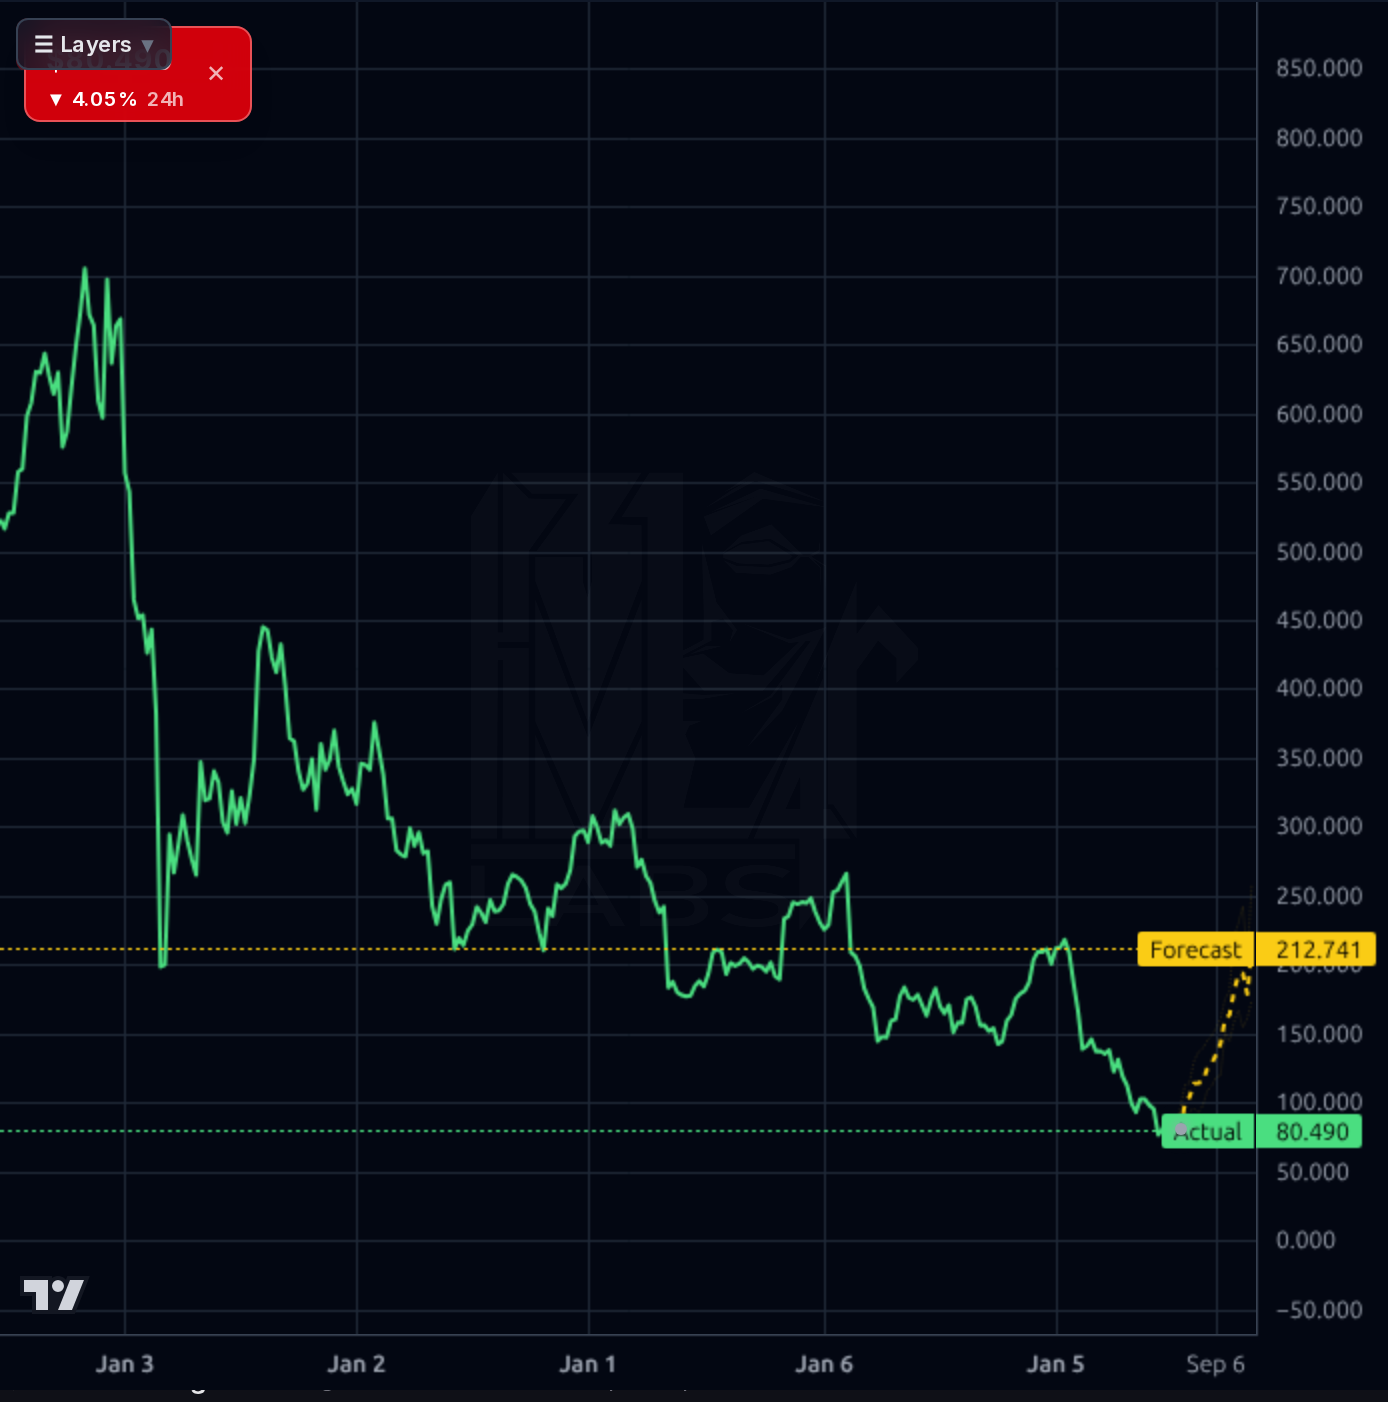
Hold or scale accumulation with strict pre-earnings sizing discipline. Do not add fresh risk into the August 6th print — that is a binary event with likely IV crush and gap risk in either direction. Immediate levels: support $80 then $73 (structural line in sand); resistance $88-90 then $95. If price breaks $88 pre-earnings on volume, that's a signal institutions are front-running a positive print, but chase-rate should be light. Invalidation for the near-term constructive view is a break below $78 that fails to reclaim — signals earnings-related de-risking. Do not rely on the model's aggressive upside forecast; its 1d accuracy is below naive baseline.
1-6 month view is entirely earnings-print-dependent. Base case: gross margin stabilizes in the 27-28% range, OCF reverts positive, guidance holds — stock re-rates to $95-105 as fwd P/E expands from 6x to 7-8x. Bear case: margin compression continues below 27%, guidance cut, $73 breaks and stock trades to $60-65 as market prices structural AI disruption. Bull case: management articulates concrete AI/cloud revenue attribution with margin uplift, print beats — stock recovers to $115-120. Expected return range -20% to +35% skewed by binary. What changes my mind: (a) pre-announcement or preliminary results, (b) another peer (ACN, IBM services) print that clarifies the AI-services demand picture, (c) a major AI/cloud partnership announcement with margin implications.
1-3 year terminal thesis: EPAM is either a $150-200 stock (cyclical trough recovery, AI integration wedge succeeds, gross margins normalize to 30%+, revenue reaccelerates to double-digit growth) or a $50-70 stock (structural TAM compression proves real, gross margins settle in mid-20s, becoming a slow-melting commodity IT services provider). The $1B+ cash pile is the multi-year hedge — even in the bear structural case, buybacks at current levels are meaningfully accretive. Biggest structural risk: AI-driven client insourcing genuinely compresses the addressable IT services market by 20-30%, and EPAM's Eastern European talent arbitrage advantage erodes as coding productivity gains commoditize. The 3-year path requires proof that EPAM captures net-new AI/cloud transformation work at higher-than-legacy margins.
Revenue is trending positively on a TTM basis (+14.2% Y/Y, $5.56B) but sequential momentum has decelerated with Q1 2026 revenue of $1.40B roughly flat vs Q4 2025's $1.41B. The more concerning story is margin compression: gross margin fell from 30.1% in Q4 2025 to 27.7% in Q1 2026, operating margin from 10.6% to 8.3%, and net income dropped from $109M to $82M sequentially. Q1 operating cash flow swung to -$36M from +$283M in Q4, a working-capital-driven miss but still a red flag on cash conversion. The balance sheet remains a fortress: $1.04B cash, only $288M total debt, D/E 0.08, current ratio 2.67, book value $65/share providing meaningful downside cushion at $86. TTM FCF of $693M against a $4.5B market cap is a 15% FCF yield — extraordinary if margins hold. Capital allocation appears to include ongoing buybacks (shares outstanding decreased) but no dividend. Forward P/E of 6.1x and PEG 0.58 are compelling IF forward EPS of $14.15 is credible; that's the entire debate heading into August 6th.
The multi-timeframe picture is broken. On the weekly, EPAM has collapsed from ~$700 in early 2021 to $80 (-88%), a full secular downtrend with no confirmed reversal. The daily shows a downtrend from $220 in February to a $73 low, with price now attempting a base near $80-86 but SMA200 sitting 42% above spot — a violent overhead supply issue. The 1h/4h charts show the recent bounce from $73 to ~$86, with price now +2.4% above SMA20 but still -8.3% below SMA50. RSI at 46.8 is neutral, offering no oversold bounce edge. Immediate resistance is the $88-90 zone (recent swing high and prior consolidation), then $95-100. Support is $80, then the $73 low which is the make-or-break structural level. The Kronos forecast bands project sharply higher into the $110-150 zone across timeframes, but the model's realized directional accuracy (55% vs 56% naive baseline on 1d) means those upside projections should be heavily discounted — this looks like the model extrapolating oversold mean-reversion that has repeatedly failed to print in this name.
The news flow is decidedly negative on sell-side positioning: Deutsche Bank cut its target to $85 (from $110), Wells Fargo trimmed to $125 (from $151), and TD Cowen lowered to $131 (from $170) — all within the past week. The consensus target of $135.94 is a moving target that keeps getting revised down, which is more informative than the absolute level. The stock traded down ~4% on the Deutsche Bank cut, indicating the market is still price-sensitive to negative revisions. Value-oriented articles (Zacks, StockStory) frame EPAM as oversold and potentially undervalued, but that is a well-worn narrative that has not produced a floor. Broader market news (Iran/oil, crypto) is not directly relevant. Institutional ownership climbed +3.7pp to 120.7%, and short interest sits at 22.4% of float with a 5.75 short ratio — the setup is a classic contested value name where longs are accumulating while shorts press the structural AI-disruption thesis. Signal: the earnings print is the referee.
- Databricks and AWS partnership integration to reposition service mix toward higher-margin cloud-native and AI transformation work
- TTM revenue growth of +14.2% Y/Y indicates demand persists; scaling this against margin recovery is the core narrative to prove August 6th
- $1.04B cash position enables aggressive buyback acceleration at 6x fwd P/E, meaningfully accretive to per-share metrics
- Q1 EPS beat delivered 18.7% Q/Q growth — if repeatable, forward EPS trajectory of $14+ becomes credible and the fwd multiple compresses further
- August 6th earnings: gross margin compression below 27% or negative Q2 OCF triggers structural re-rating and likely break of $73 low
- Sell-side targets in active downward revision cycle (Deutsche Bank, Wells Fargo, TD Cowen all cut in past week) — momentum of negative revisions not yet exhausted
- 22.4% short float with 5.75 short ratio indicates strong structural short conviction; a squeeze is possible but shorts have been consistently right on this name
- AI-driven client insourcing risk permanently shrinking the IT services TAM by 20-30% — the core bear thesis not yet refuted
- Sequential margin compression Q4→Q1 (30.1% → 27.7% gross) and OCF swing (+$283M → -$36M) are the two data points that must reverse
- SMA200 sits 42% above spot — massive overhead supply, any rally faces persistent selling pressure from underwater holders
Get AI analysis on any stock
This is one of hundreds of Kronos AI reports — scored fundamentals & technicals, bull/base/bear price targets, a multi-horizon plan, and continuously-updated forecasts across the market. Create a free account to explore them all.
Create your free account →Already a member? Sign in · Join our Discord