EPAM — AI Stock Forecast & Price Targets
Published 7/16/2026 · A free sample of K3vl4r’s AI-powered analysis.
Kronos price forecasts, scored fundamentals & technicals, and a multi-horizon plan.
View the live EPAM price forecast →
EPAM is a deep-value IT services franchise trading at 6.05x forward EPS with $1.04B cash and near-zero net debt after a -58% YTD collapse, but the entire thesis pivots on the August 6th earnings print (~21 days away) reversing Q1's 27.7% gross margin compression and -$36M operating cash flow. Technicals show a bottoming pattern holding $80 support with a modest bounce off $73 lows, while the AI forecast band projects $105-113 into month-end — a move that requires margin proof, not just multiple expansion. Given the binary catalyst risk and repeated overshoot of prior bull targets, we favor a small pre-earnings starter position with the majority of capital reserved for post-print confirmation.
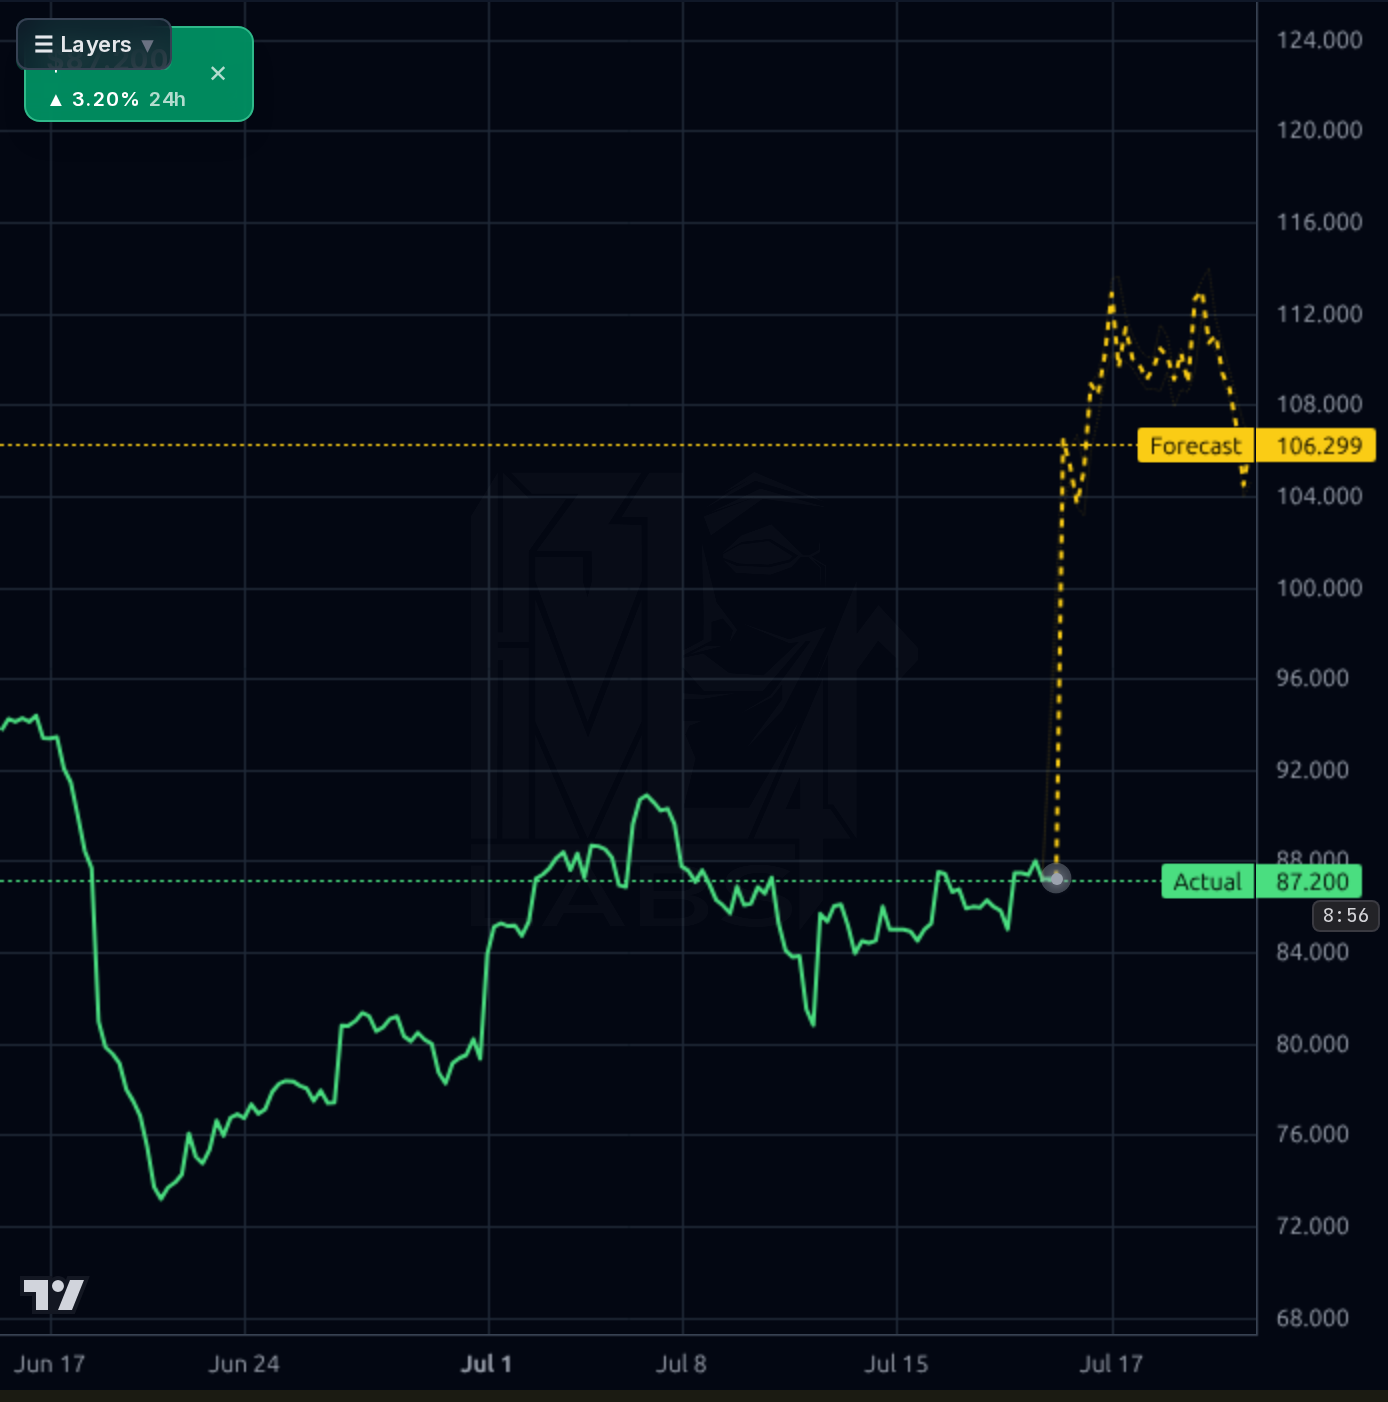
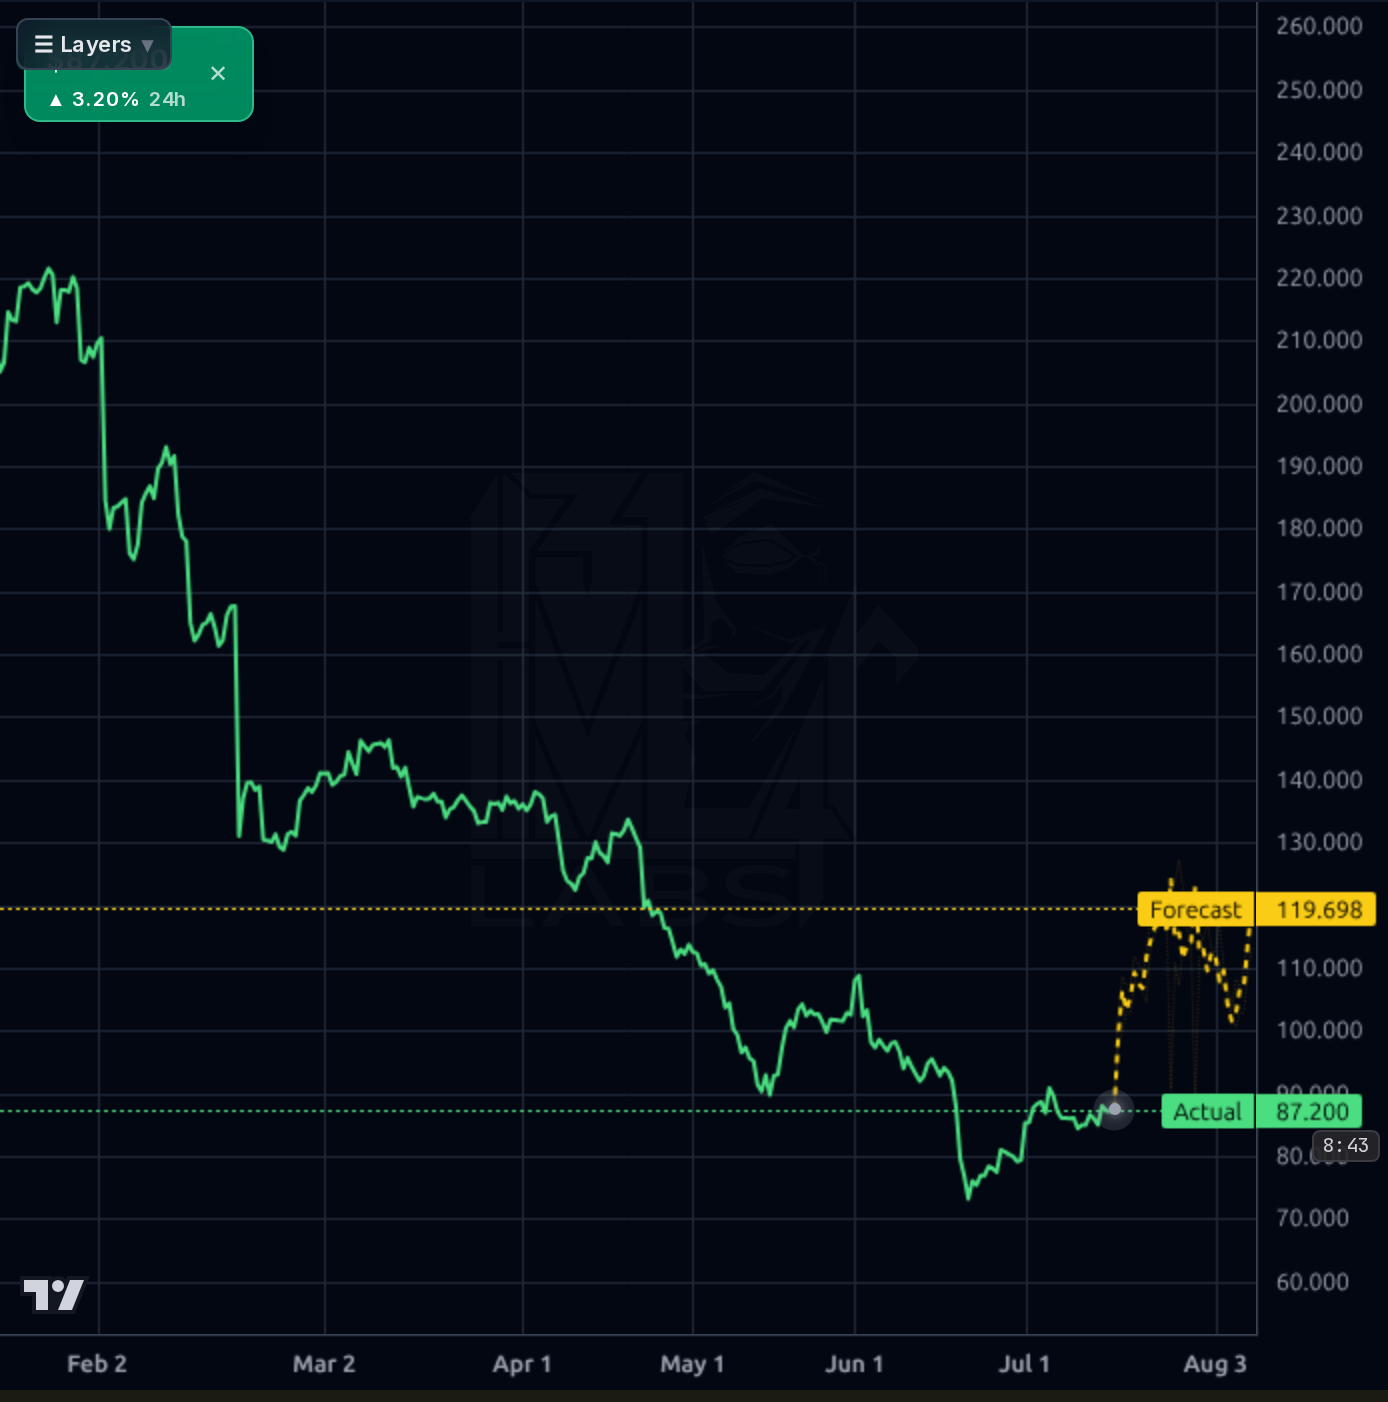
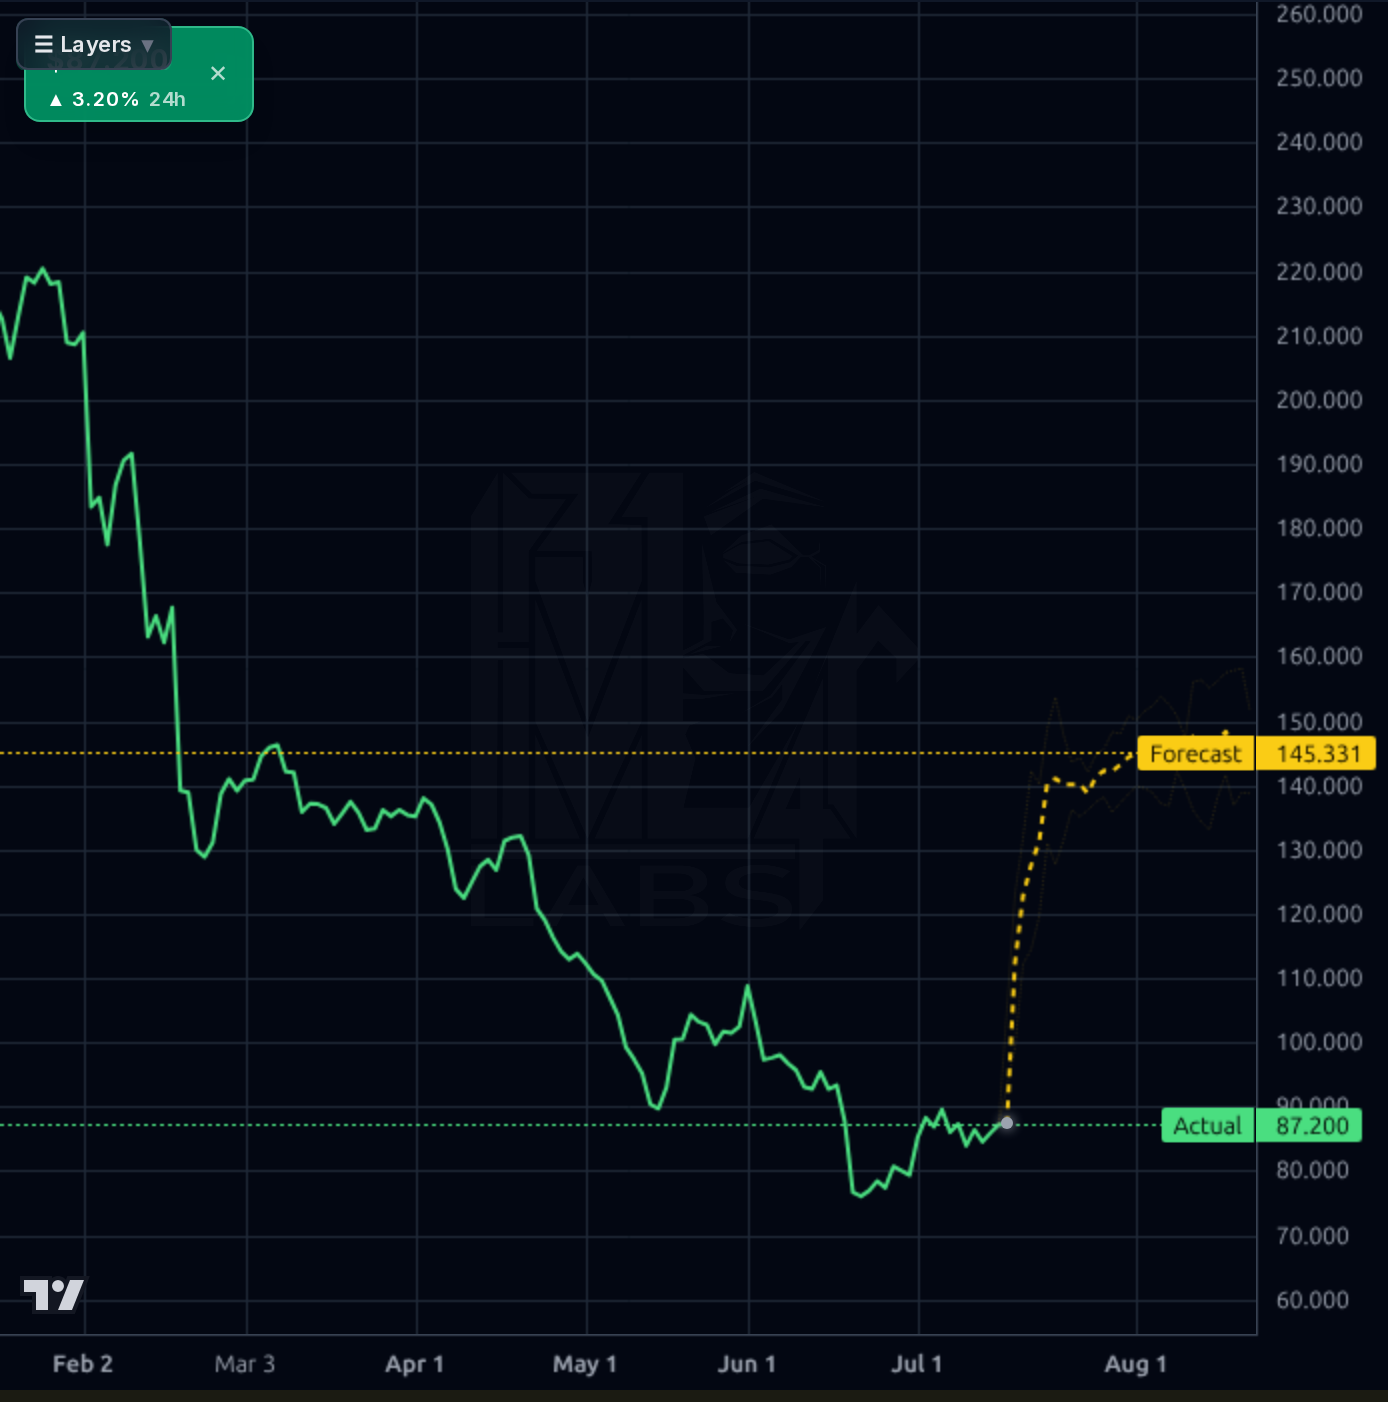
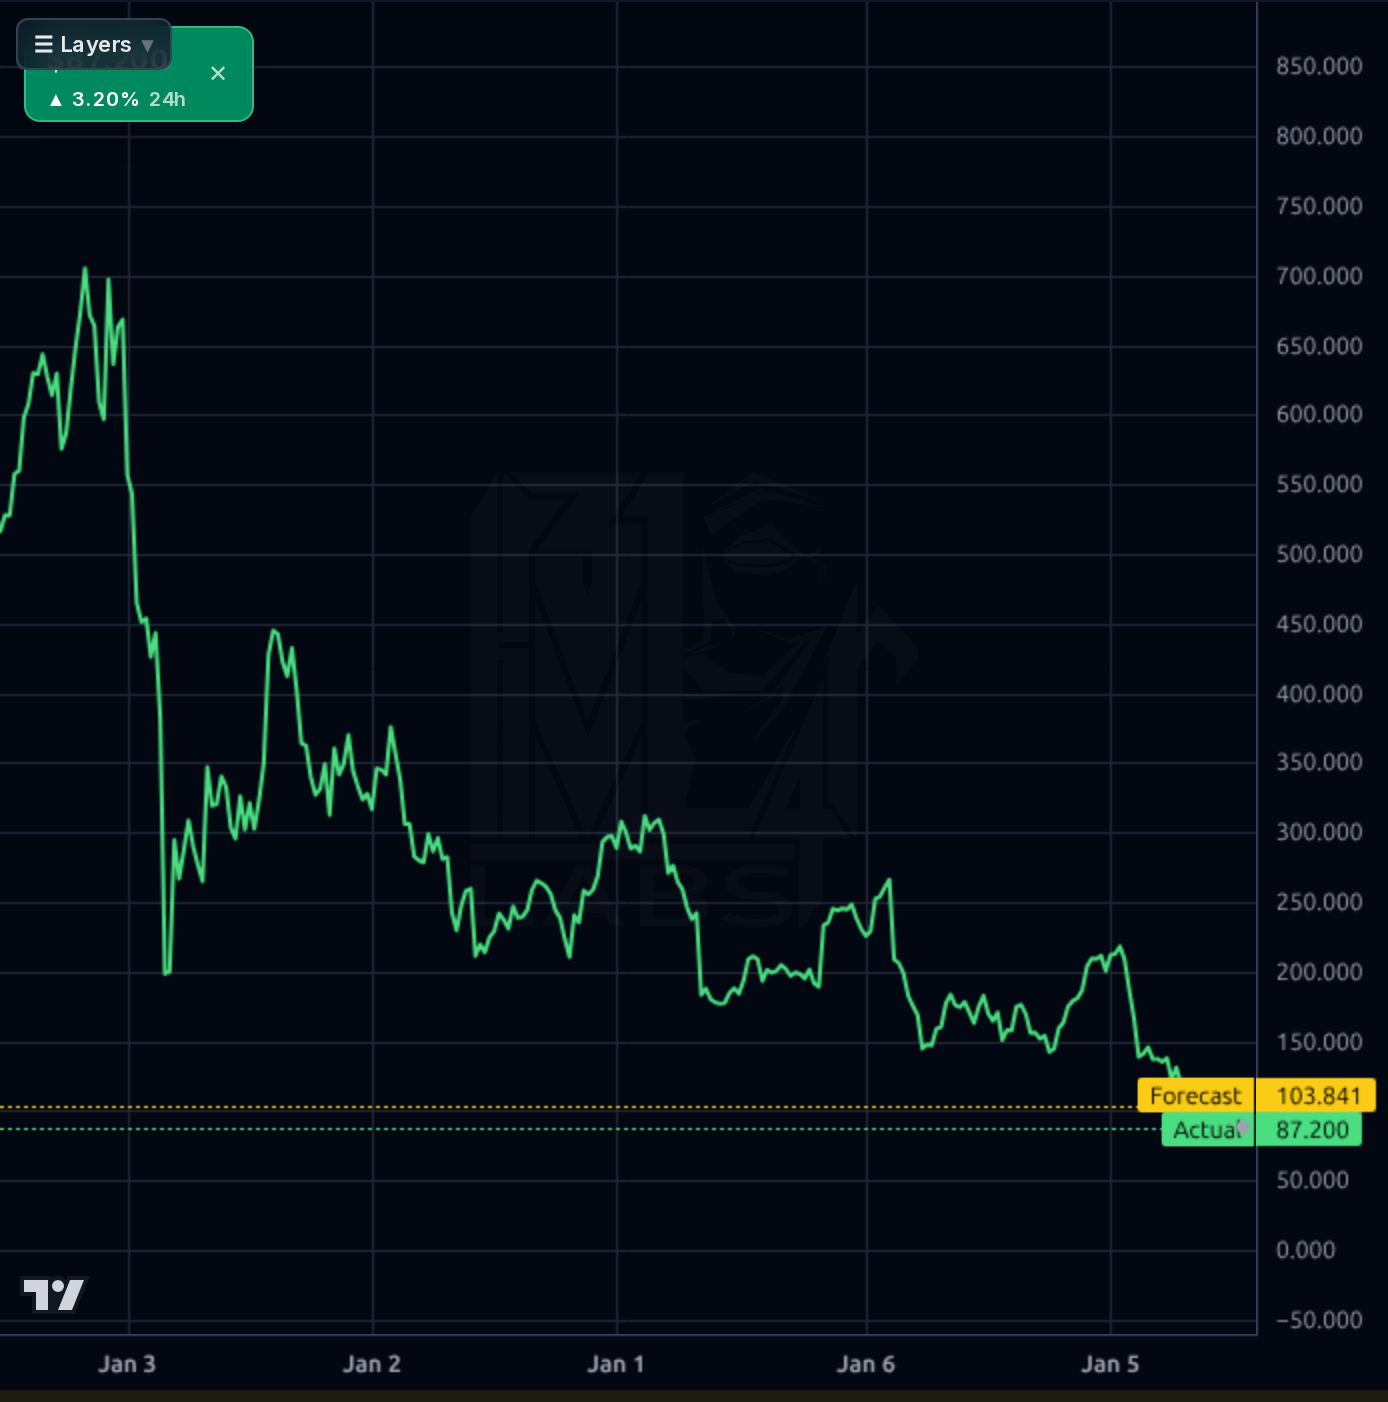
1-4 week view is dominated by the August 6 earnings print (~21 days out). Do NOT size a full position into a binary event with 22% short interest and elevated IV. Approach: initiate a small starter tranche (25-33% of intended size) at $85-88 with a hard stop below $78 (breaks $80 support and invalidates the higher-low). Target 1: $92-95 (SMA50 reclaim). Target 2: $100-105 (pre-earnings gap-fill target only if margin whispers turn positive). Do not chase into the print — reserve the majority of capital for post-earnings confirmation. Invalidation: close below $78 on volume, or any pre-announcement negative preannouncement/guidance cut.
1-6 month view hinges entirely on the August 6 print. Bull path: gross margin recovers to >28.5%, operating margin >10%, OCF returns firmly positive, and management provides constructive AI/Cloud mix commentary — in that scenario, multiple expansion to 8-9x forward EPS drives price to $110-125 range, and the short squeeze mechanics could overshoot to $130+ transiently. Bear path: margins remain compressed or guidance is cut, confirming structural TAM erosion — price retests $73 and potentially breaks to $60-65 as forced deleveraging accelerates. Expected return range: -25% to +40% over 6 months, skewed slightly positive on valuation floor but with heavy tail risk. What would change my mind: a negative preannouncement, another sell-side downgrade below $80, or Q2 revenue guide below +8% Y/Y.
1-3 year terminal thesis: if EPAM successfully repositions from labor-arbitrage engineering services to higher-margin AI/Cloud/Data offerings, this is a $150-200 stock as margins normalize back to 12-13% operating and revenue growth reaccelerates to mid-teens. Multi-year drivers: enterprise AI implementation demand, up-stacking into strategic advisory work, and continued organic hiring of specialized talent (62,750 employees, historical growth engine). The biggest structural risk is that generative AI collapses the value of the traditional staffing-heavy model faster than EPAM can pivot — if Fortune 500 clients build proprietary AI copilots that reduce their need for outsourced engineering headcount by 30-40%, EPAM's TAM shrinks permanently and the stock is a value trap at any price above book value ($65). Prior calls on this name have systematically overestimated recovery timing; a 12-24 month workout period is realistic, not 3-6 months.
Revenue is still growing — TTM sales $5.56B (+14.2% Y/Y), and quarterly revenue has climbed from $1.35B (Q2'25) to $1.40B (Q1'26), so the top line is not broken. The problem is profitability: gross margin compressed from 30.1% in Q4'25 to 27.7% in Q1'26, operating margin fell from 10.6% to 8.3%, and Q1 operating cash flow swung negative to -$36.4M (vs +$282.9M the prior quarter) with free cash flow of -$54.2M. The balance sheet remains a fortress — $1.04B cash, only $288M total debt (D/E 0.08, LT D/E 0.07), current ratio 2.67, book value $65/share against an $86 stock price (P/B 1.32). Trailing FCF of $693M against a $4.49B market cap gives a P/FCF of 8.3x and FCF yield ~15%, which is genuinely cheap for a growing services franchise. ROE 10.9%, ROIC 10.5% — decent, not stellar. Capital allocation shows no dividend and buyback pace unknown from this data; management has the balance sheet to be aggressive but hasn't visibly stepped in during the drawdown. Bottom line: the franchise generates cash, but Q1'26 margin and OCF prints are the single biggest reason the stock is at $86 and not $150, and until the August 6th report, we cannot distinguish cyclical trough from structural erosion.
Across timeframes the picture is a base-building attempt after a violent multi-quarter decline. The 1wk chart shows the stock has fallen from ~$700 (Jan '23 style peak) to $87 — an -87% peak-to-trough that dwarfs any typical cyclical drawdown. The 1d chart shows a lower-low at $73 in mid-June followed by a recovery back to $87, forming a potential higher-low structure; the stock is +17.6% off the 52-week low but still -61.4% off the $222 high. Short-term (1h chart) shows a tight $82-$88 range over the past week with price hugging the upper end at $87.20. The stock is +2.9% above SMA20, but -7.7% below SMA50 and -42.2% below SMA200 — a classic downtrend where price is trying to reclaim the near-term average but the longer averages remain overhead resistance. RSI 46.6 is neutral, providing no strong signal either way. Key levels: $80 support (defended twice), then $73 (52-wk low); overhead resistance at ~$90 (recent congestion), then $105-110 (Feb '26 breakdown zone). The model's forecast band projecting $105-113 in the near term is aggressive and directly contradicts realized short-term accuracy (1d directional accuracy 68% vs 69% naive — actually beaten by the coin flip); the 1wk model is more reliable (67% with only 7% MAPE). The forecast should be treated as an aspirational post-earnings scenario, not a base case.
The news flow is uniformly negative on sell-side sentiment: Deutsche Bank cut its target to $85 (from $110), Wells Fargo trimmed to $125 (from $151) but stayed Overweight, TD Cowen cut to $131 (from $170) but maintained Buy. The July 10 tape saw a -3.9% intraday reaction to the Deutsche cut. The signal here is that even the bulls are marking down price targets meaningfully while retaining buy ratings — this is classic capitulation-in-progress on the sell-side, which often coincides with (but does not guarantee) a bottom. The Zacks value-oriented coverage ("Are Investors Undervaluing EPAM?") and StockStory's inclusion of EPAM in an "oversold, ready to bounce" screen indicate the deep-value narrative has fully permeated the coverage universe. Note the L1 signal: institutional ownership actually ticked up from 117% to 120.7% (over 100% because of short covering mechanics and float dynamics — short float is 22.4%, an enormous crowd short), meaning institutions have been accumulating even as the stock has drifted lower. That short interest is the single most interesting technical feature — any positive earnings surprise on August 6 could catalyze a squeeze of material size.
- August 6 earnings: management guidance on FY26 revenue and specific commentary on AI/GenAI service revenue mix
- Reversal of Q1'26 margin compression — gross margin path back toward 30%+ historical range
- Institutional ownership ticked up +3.7pp to 120.7% (Jul 10 signal) — sophisticated capital accumulating into weakness
- Fortress balance sheet ($1.04B cash, book value $65/sh) provides optionality for accelerated buybacks or tuck-in AI/data acquisitions
- Underlying revenue growth remains +14.2% Y/Y TTM, indicating end-market demand is not collapsing
- 22.4% short float creates asymmetric squeeze potential on any positive earnings surprise
- August 6 binary earnings event with high IV — a miss on margins or OCF could drive a -15-25% gap lower to $65-73
- Structural AI-driven client insourcing permanently compressing IT services TAM and pricing power
- Q1'26 negative operating cash flow (-$36M) — if repeated in Q2, forces re-rating of the cash generation thesis
- Sell-side price targets being cut in cascade (Deutsche $85, Wells $125, TD Cowen $131) — momentum in analyst revisions still down
- Beta 1.42 amplifies downside in any tech-sector risk-off move despite already deep drawdown
- Gross margin at 27.7% (Q1'26) vs 30%+ historical — margin recovery is unproven, not assumed
- Prior recovery calls on this name have consistently overshot; +14-17% base target overestimation historically
Get AI analysis on any stock
This is one of hundreds of Kronos AI reports — scored fundamentals & technicals, bull/base/bear price targets, a multi-horizon plan, and continuously-updated forecasts across the market. Create a free account to explore them all.
Create your free account →Already a member? Sign in · Join our Discord