EPAM — AI Stock Forecast & Price Targets
Published 7/15/2026 · A free sample of K3vl4r’s AI-powered analysis.
Kronos price forecasts, scored fundamentals & technicals, and a multi-horizon plan.
View the live EPAM price forecast →
EPAM trades at 6.0x forward EPS with $1.04B cash and D/E 0.08 after a -58.8% YTD collapse, offering deep-value optionality but confronting legitimate structural questions about AI-driven client insourcing. The August 6th earnings print (~22 days out) is a binary catalyst — Q1's compressed 27.7% gross margin and -$36M OCF must reverse to validate the cyclical-trough thesis. Prior upside targets on this name have systematically failed to print, so I anchor to a tighter, more realistic base and treat the print as the stance-defining event.
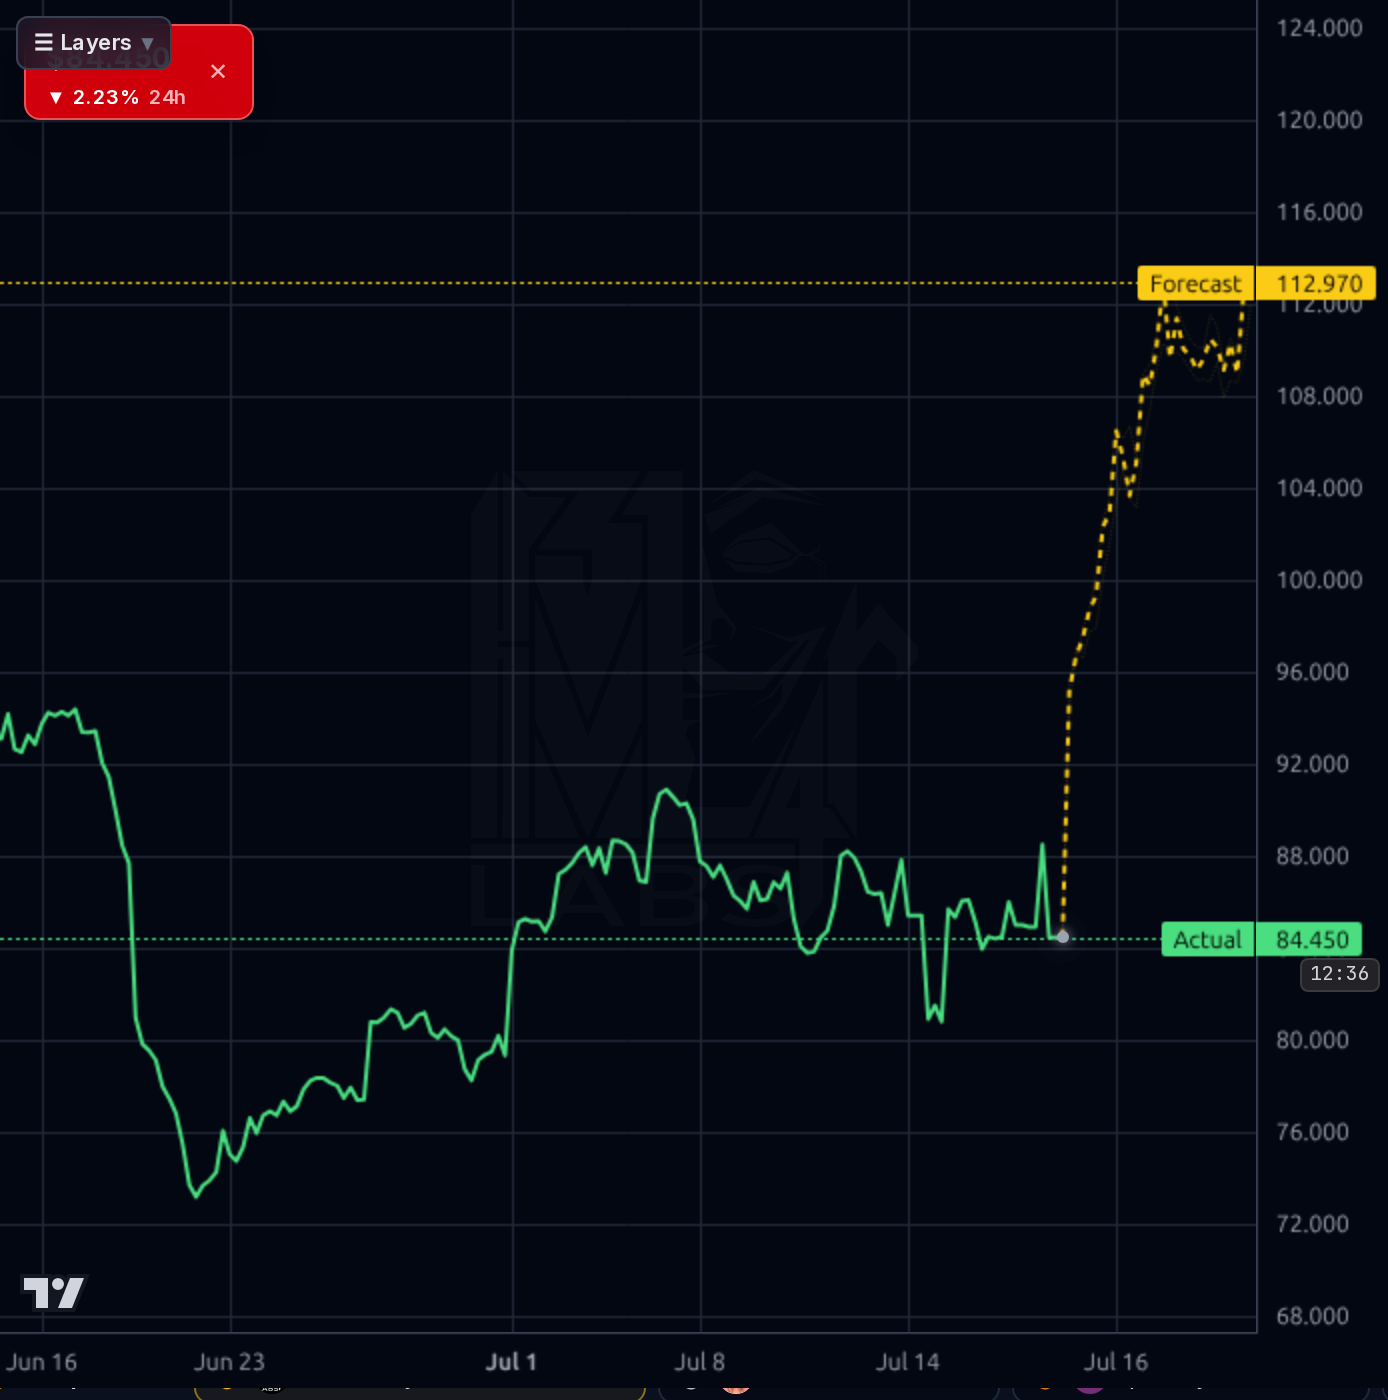
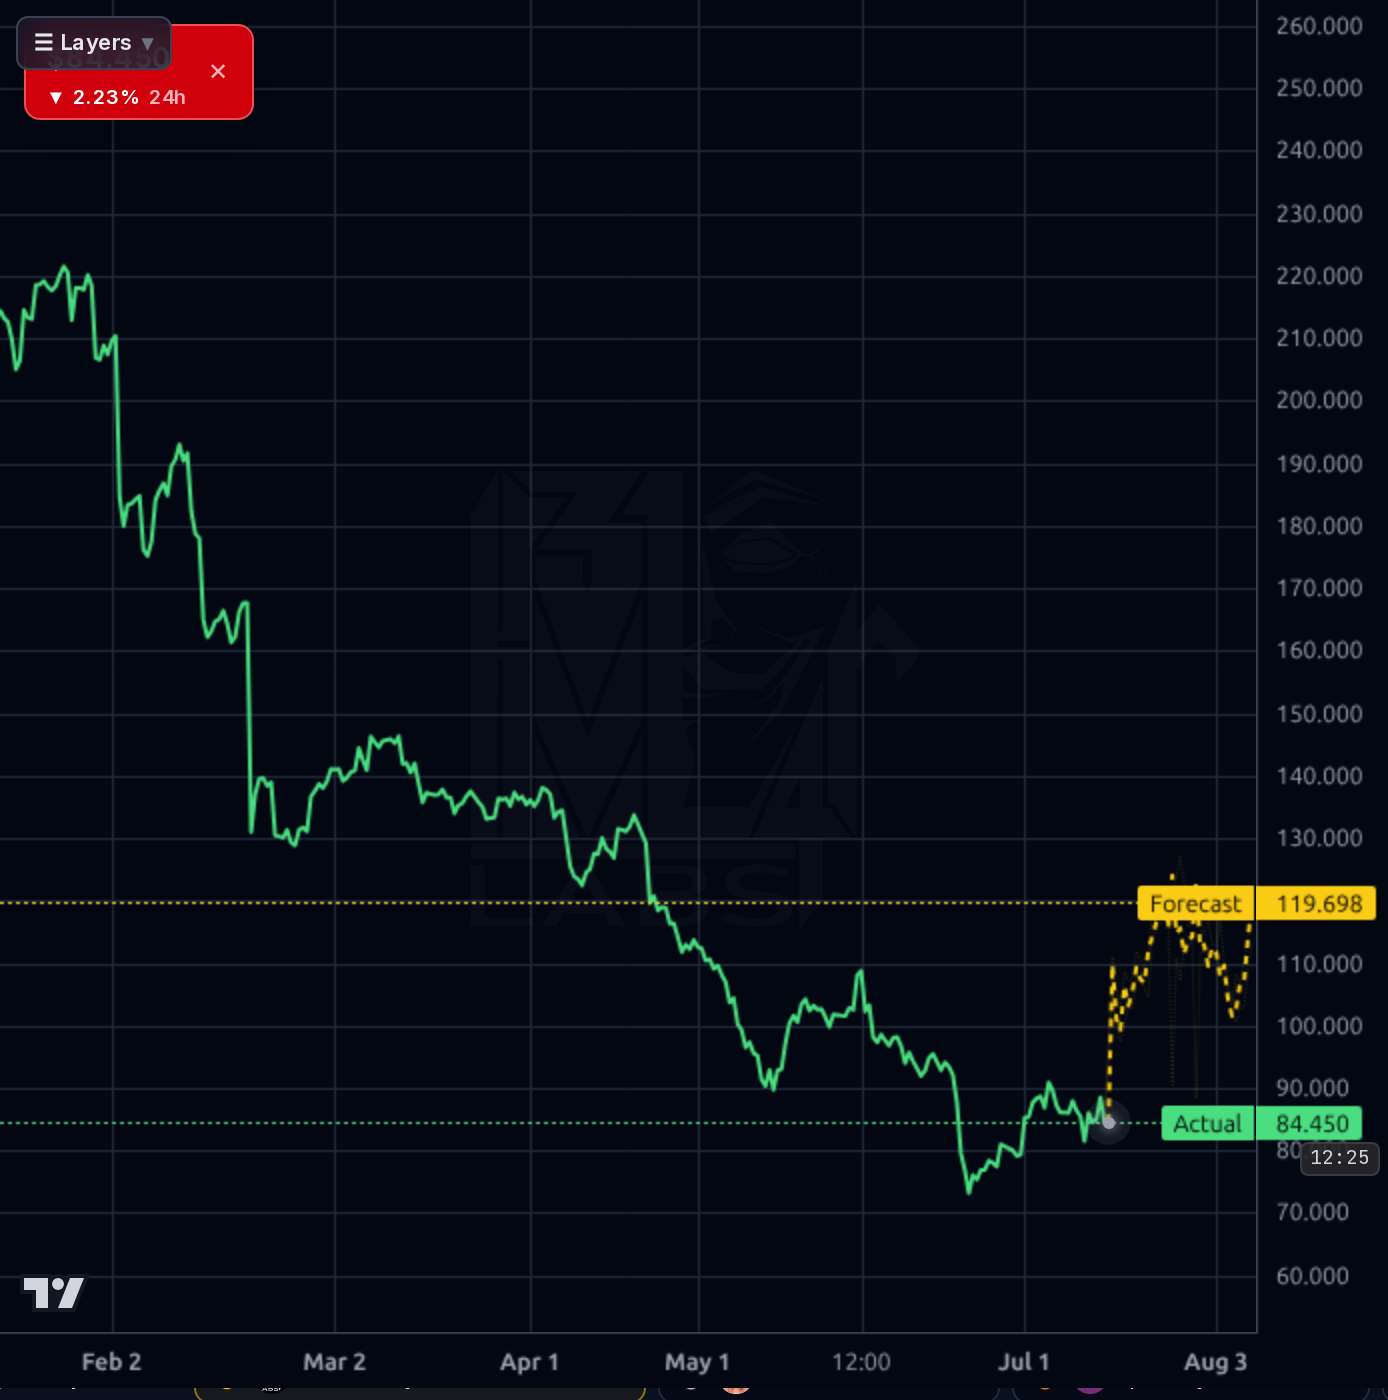
Do not size a swing into the August 6 print — this is a binary event with high IV crush risk. Tactically, $80 is the line in the sand; below it and $73 opens up. A starter/accumulate scale between $80-$85 is defensible given the 15% FCF yield and $20/sh cash cushion, but keep dry powder for a post-earnings reaction. Invalidation for even a modest tactical bounce is a daily close below $78. Resistance $92 caps any pre-earnings squeeze; the model's $113 1h target is not credible given realized accuracy.
The 1-6 month view is defined by the August print. Bull case ($105-$115): gross margin reclaims >28.5%, OCF prints firmly positive, forward guide holds — multiple re-rates to 8-9x fwd EPS. Base case ($90-$100): mixed print, margins stabilize but no clear reacceleration, stock grinds in a wide range as sell-side stops cutting. Bear case ($65-$73): margins compress further or guidance cut, structural narrative wins and the stock retests the June low. What changes my mind: two consecutive quarters of gross margin >28.5% with positive OCF would move me from ACCUMULATE to BUY; a second sequential gross margin decline below 27% moves me to TRIM.
The 1-3 year terminal question is whether EPAM's engineering talent and hyperscaler partnerships allow it to participate in AI-driven implementation spend, or whether client insourcing and GenAI code productivity permanently shrink the IT services TAM. If the former, EPAM at 6x forward EPS with $20/sh cash is a straightforward double-plus over 3 years. If the latter, forward EPS estimates need to come down materially and fair value is closer to book ($65). Biggest structural risk is not near-term margins — it's the terminal margin and growth rate assumption underlying that $14.15 forward EPS number.
Revenue is still growing (TTM $5.56B, +14.2% Y/Y; Q1'26 revenue $1.40B vs Q2'25 $1.35B), but the profitability trajectory is the problem: gross margin compressed from 30.1% in Q4'25 to 27.7% in Q1'26 and operating margin fell from 10.6% to 8.3% sequentially. Q1'26 operating cash flow flipped negative to -$36M vs +$283M in Q4'25 — a large swing worth watching, though partly seasonal (Q2'25 was also weak at +$53M). Balance sheet is a genuine fortress: $1.04B cash, $288M debt, D/E 0.08, current ratio 2.67, book value $65/sh, and TTM FCF ~$693M implies a ~15% FCF yield on the $4.4B market cap. TTM EPS $6.97 vs forward EPS $14.15 implies analysts still expect a large earnings recovery — the credibility of that forward number is the entire debate. Capital allocation is conservative (no dividend, modest buybacks); with the stock at 1.3x book and 0.79x sales, aggressive repurchases would be the highest-return use of that cash pile.
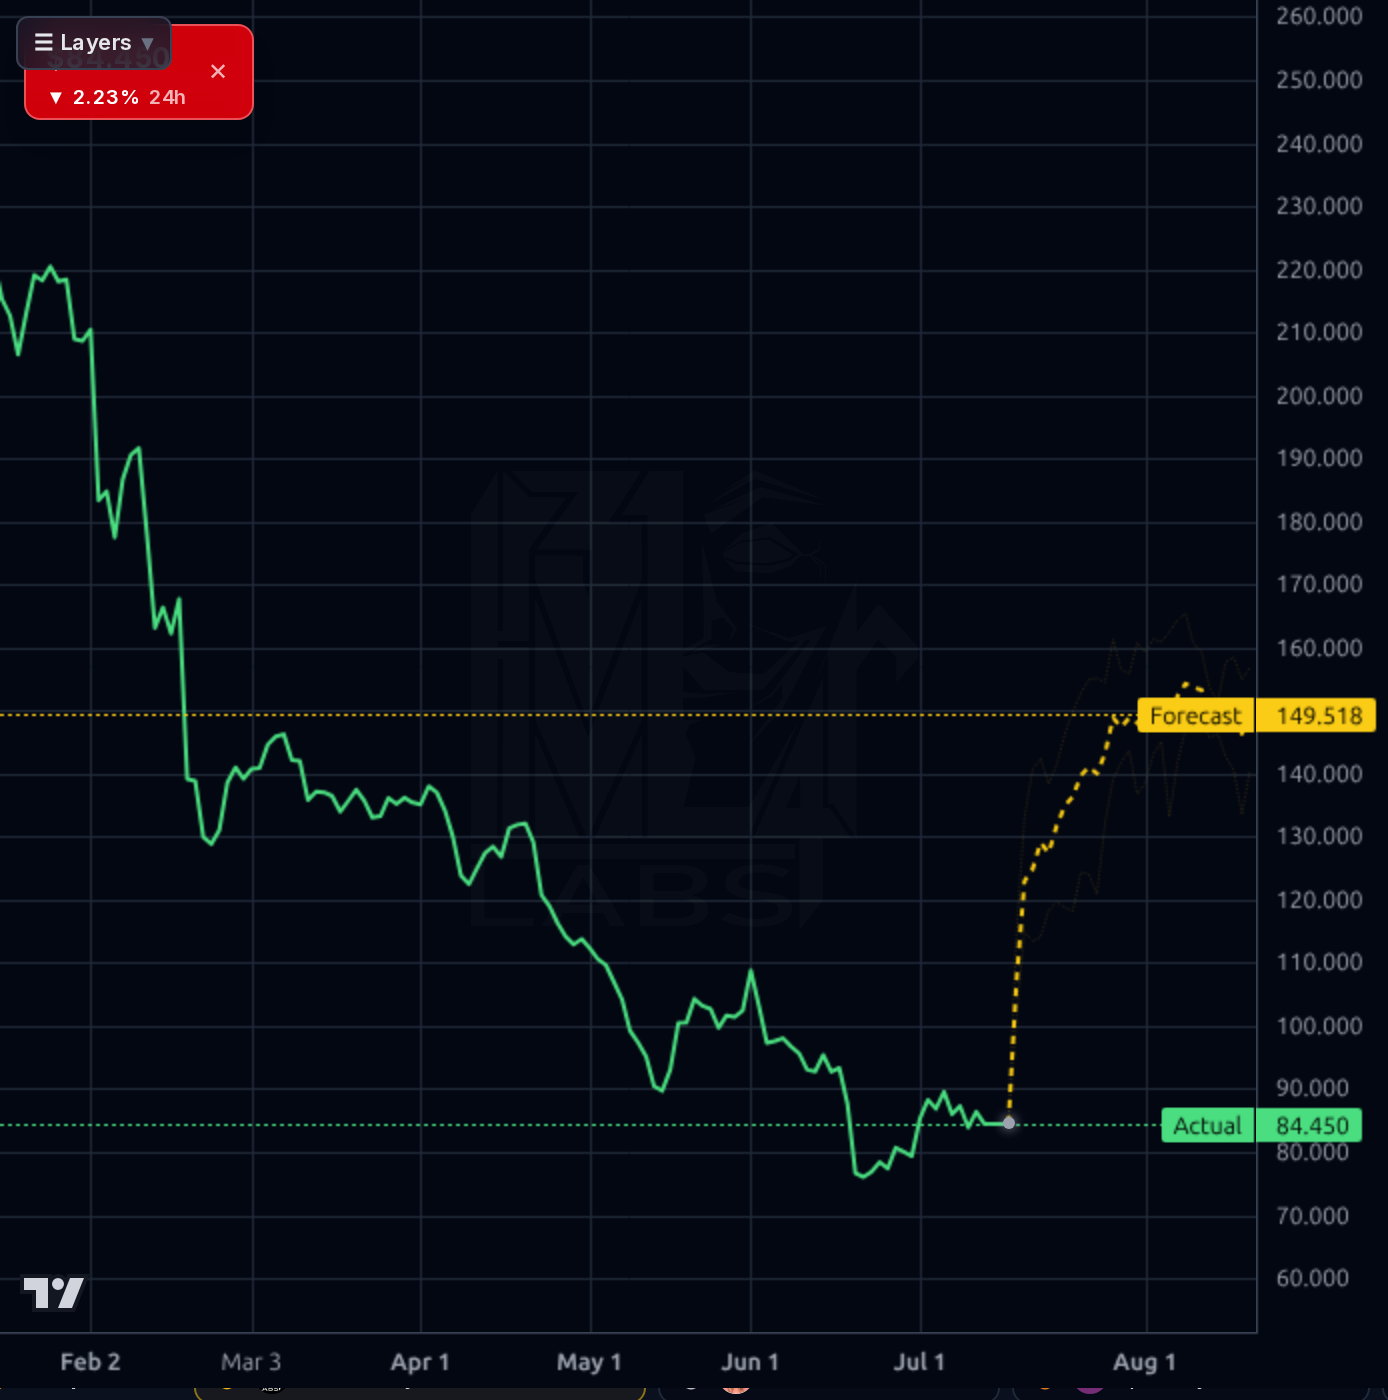
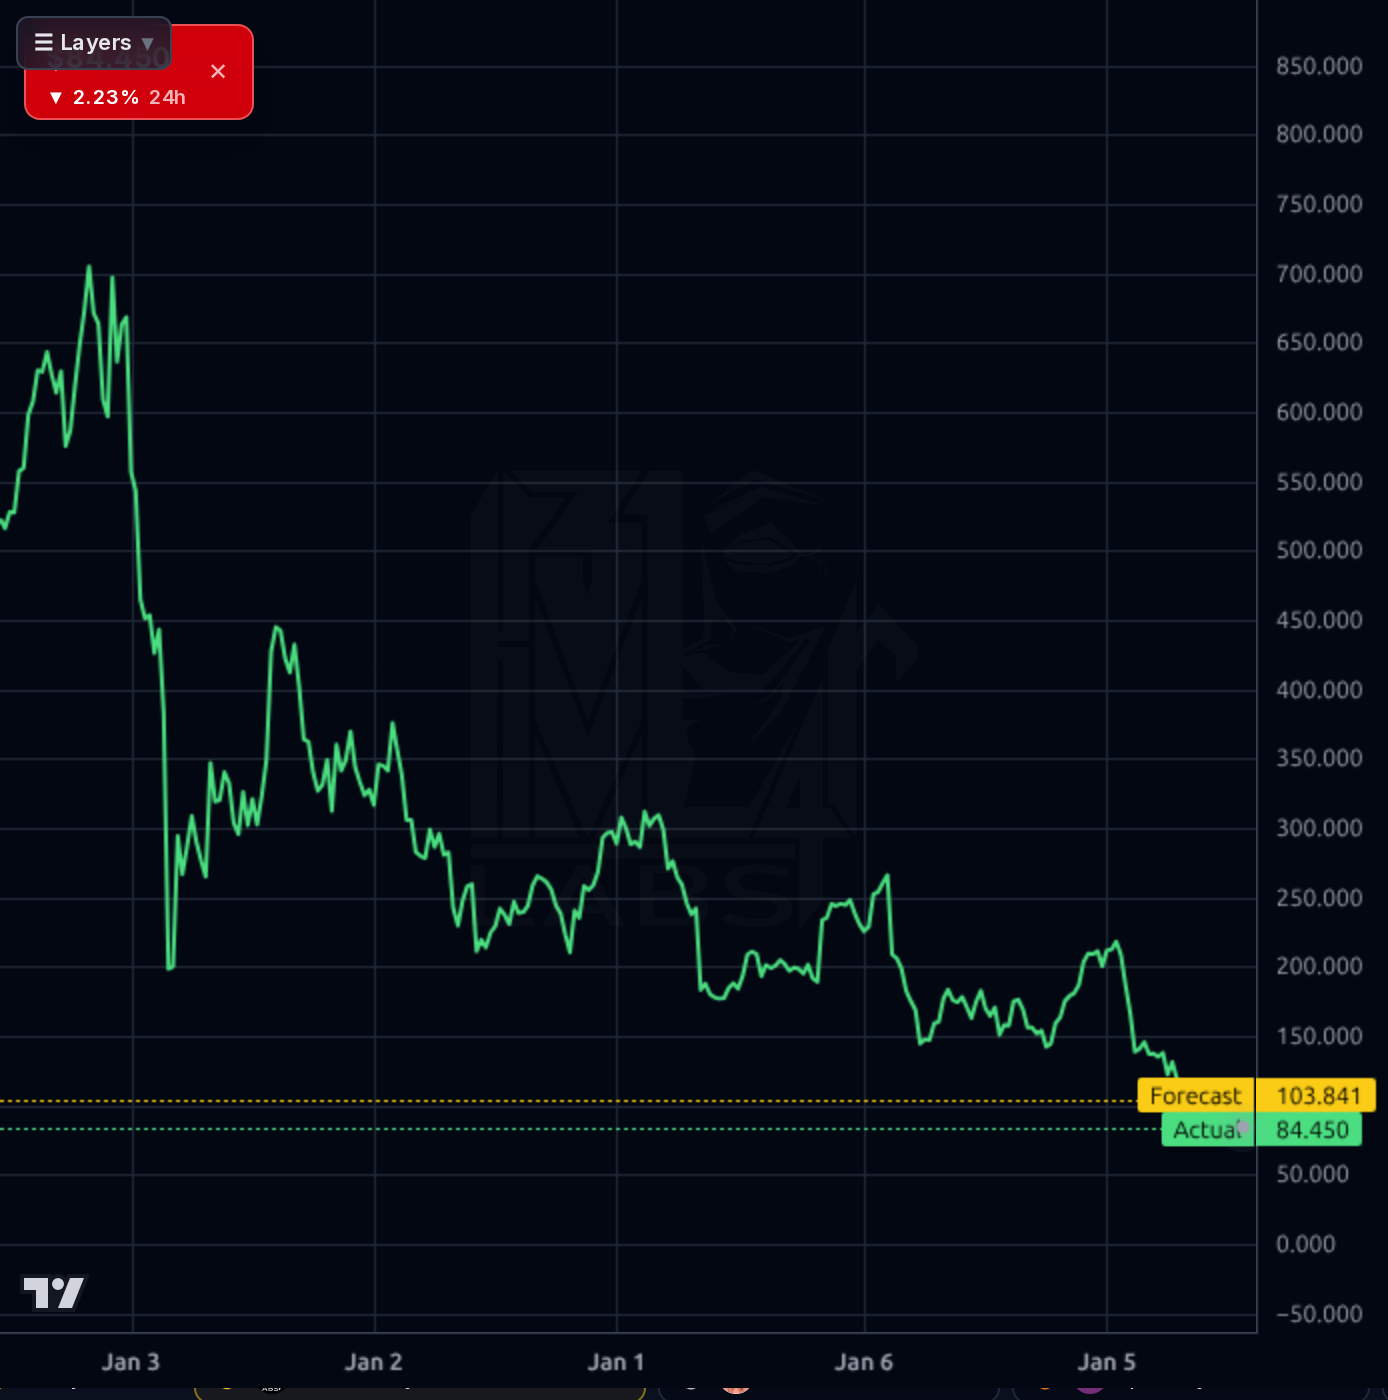
The tape is broken across every timeframe. The weekly shows a multi-year collapse from ~$700 to $84, -84% five-year performance and -43% below the 200-day. The daily shows the February 2026 gap-down from ~$165 to $130 and a continued grind lower into a June low near $73, then a weak bounce that is already rolling over (SMA50 -9.7%, RSI 44). The 1h chart shows price marking time in an $80-$92 range with today's -2.2% print sitting at $84.45, close to the lower end of that range. Overhead supply is heavy — every rally since February has been sold. The model's forecast bands are aggressively bullish (1h forecast $113, 4h $120, 1d $149), but realized directional accuracy is only 61% vs a 61% naive baseline with MAPE 65% on the 1d — that's noise, not signal, and prior bullish forecasts on this name have not printed. Key levels: support $80 then the $73 low; resistance $92, then the $105-$110 gap area, then $130.
Signal is negative and confirms the derating: Deutsche Bank cut its target to $85 (essentially at spot), Wells Fargo cut from $151 to $125, and TD Cowen cut from $170 to $131 — sell-side is being dragged down toward the price, not the other way around. StockStory flagged EPAM among oversold names that could bounce, and Zacks has run multiple value-screen pieces highlighting the cheapness, but none of that is a fundamental catalyst. The one L1 bullish shift is a +3.7pp uptick in reported institutional ownership over 45 days, which — combined with 22.4% short float and a 5.8 short ratio — sets up potential squeeze mechanics if the August print doesn't disappoint. Social sentiment is skewed bullish but is thin and low-quality, mostly promotional. Net: the fundamental narrative has not changed, but analyst targets are converging with reality, which removes some downside asymmetry from cuts alone.
- Reacceleration of higher-margin engagements in data/AI and cloud modernization — needs to be evidenced in the August 6 print via revenue mix commentary and gross margin recovery above 28%
- Buyback re-acceleration using the $1.04B cash pile at 1.3x book / 0.79x sales would be highly accretive and is management's clearest lever
- Hyperscaler co-sell partnerships (AWS/Azure/GCP) to position EPAM as an AI-implementation partner rather than a labor-arb vendor
- Client insourcing headwind stabilizing — evidenced by top-20 client revenue trends and utilization rates in the next print
- Short interest at 22.4% of float + 5.8 short ratio creates squeeze optionality on any positive surprise August 6
- August 6 binary earnings event: another sequential gross margin decline or negative OCF likely retests the $73 low
- Structural AI insourcing risk: if the IT services TAM is permanently compressed, the forward EPS of $14.15 is not achievable and the stock is not actually cheap
- Continued sell-side target cuts (three majors cut in the last week alone) reflect earnings estimates still drifting lower
- 22.4% short float is a two-way risk — squeeze potential on good news, but also confirms institutional conviction that fundamentals are still deteriorating
- Overhead supply is enormous — every rally since February has been sold, capping upside even in a good scenario
- Beta 1.41 in a market where AI-bubble concerns are being raised means EPAM will be sold hard in any broader tech drawdown
Get AI analysis on any stock
This is one of hundreds of Kronos AI reports — scored fundamentals & technicals, bull/base/bear price targets, a multi-horizon plan, and continuously-updated forecasts across the market. Create a free account to explore them all.
Create your free account →Already a member? Sign in · Join our Discord