EPAM — AI Stock Forecast & Price Targets
Published 8/12/2026 · A free sample of K3vl4r’s AI-powered analysis.
Kronos price forecasts, scored fundamentals & technicals, and a multi-horizon plan.
View the live EPAM price forecast →
EPAM trades at a trough ~7x forward P/E with a fortress balance sheet ($789M cash, D/E 0.04) after a clean Q2'26 EPS beat ($3.38 vs $3.16) offset by a lowered 2026 revenue guide reflecting North American softness. The tape has reflex-bounced from $73 to ~$99, reclaiming SMA20/50, but remains ~30% below SMA200 and ~55% below 52-wk highs — a base-building setup where valuation cushion and improving AI-native mix ($160M in Q2) are real, but a confirmed trend reversal still requires a stable Nov 5 print.
1-4 weeks: hold/accumulate on pullbacks into the $92–$95 zone; avoid chasing above $100 where SMA50 and round-number resistance overlap. Position sizing: half to two-thirds of intended long, keep dry powder. Invalidation is a daily close below $88 (breaks the post-earnings gap structure and reintroduces $73 retest risk). Upside stretch to $105 is achievable on tape strength; expect chop between $95–$102 in the absence of new catalysts.
1-6 months: base case ACCUMULATE toward a $108–$112 target as multiple compression reverses if Q3 delivers stable-to-better guidance and H2 OCF turns decisively positive. Expected return range: -15% (bear) to +25% (bull), with base ~+10%. Catalysts: Nov 5 earnings (thesis-defining), AI-native revenue run-rate toward the $600M 2026 target, and short-covering continuation. Change my mind: a second revenue guide cut, another quarter of negative OCF, or a break of $88 support would flip me to HOLD/TRIM.
1-3 years: terminal thesis is that EPAM re-rates from ~7x to a 10-12x forward P/E as AI-native services offset legacy engineering compression, driving a $130–$160 range on ~$14–$16 normalized EPS. Multi-year drivers: enterprise GenAI implementation demand, financial services vertical durability, OpenAI/Databricks partnership monetization, and buyback-driven share count reduction from the cash pile. Biggest structural risk: AI code-generation permanently compresses labor-arbitrage IT services pricing/volume, in which case the 'cheap' multiple is a value trap and normalized EPS re-bases lower — this is the single question that matters, and the current data does not resolve it.
Revenue trajectory is stabilizing but not accelerating: Q2'26 came in at $1.415B (+4.5% YoY) at the high end of guidance, yet management trimmed full-year 2026 revenue to 3.2–4.2% growth citing North American software services weakness — the second-order tell that top-line demand is not fully healed. Margins are the bright spot: gross margin recovered to 30.4% (vs 27.7% in Q1), operating margin expanded to 10.8% (+150bps YoY), and full-year non-GAAP EPS guidance was raised to $13.08–$13.24 (above ~$13.04 consensus), driving a very cheap ~7.1x forward P/E and 6.3x EV/EBITDA. Balance sheet is a fortress — $789M cash vs $152M debt, D/E 0.04, current ratio 2.75, book value $68/sh — giving substantial downside cushion and buyback optionality. The material yellow flag is cash flow quality: H1'26 operating cash flow was negative (Q1 -$36M, Q2 -$2M) versus $283M+ per quarter in H2'25, which management attributes to timing but must decisively reverse to validate the ~10.7x P/FCF valuation. Capital allocation appears buyback-heavy (share count and cash drawdown from $1.30B to $789M over three quarters). Net: quality is intact, profitability is inflecting up, but the growth-vs-guidance tension is the swing factor.
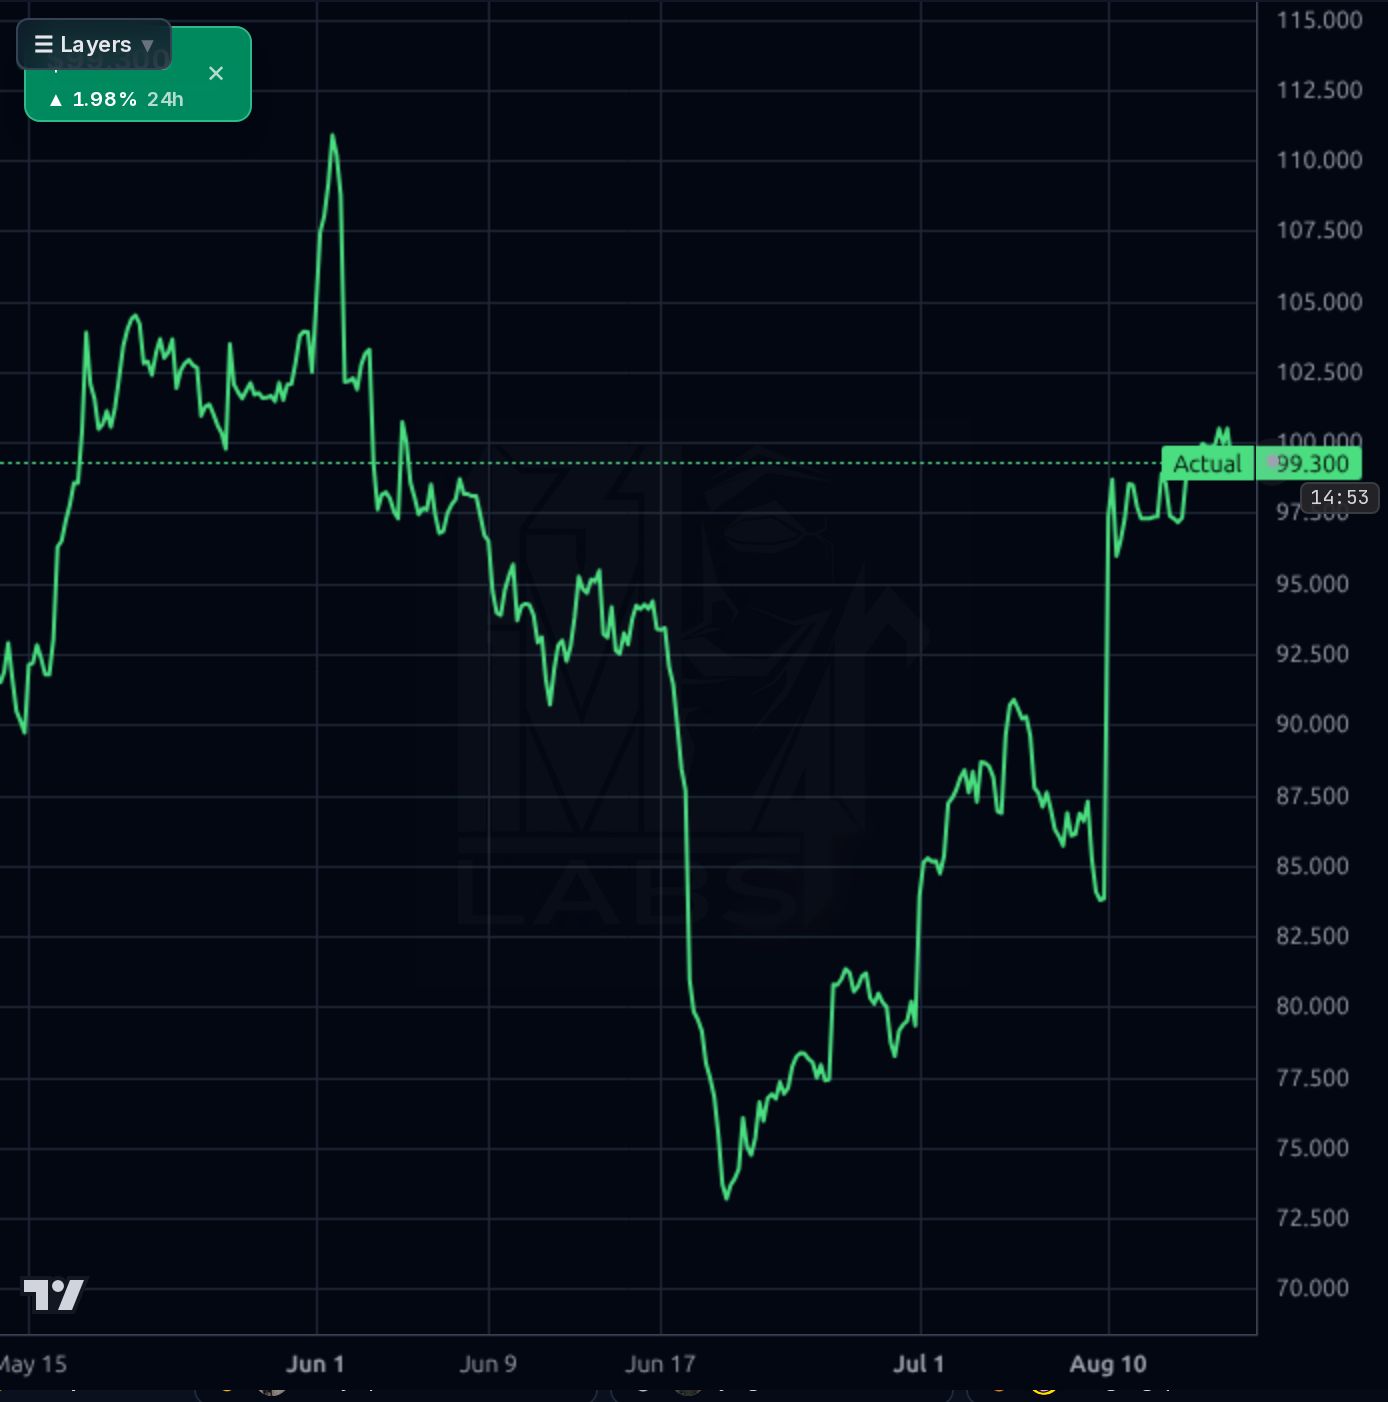
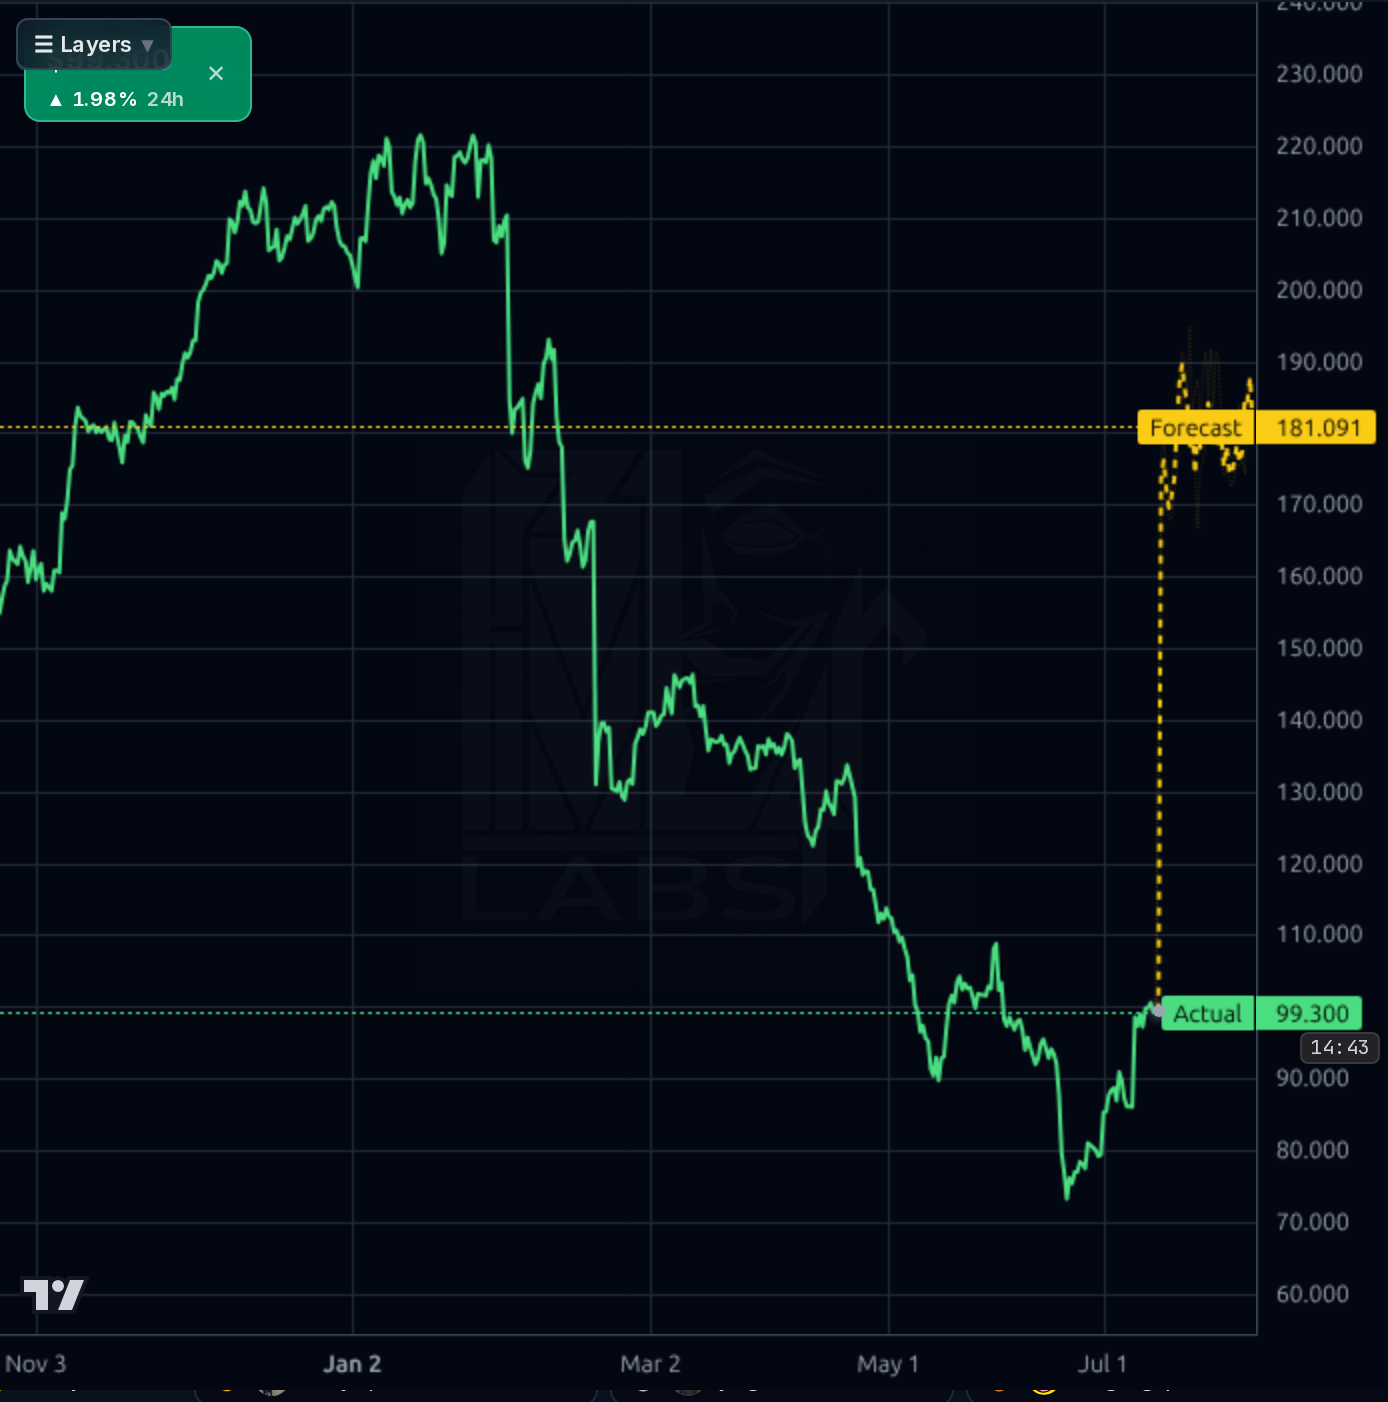
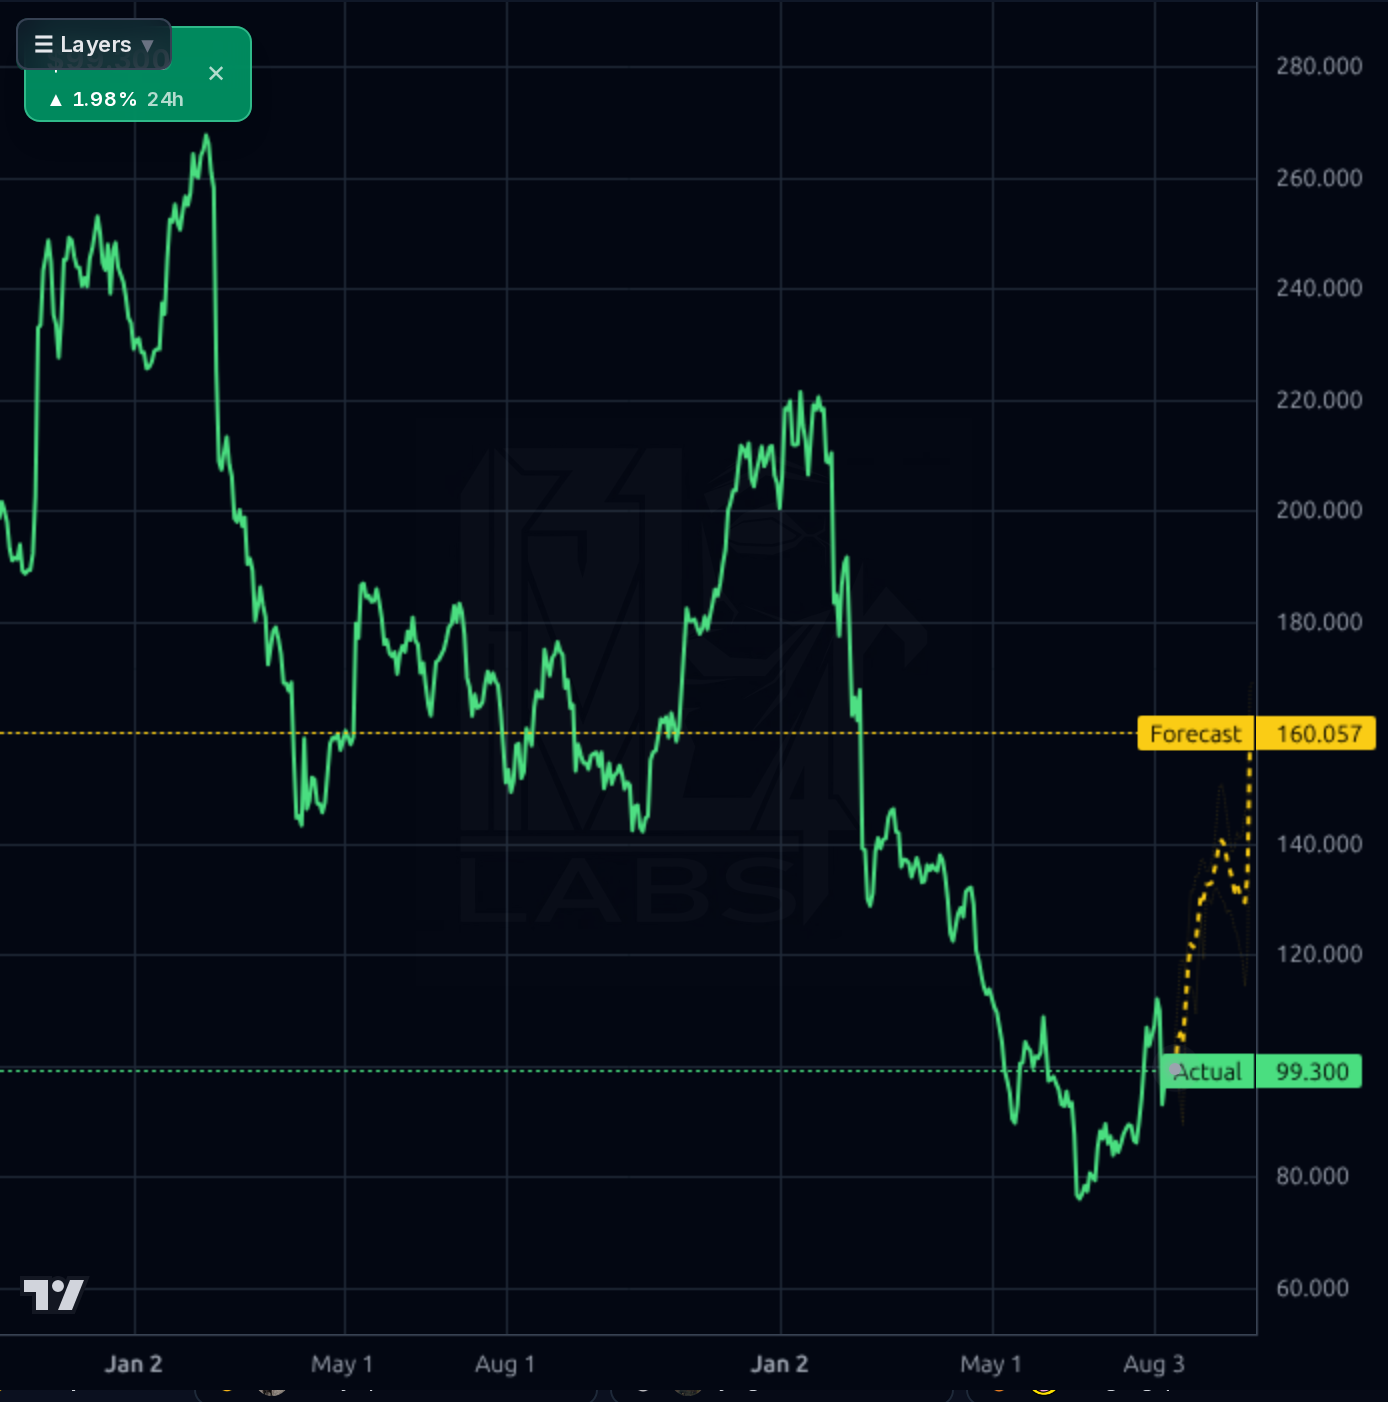
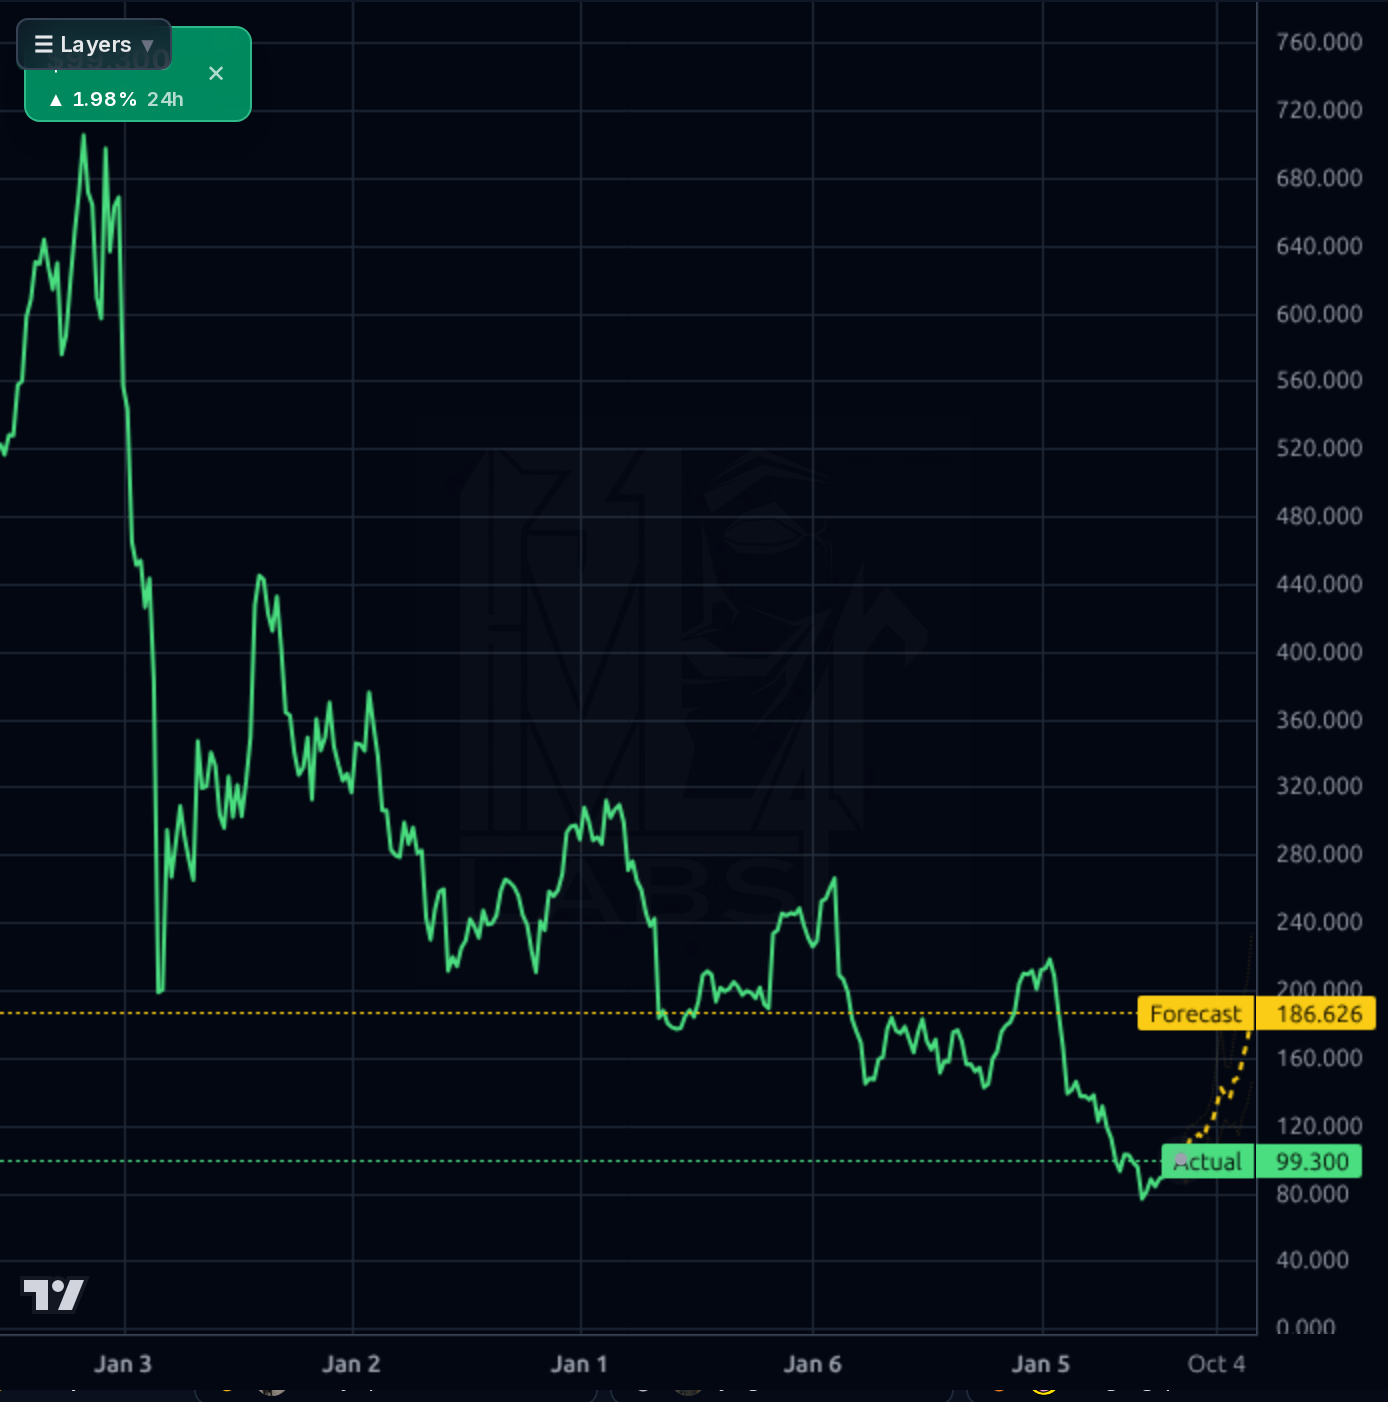
Across timeframes the picture is 'oversold reflex within a longer downtrend.' The 1-week chart shows a multi-year collapse from ~$700 to a $73 low with price now curling up from the bottom — clearly base-building, not a confirmed reversal. The 1-day chart confirms EPAM is up ~36% off the June low, reclaiming SMA20 (+3.5%) and SMA50 (+8.9%) but sitting -30.4% below SMA200 — the primary trend has not turned. The 1-hour chart shows a clean post-earnings gap from ~$84 to ~$97 followed by consolidation between $97–$100, with $99–$100 acting as immediate resistance (SMA50 confluence and round number) and $92–$94 as first support, then $84 as the gap fill / structural pivot. RSI at 54 is neutral with room to run. The forecast band leans constructive across timeframes (bullish_prob 1.00), but the 1d model has been beaten by the naive baseline (75% vs 78%) with 30% MAPE — discount that horizon; the 1-week forecast is more reliable (83% directional accuracy, 12% MAPE) and points to a mild continuation higher. Key line in the sand: $110 has repeatedly capped bull cases in prior calls; a decisive weekly close above $105 would be the first real trend-change signal. Below $92 opens $84 gap fill.
The dominant signal is the Aug 6 Q2'26 print: revenue $1.41B (beat), EPS $3.38 (beat by $0.22), operating margin +150bps YoY, AI-native revenue at $160M — all constructive — but full-year 2026 revenue guide was cut on North American software services softness, prompting sell-side price target reductions (JPMorgan $142→$120, TD Cowen $131→$120, Guggenheim $165→$140). The market took the print net-positive (stock up ~5% post-earnings, +15.6% over the past month), suggesting the EPS beat, margin trajectory, and cheap valuation are being weighed above the revenue cut. Fundamental-change signals reinforce this: short float compressed from 22.4% → 16.4% (crowd covering), institutional ownership rose ~3.7pp on one read, though the analyst PT cluster stepped down ~5.8%. The Nov 5 Q3 print is the next binary — a second guide cut would break the 'one-time reset' narrative; confirmation stabilizes the base. Social sentiment is one-sidedly bullish, which is a mild contrarian caution.
- AI-native revenue at $160M in Q2'26, tracking toward stated $600M 2026 full-year target — the primary growth vector
- Full-year non-GAAP EPS guide raised to $13.08–$13.24 midpoint vs $13.04 consensus, reflecting operating leverage inflection
- Q2 operating margin +150bps YoY to 10.8% — margin recovery running ahead of revenue recovery
- OpenAI and Databricks partnership channels position EPAM in enterprise GenAI delivery
- $789M cash / D/E 0.04 supports continued buyback pace (share count reduction is an EPS tailwind independent of growth)
- Financial services vertical stability provides base-load offsetting volatile software/tech vertical demand
- Second revenue guide cut at Nov 5 print would break the 'one-time reset' narrative and reprice the stock lower
- H1'26 cumulative operating cash flow is negative (~-$39M) versus $283M+ per quarter in H2'25 — must decisively reverse
- Structural AI code-generation risk to core engineering services labor model — the existential thesis question
- North American demand softness (largest market) called out explicitly in guide cut; macro deterioration would compound
- Sell-side price targets clustered down to $120 area — likely ceiling until revenue inflection is proven
- Stock remains -30% below SMA200 and -55% below 52-wk high — primary trend not yet confirmed reversed
- Short interest 16.4% and 4.03 days-to-cover — squeeze potential cuts both ways on catalysts
- Social crowd 100% bullish is a mild contrarian yellow flag at these levels
Get AI analysis on any stock
This is one of hundreds of Kronos AI reports — scored fundamentals & technicals, bull/base/bear price targets, a multi-horizon plan, and continuously-updated forecasts across the market. Create a free account to explore them all.
Create your free account →Already a member? Sign in · Join our Discord