EPAM — AI Stock Forecast & Price Targets
Published 7/24/2026 · A free sample of K3vl4r’s AI-powered analysis.
Kronos price forecasts, scored fundamentals & technicals, and a multi-horizon plan.
View the live EPAM price forecast →
EPAM is a deep-value IT services franchise trading at ~6.1x forward P/E with a fortress balance sheet ($1.04B cash, D/E 0.08), basing in the low-$80s ahead of a binary August 6 earnings print that must reverse Q1'26 gross margin compression (27.7%) and negative operating cash flow (-$36M). The near-term risk/reward is symmetric and event-driven: a GM recovery toward 29-30% opens the door to $100-$115 with 22% short float as fuel, while another miss likely breaks $80 with air to the $73 52-week low. Best posture is a patient HOLD into the print — the setup has offered no edge for weeks and pre-earnings sizing is not warranted.
HOLD, no new size. The August 6 earnings print (13 days out) is a binary event with a stated consensus of $3.14 EPS and 22.4% short float that cuts both ways. The stock has ground sideways in $84-$92 for weeks — front-running the print has consistently offered no edge in prior calls. Key levels: $92 must be reclaimed to signal accumulation, $80 is the technical invalidation line, and a close below $78 opens the $73 low with an air pocket beneath. Do not size a swing trade through the print; if held, treat as a small speculative position. Options market will show IV crush post-print — no hedging recommended given the 22% short float squeeze risk if the print is positive.
1-6 month view is entirely a function of the August 6 outcome. Bull case (GM recovery to 29-30%, OCF normalization, unchanged or raised guide): expect a re-rate toward $105-$120 as short covering compounds a fundamentals-driven bid, and sell-side PT restoration follows. Base case (in-line print with muddled guide): grind back to $92-$100 range as the near-term binary is removed but structural questions linger. Bear case (another GM miss, cut guide, no OCF reversal): break $80, retest $73, and the structural TAM-erosion narrative dominates for two quarters. What would change my mind: a decisive Q2 OCF print above $200M with GM back at 29%+ would flip me to ACCUMULATE toward the $115 target; a second consecutive OCF miss with GM below 27% would flip to TRIM/AVOID.
Terminal thesis rests on whether EPAM successfully repositions from labor-arbitrage IT services to an AI-native delivery model where 250 engineering Black Belts and platforms like AI/RUN capture pricing power on top of a leaner cost base. The Anthropic partnership and Databricks SI Partner of the Year are proof points but must scale from $125M pure-AI to a meaningful share of the $5.56B base to justify a re-rate. Biggest structural risk: GenAI-enabled client insourcing compresses TAM faster than EPAM's AI-native pivot can capture margin — this is the multi-year thesis breaker and the reason the stock trades at 6x forward P/E despite growing revenue. At current valuation the risk/reward is favorable if management can prove the Q1 margin compression was cyclical, but this is a show-me story that will take 2-3 quarters of consistent execution to re-rate meaningfully.
The top line remains resilient — TTM revenue $5.56B (+14.2% Y/Y) with Q1'26 at $1.40B (+7.6% Y/Y) — showing that demand for EPAM's engineering services has not collapsed despite headline fears of GenAI-driven insourcing. The problem is quality of earnings: Q1'26 gross margin compressed to 27.7% (vs 30.1% in Q4'25 and 29.1% run-rate), operating margin fell to 8.3%, and operating cash flow flipped to -$36M from +$283M the prior quarter, with FCF at -$54M. Whether this is working-capital timing or structural pricing pressure is the entire debate. The balance sheet remains a genuine differentiator — $1.04B cash, only $288M debt, D/E 0.08, current ratio 2.67, book value $65/share — and TTM FCF of $693M funded aggressive $264M Q1 buybacks. Valuation is at trough levels (12.4x TTM, 6.1x forward P/E, 0.68x EV/Sales, PEG 0.58, P/FCF 8.3x) that already price in significant thesis damage. Analyst recom of 1.86 with $135.94 target implies +58% upside but sell-side has been cutting (DB $85, WFC $125, TDC $131), signaling eroding conviction on magnitude even as ratings hold.
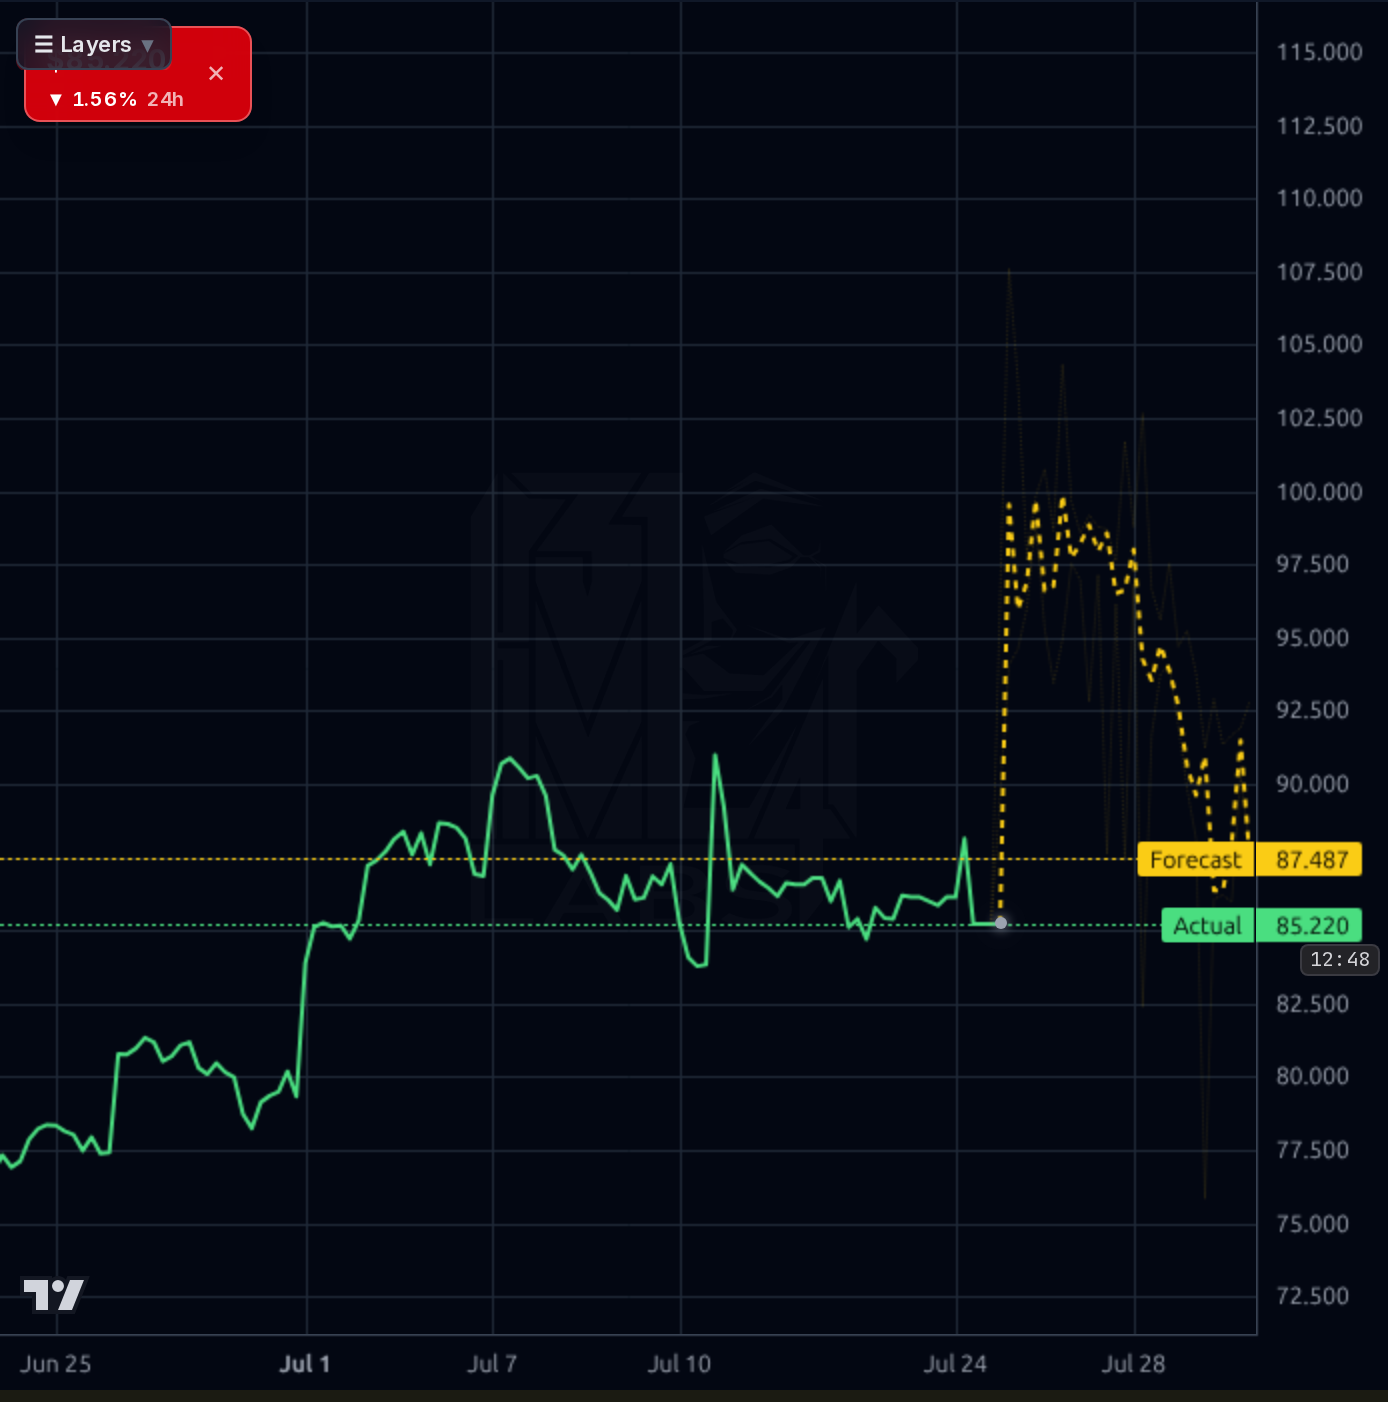
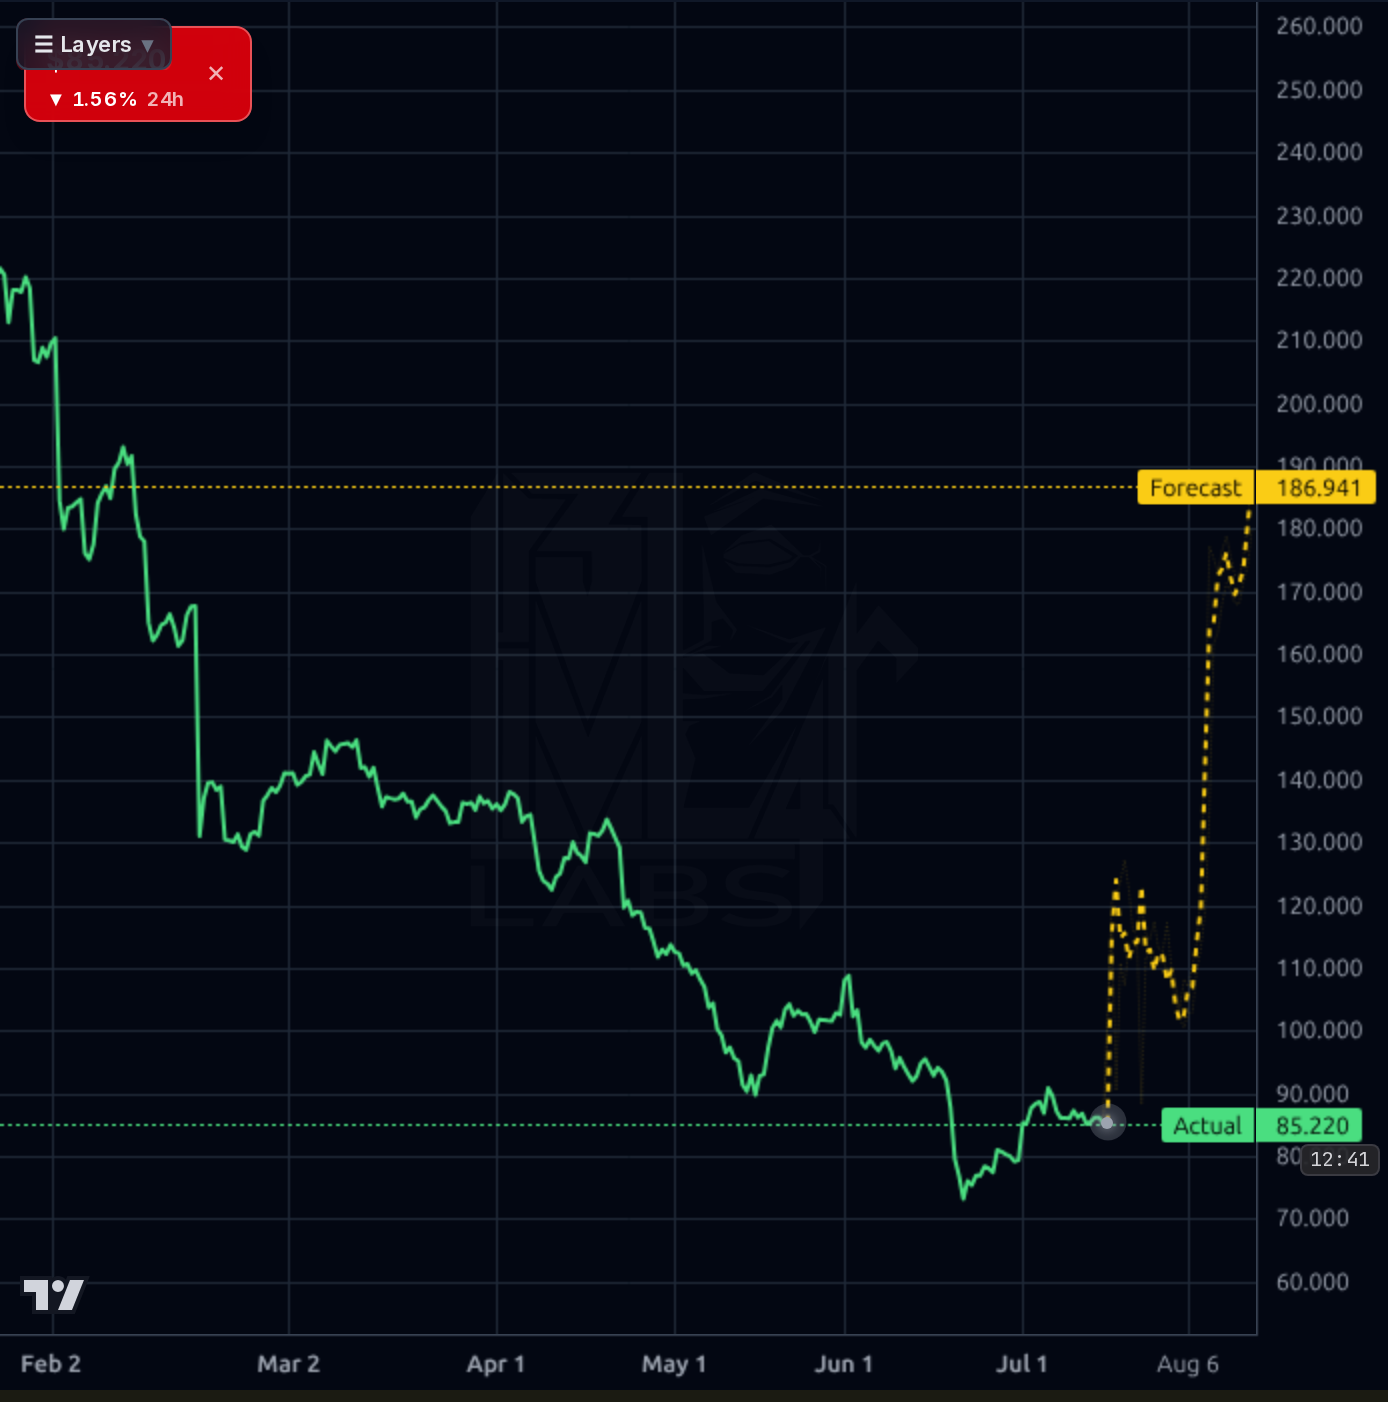
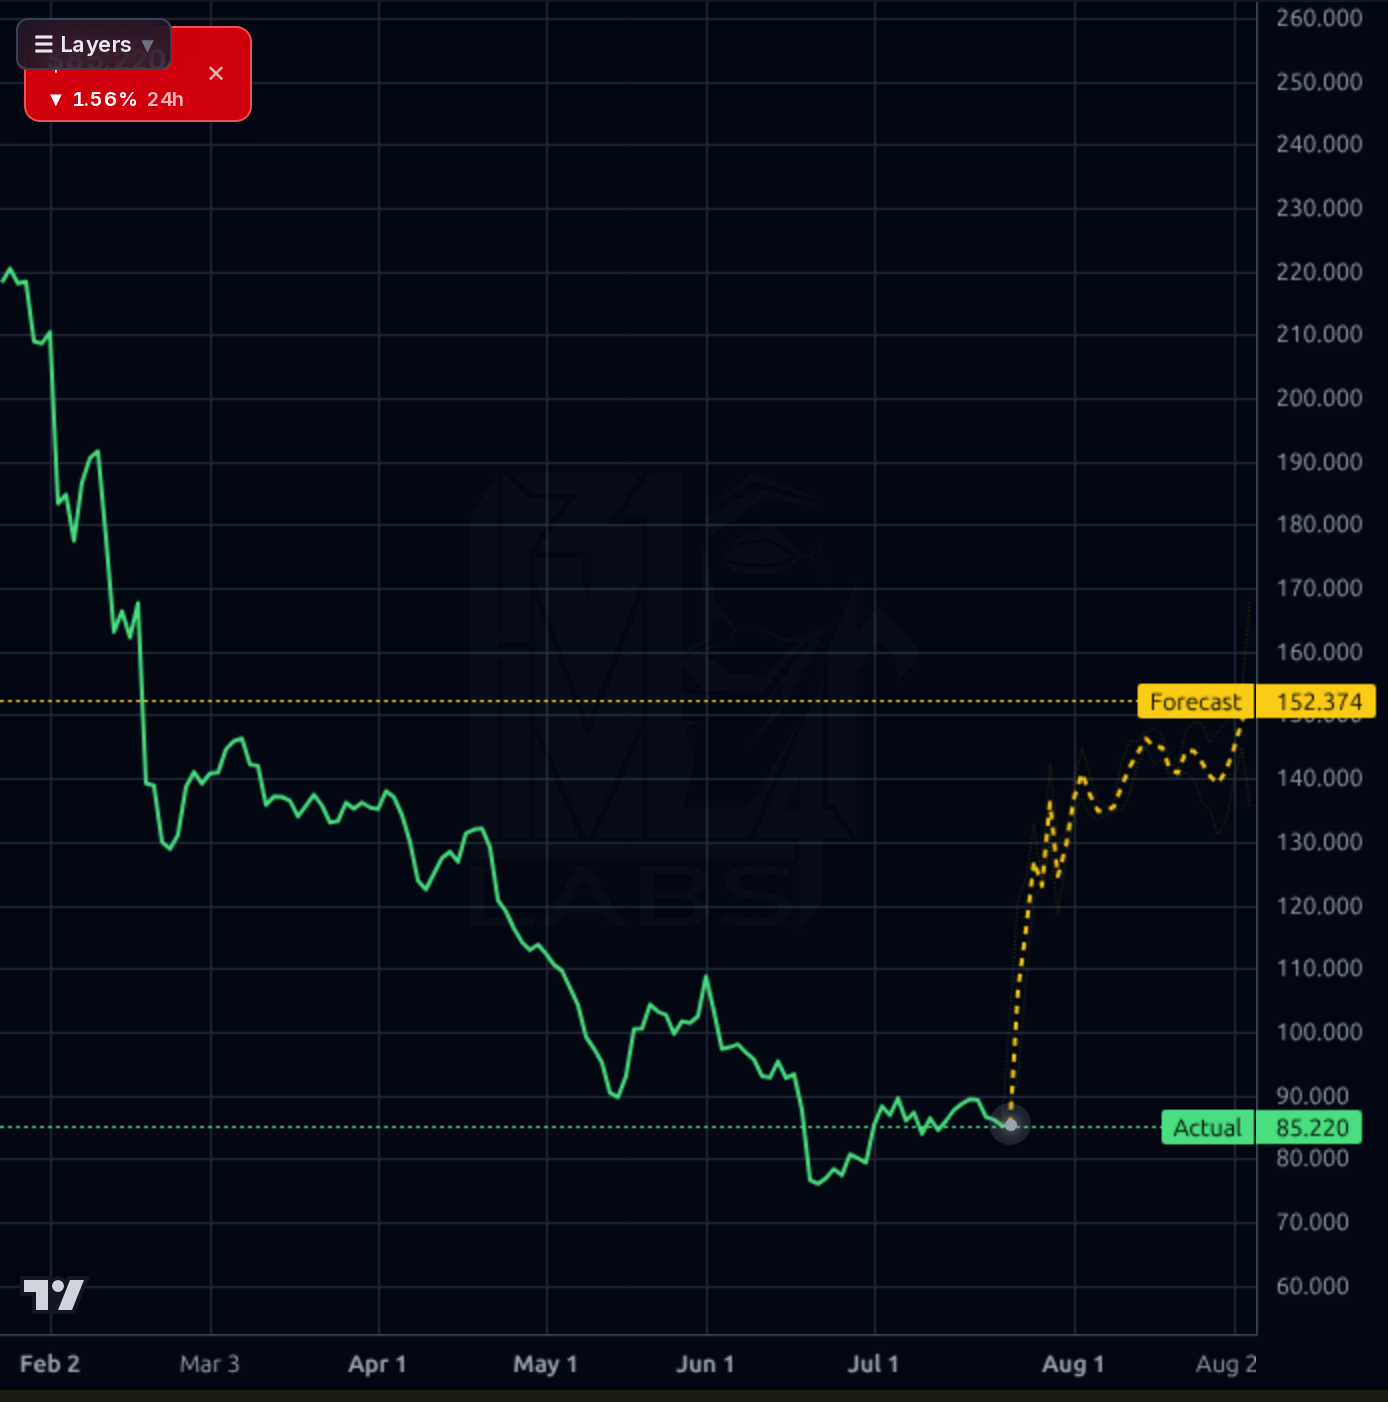
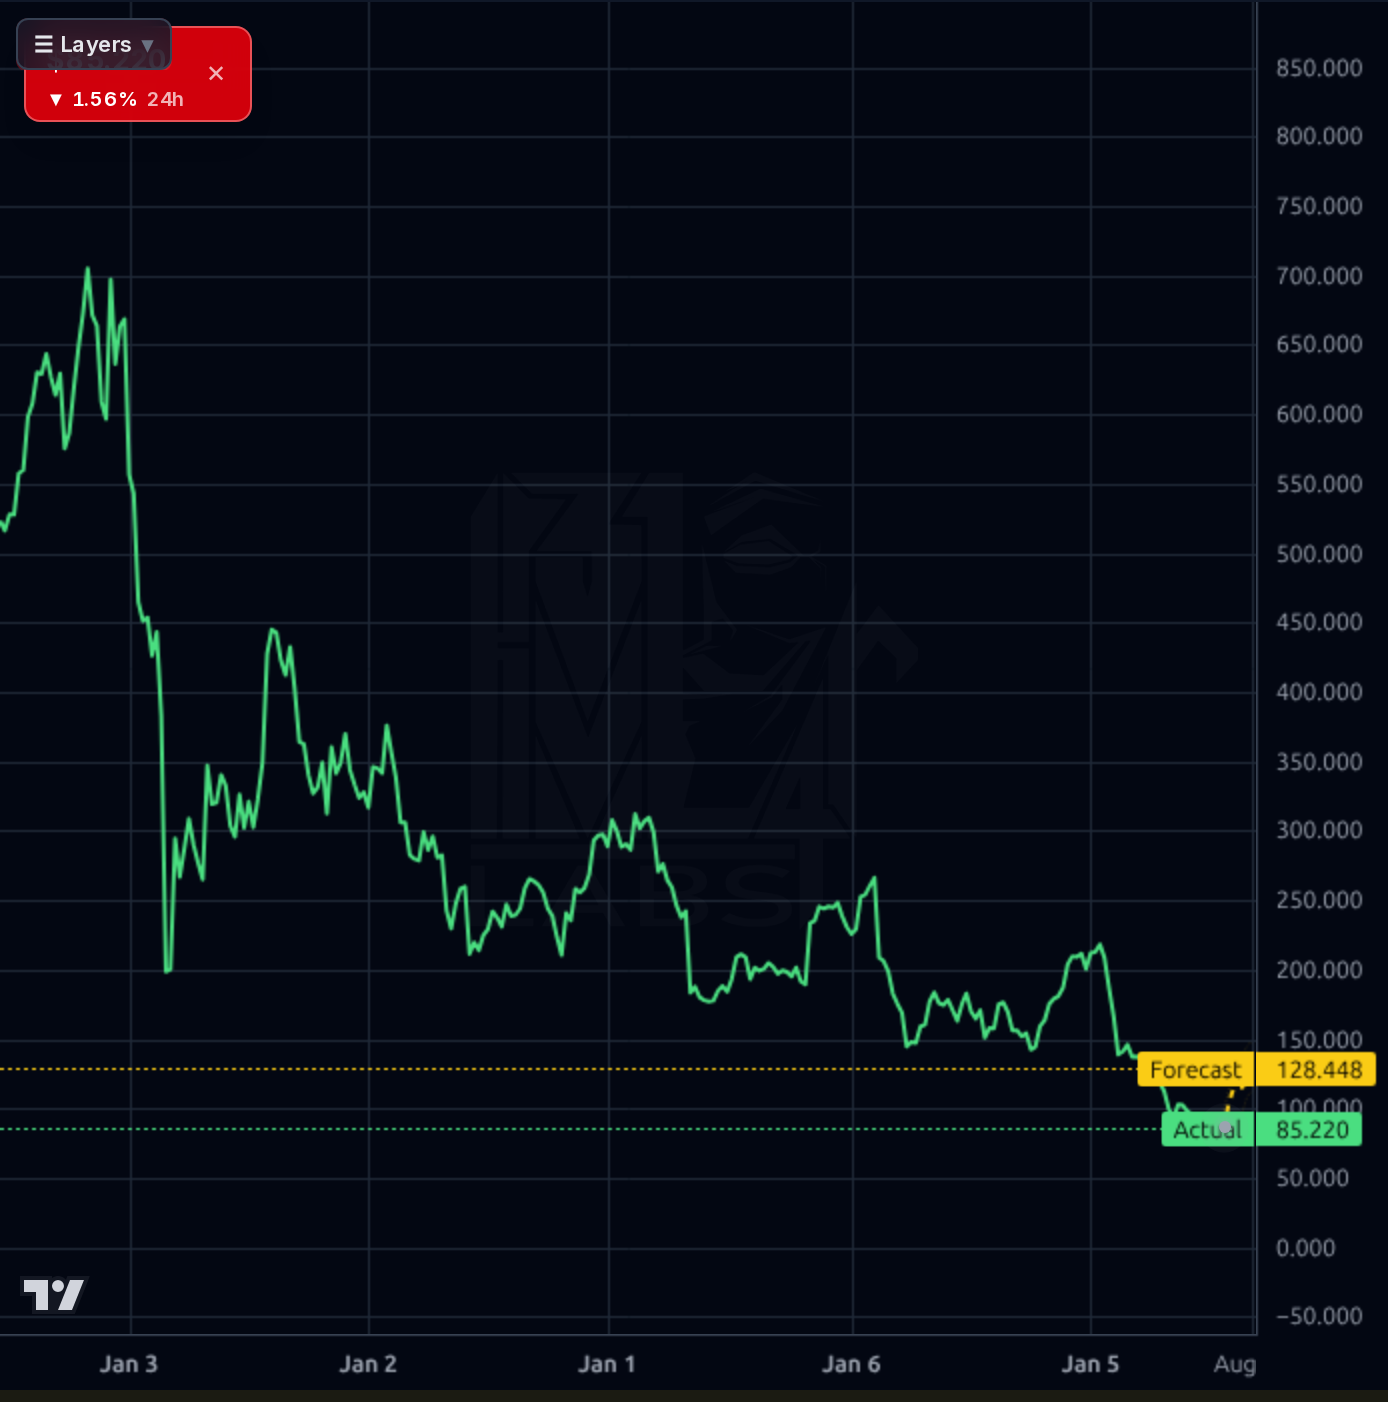
The multi-timeframe picture is one of a broken longer-term trend attempting to base. On the weekly, EPAM has fallen from $700+ to $85, and price sits -41% below SMA200 with -58% YTD and -84% from 5-year highs — this is a wounded stock. The daily and 4-hour show the classic post-capitulation basing pattern in the $80-$92 range since early July, with the July 24 close at $85.22 down 1.56% on the day. RSI at 46 is neutral, price is +0.8% vs SMA20 but -5.4% vs SMA50, and the 52-week range ($73.06-$222.53) shows how far the derating has gone. The 1-hour chart shows a bearish daily reversal off the $92 test with sellers reasserting into the print. The model's forecast is aggressively bullish across all horizons (1wk band $87-$100, 1mo $87-$186, quarterly $128), but the calibration data explicitly flags 1d as sub-baseline (69% vs 72% naive) and long-horizon MAPEs of 50-80% — only the 1wk band (83% acc, 4% MAPE) deserves weight, and it points to modest reversion to $87-$100. Key levels: $80 as the credible floor (tested multiple times, invalidation on close below), $92 as the immediate resistance to reclaim, then $100/$115 as post-earnings squeeze targets if the print delivers.
The dominant signal in the news flow is sell-side capitulation on price targets even as ratings remain constructive: Deutsche Bank cut to $85 (7/10), Wells Fargo trimmed to $125 while maintaining Overweight (7/10), and TD Cowen cut to $131 while keeping Buy (7/9). This pattern — ratings held but magnitude expectations reset lower — is textbook derating-not-abandonment and typically precedes either a reflexive bounce on any positive surprise or a final capitulation on a miss. Zacks flagged EPAM as a likely earnings beat candidate and as an undervalued name (7/8, 7/20). The Anthropic multiyear partnership and Databricks 2026 SI Partner of the Year award provide narrative support for the AI-native pivot but have not translated into visible P&L uplift yet ($125M pure-AI revenue is <3% of total). Broader market news (crypto, rates) is noise for this name. Retail sentiment on stocktwits is uniformly bullish but shallow and unhelpful as anything but a mild contrarian tell.
- Anthropic multiyear partnership announced May 2026 to accelerate enterprise-grade AI delivery, backed by 250 engineering Black Belts and 10,000 cloud-certified architects
- Pure-AI revenue of $125M with double-digit sequential growth — needs to become a disclosed segment to move the equity story
- AI/RUN platform and Empathy Lab as internal IP investments to operationalize agentic AI delivery at scale
- 2026 Databricks Consulting & Systems Integrator AI Partner of the Year — validates data/AI positioning with a key ecosystem partner
- Aggressive capital return via $264M Q1'26 buyback against $1.04B cash — potential for accelerated repurchase at trough valuation
- August 6 Q2'26 earnings as the near-term inflection: consensus $3.14 EPS, requires GM recovery toward 29-30% and positive OCF swing to validate cyclical bull case
- Binary August 6 earnings print with 22.4% short float — cascade risk to $73 on a miss, squeeze potential to $110+ on a beat
- Q1'26 gross margin compression to 27.7% and -$36M operating cash flow are unresolved — could indicate structural pricing pressure rather than timing
- GenAI-enabled client insourcing is the multi-year TAM erosion thesis; if realized, EPAM's revenue base compounds down not up
- Sell-side PT cuts (DB $85, WFC $125, TDC $131) signal eroding conviction on magnitude even as ratings hold
- Broken longer-term technical trend — SMA200 -41%, YTD -58%, -84% from 5-year high — requires sustained repair not just a bounce
- Reduced full-year guidance (4-6.5% growth) reflects softer North American discretionary demand and macro caution
- Beta 1.43 with SPY in late markup/distribution and deteriorating breadth amplifies downside if broader risk-off develops
- Cash flow quality is now inconsistent quarter-to-quarter — needs Q2 to confirm whether Q1 was timing or structural
Get AI analysis on any stock
This is one of hundreds of Kronos AI reports — scored fundamentals & technicals, bull/base/bear price targets, a multi-horizon plan, and continuously-updated forecasts across the market. Create a free account to explore them all.
Create your free account →Already a member? Sign in · Join our Discord