
EQT— AI Stock Forecast & Price Targets
Published 6/14/2026 · A free sample of K3vl4r’s AI-powered analysis.
Kronos price forecasts, scored fundamentals & technicals, and a multi-horizon plan.
View the live EQT price forecast →
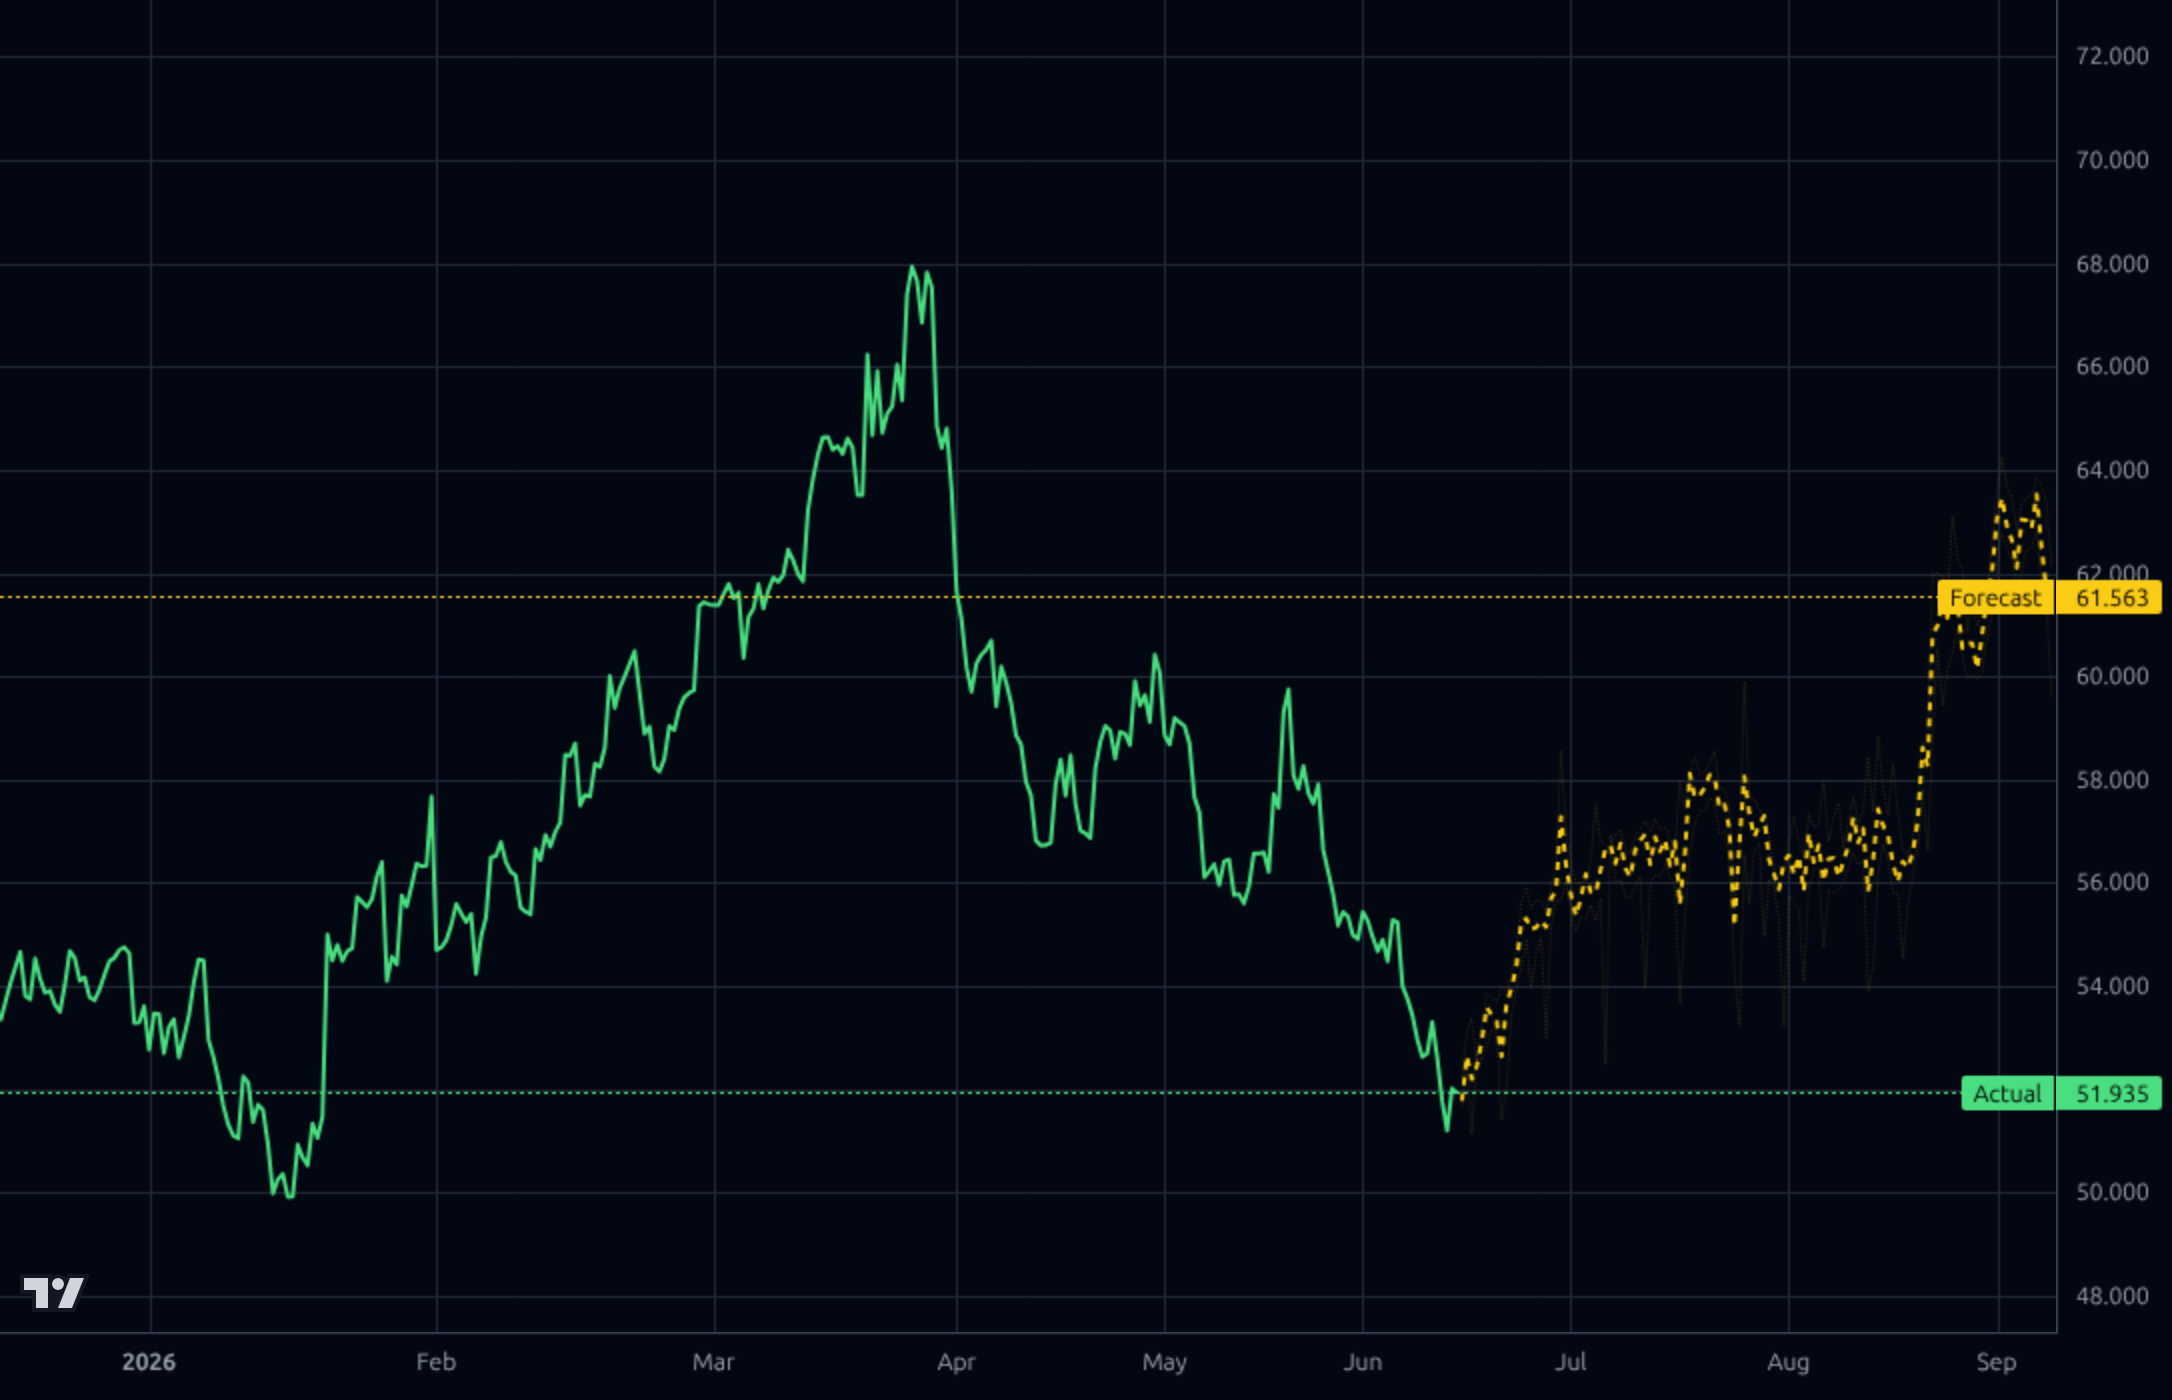
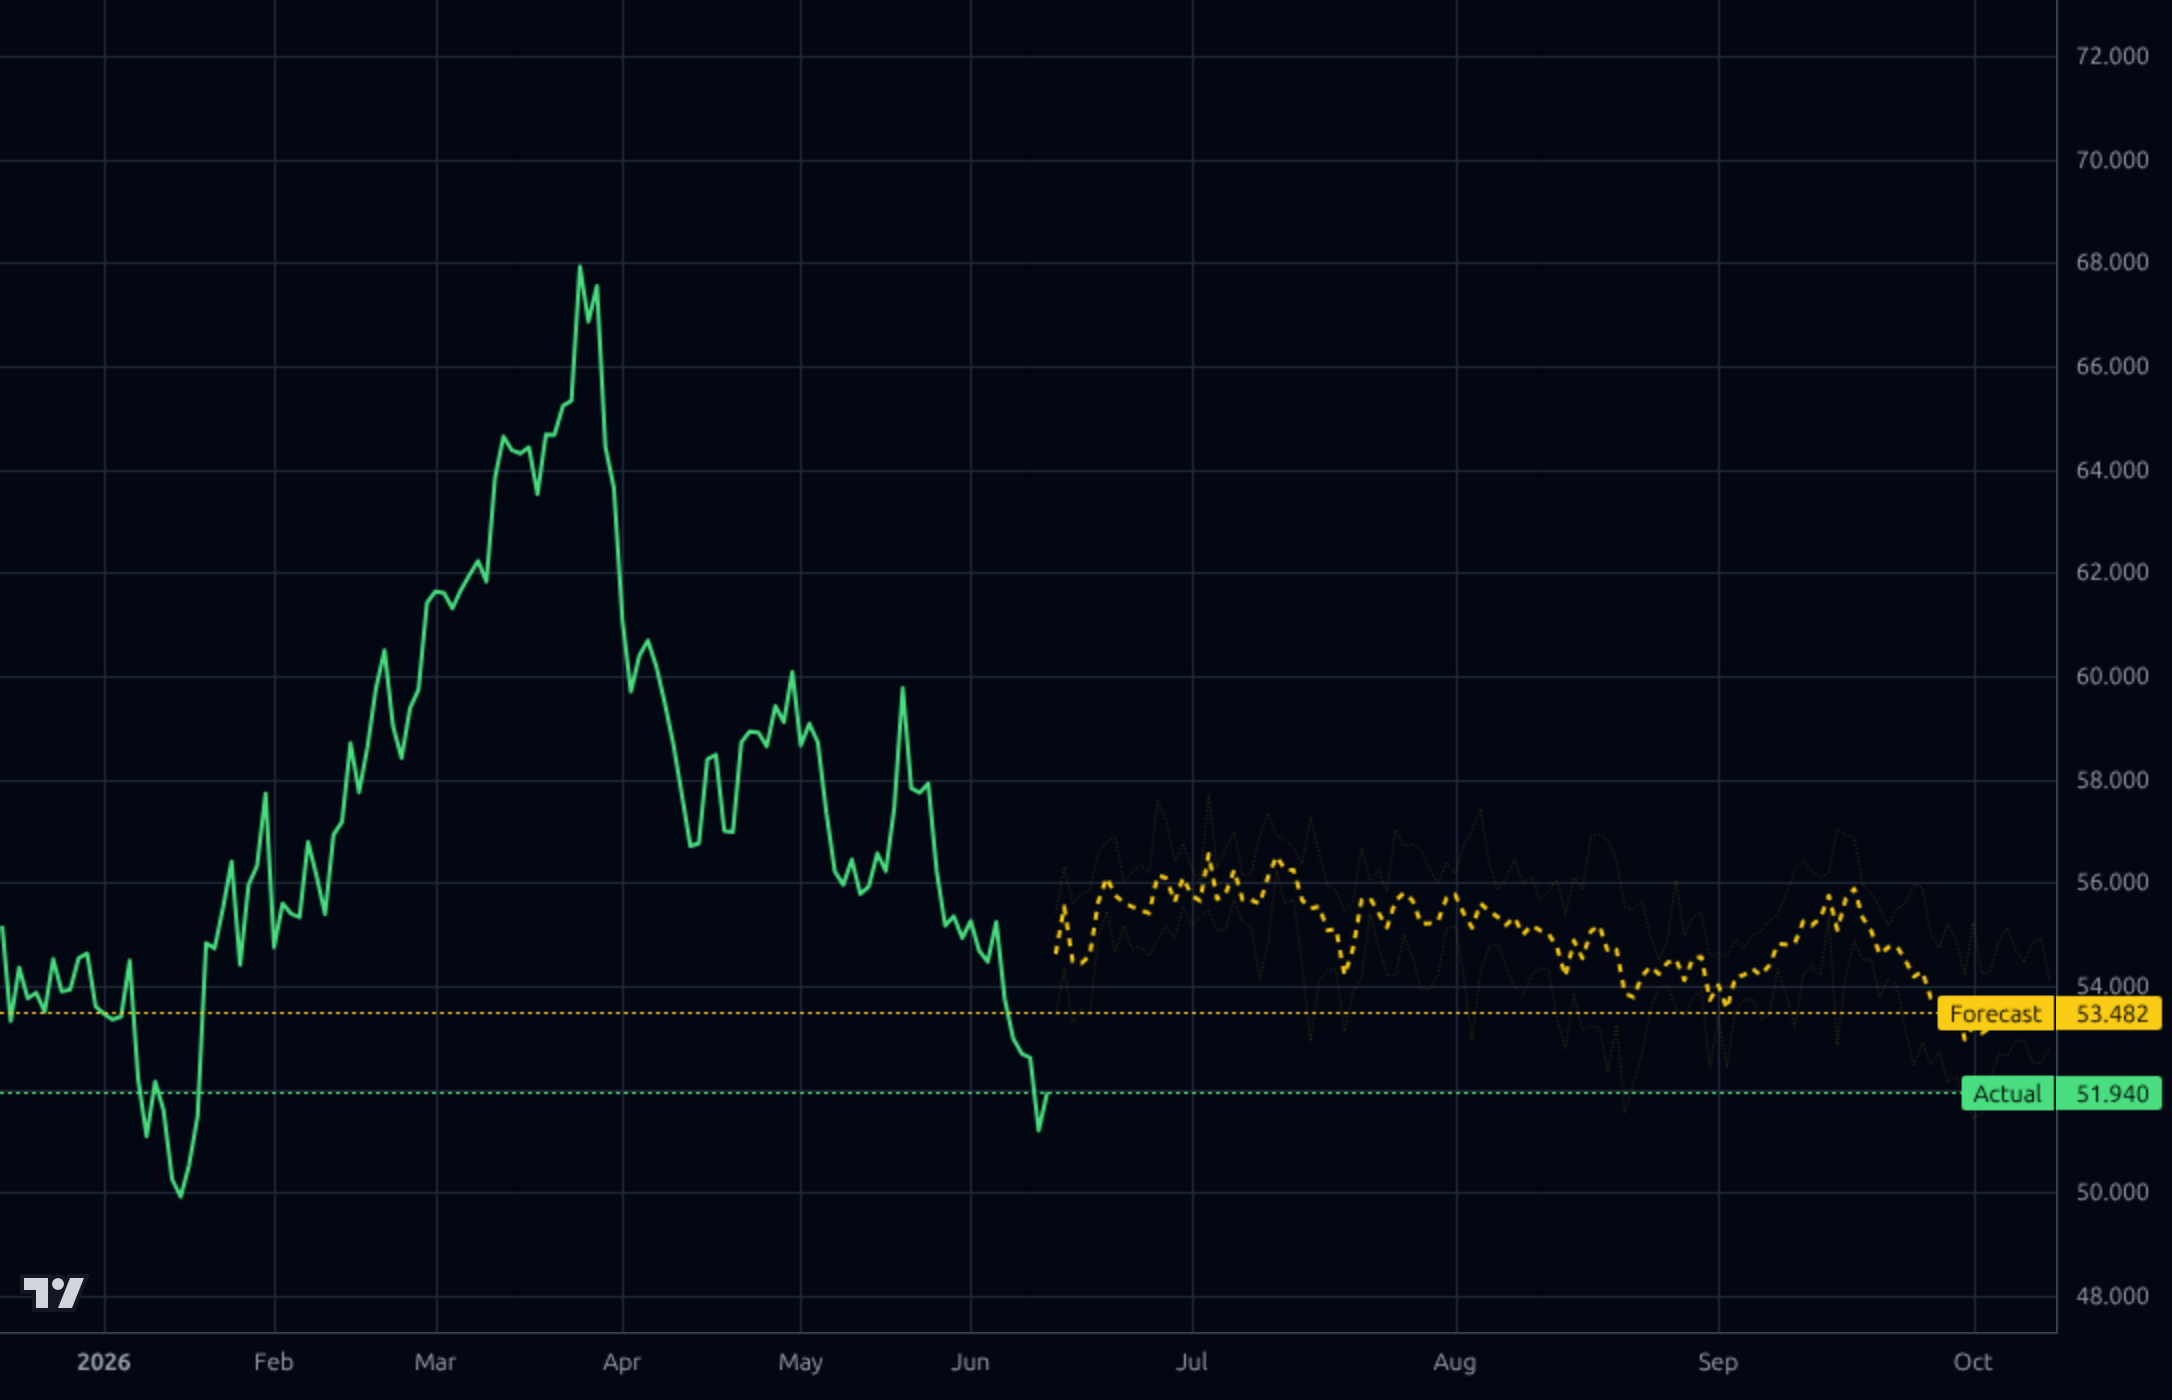
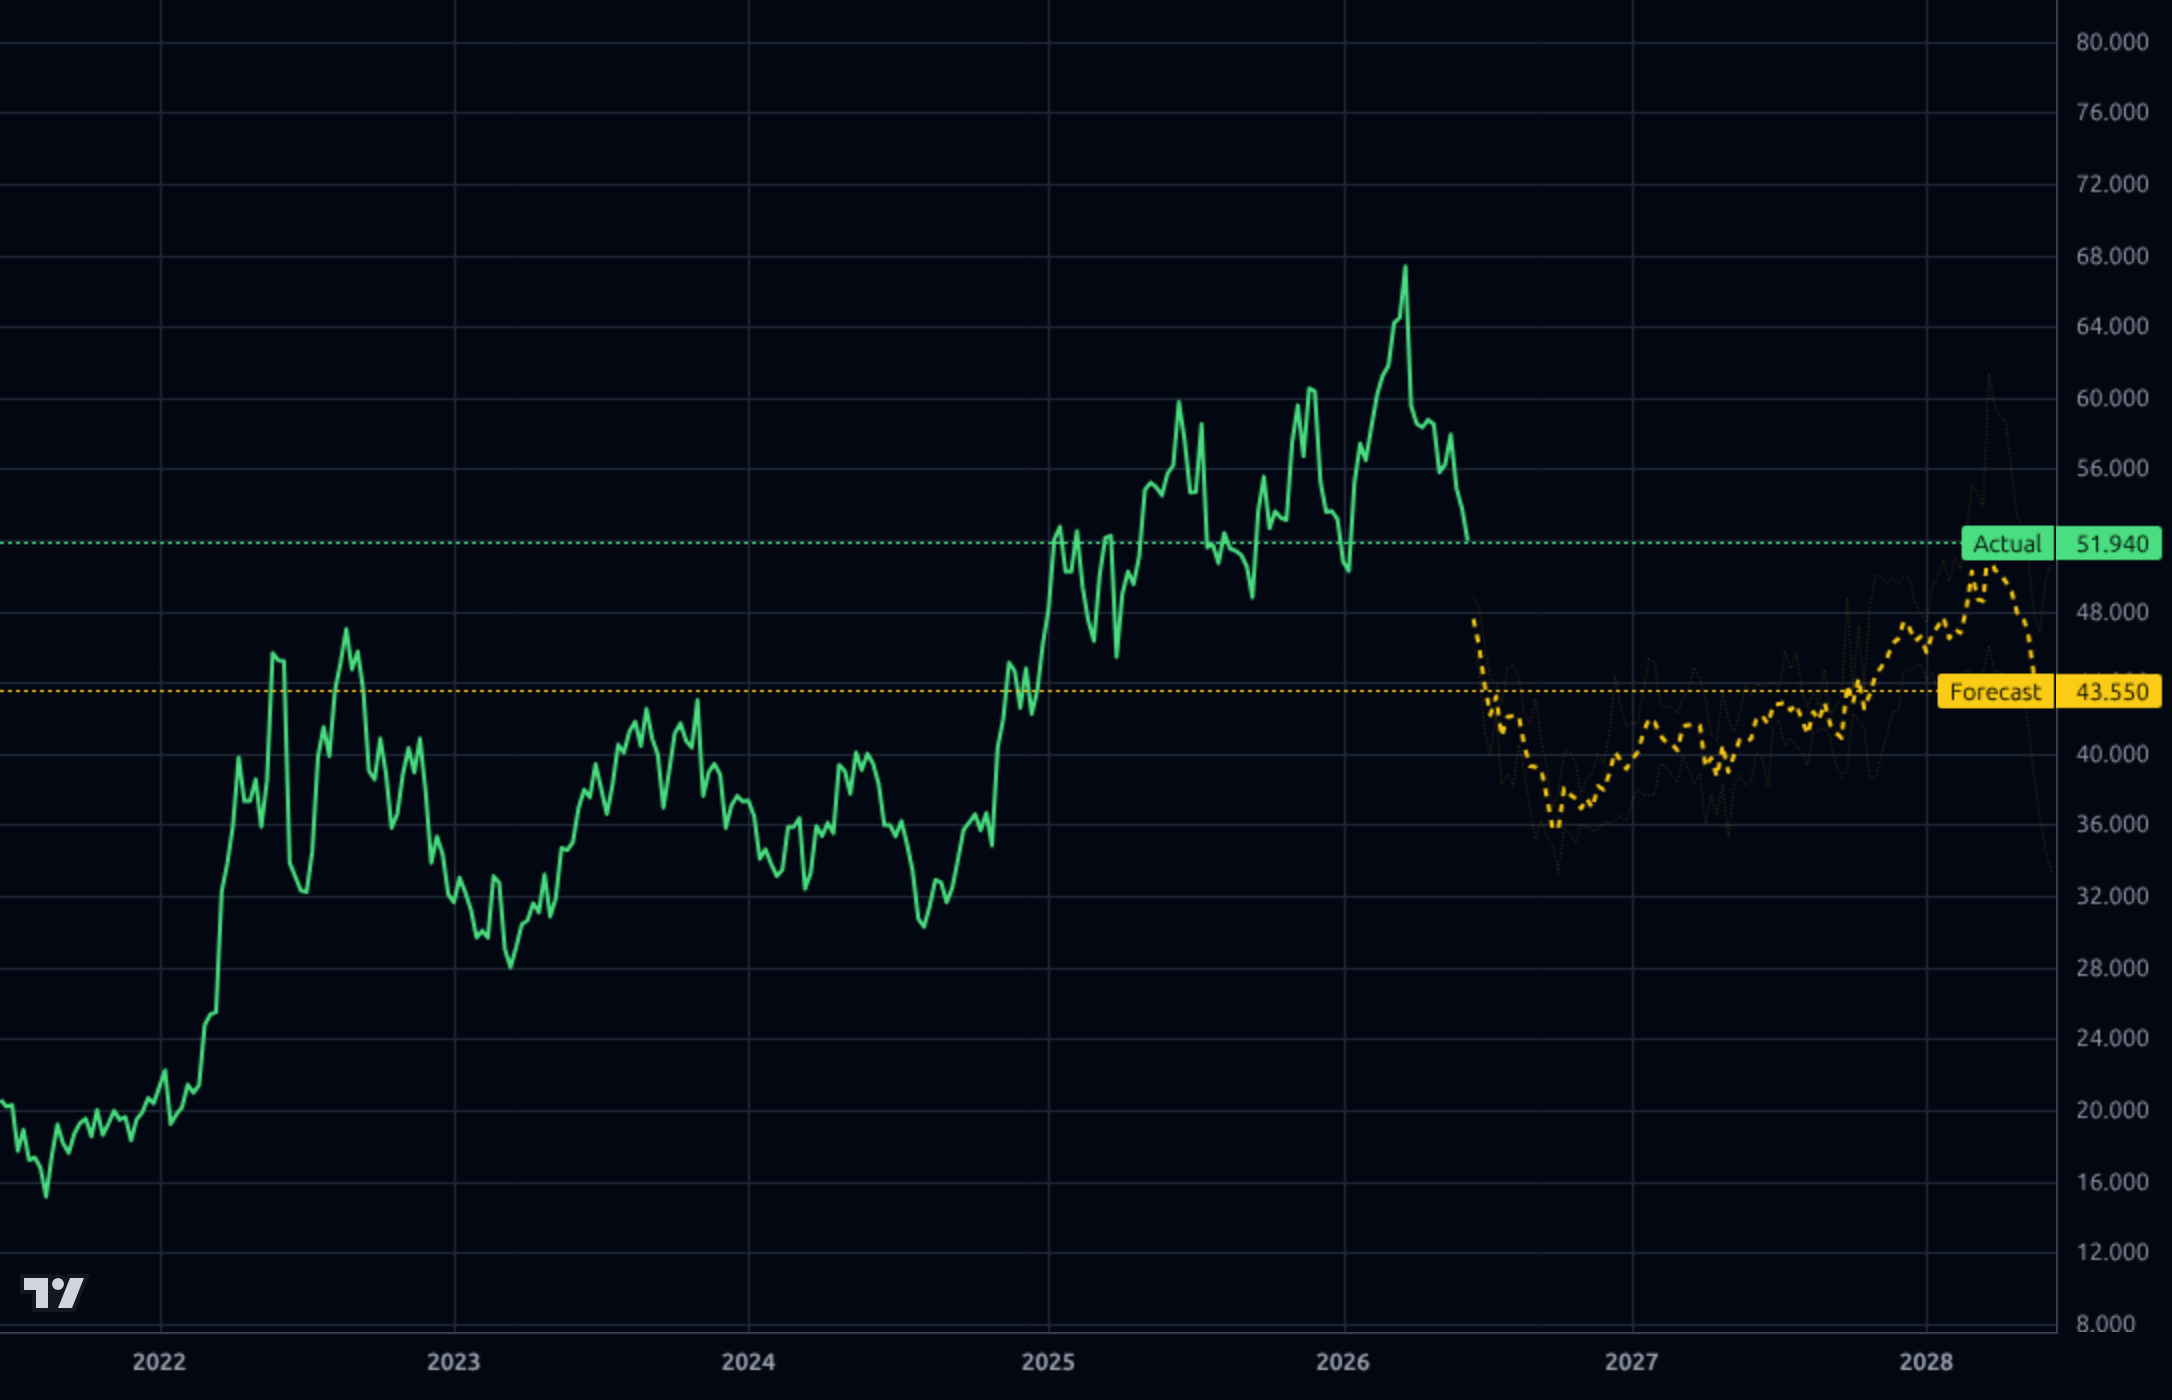
EQT is a low-cost Appalachian gas producer trading at $51.94 after a sharp ~24% pullback from the $68 high, with strong Q1'26 cash flow ($3.06B operating CF, $2.46B FCF) driven by data center/LNG demand tailwinds. Technicals are oversold (RSI 33, -8.85% vs SMA50) and Kronos forecasts diverge by timeframe — bullish near-term bounce to ~$58-61 but the daily/weekly models point to mean-reversion lower ($53.5 / $43.5), reflecting commodity cycle risk. Analyst consensus is constructive (Recom 1.74, PT $70.56) and valuation is reasonable (PEG 0.49, EV/EBITDA 6.2), supporting an ACCUMULATE stance on weakness.
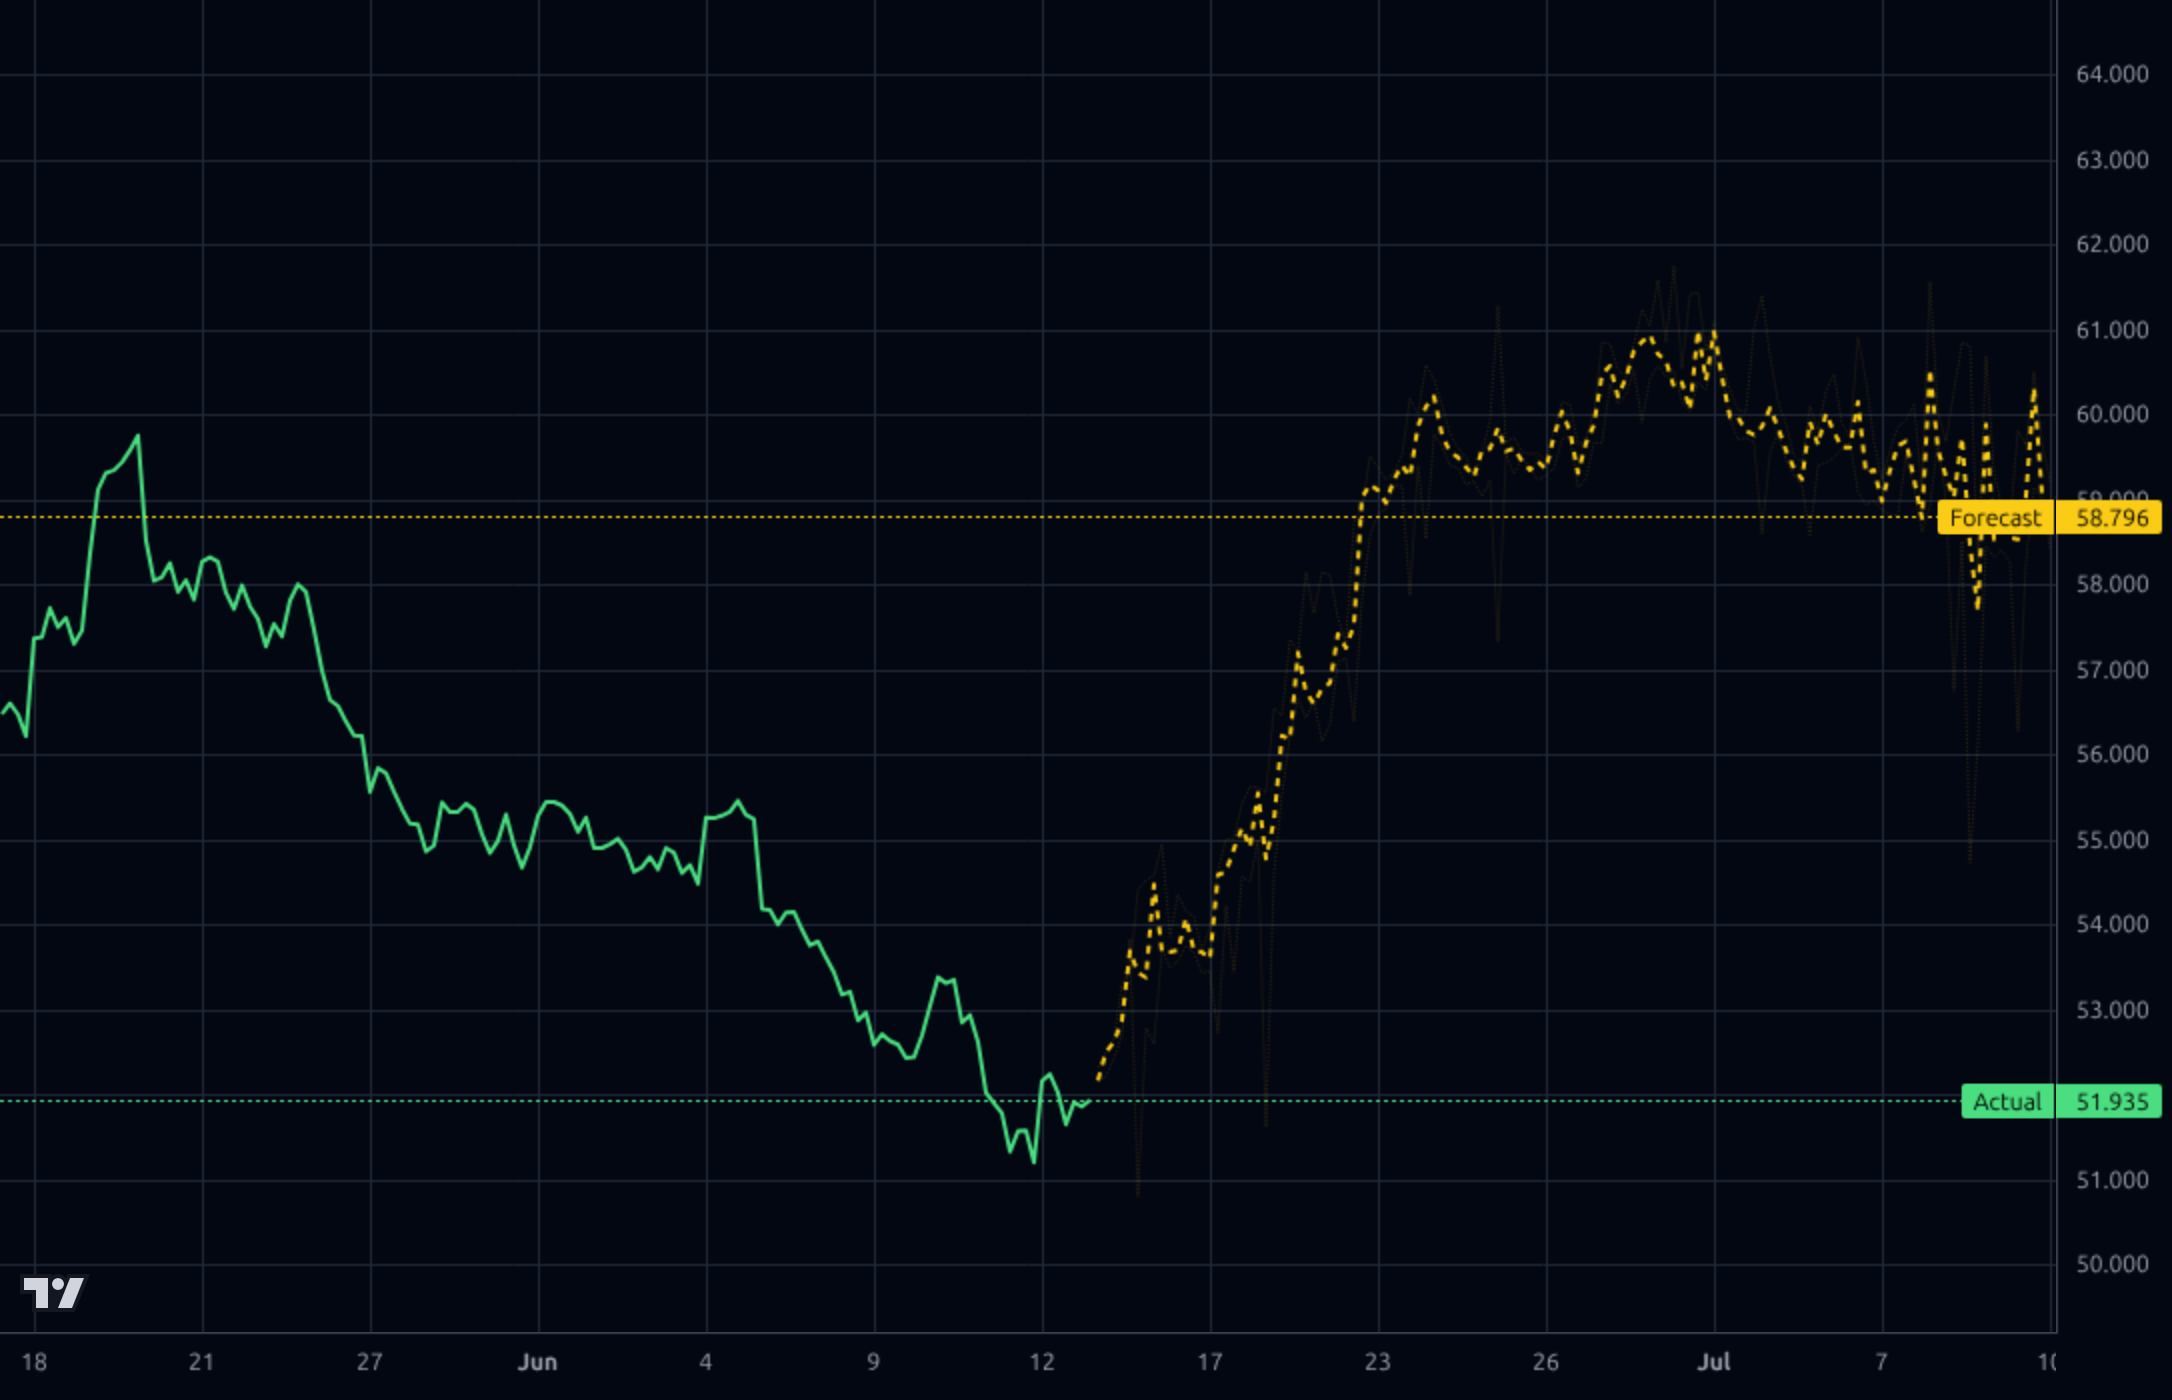
1-4 week view: Initiate or add on weakness given oversold RSI 33, 1h Kronos forecast targeting $58-61, and proximity to 52w low support at $48.47. Buy zone $50-52, stop below $48, first target $57-58 (prior breakdown). Size at 1/3 of intended position to leave room. Invalidation: weekly close below $48.
1-6 month view: Expect choppy range $50-62 as gas market digests demand growth vs. supply response. Catalysts: Q2'26 earnings (Apr 21 already passed — next print is the key one), LNG export ramp updates, data center PPAs. Expected return: +10-20% to PT zone of $60-65. Mind reverts if natural gas prices roll over or hedge fund outflows accelerate (Aschenbrenner exit is a warning).
1-3 year view: Structural thesis is intact — EQT is the largest US natural gas producer with lowest cost basis in Marcellus, levered to AI/data center power demand and LNG export buildout through 2028. However, the weekly Kronos forecast pointing to $43 suggests the model sees current price discounting peak-cycle conditions. Multi-year drivers: PJM grid capacity tightness, $20+ LNG arb potential, debt paydown to investment grade. Biggest structural risk: a gas price normalization to $2.50-3.00/MMBtu would compress these 57% operating margins meaningfully; secondary risk is renewables/storage substitution accelerating post-2028.
Fundamentals have inflected sharply higher: Q1'26 revenue of $3.62B nearly doubled from $1.84B in Q2'25, with operating margin expanding to 63% and net margin to 41%, reflecting both gas price strength and synergies. TTM sales growth Y/Y of 50.77% and EPS Y/Y of 800.7% are flattering off a low base but the trajectory is unmistakable — operating CF jumped to $3.06B in Q1'26 alone vs. $1.13B prior quarter, generating $2.46B FCF in a single quarter. Balance sheet has materially improved: total debt fell from $8.32B (Q2'25) to $5.99B (Q1'26), debt/equity at 0.24 is conservative for E&P, though current ratio of 0.66 reflects working capital deficit (-$809M). ROE of 13-14% and ROIC of 10.7% are respectable. Capital allocation looks disciplined with capex steady around $600M/quarter while FCF funds debt paydown and a modest 1.27% dividend (19% payout ratio leaves room). The main fundamental risk is operating leverage cuts both ways — these margins are gas-price dependent.
The technical picture is mixed and timeframe-dependent. On the 1h, price bottomed at ~$51 in mid-June and Kronos forecasts a recovery toward $58-61, supported by RSI at 33 (oversold) and the stock sitting 5.86% below SMA20. The 4h forecast extends this bounce through summer toward $61.5. However, the 1d model is more sobering — projecting a drift around $53-56 with a $53.48 forecast endpoint, essentially sideways-to-down from here. The weekly chart is the most bearish: after a parabolic move from $16 (2022) to $68 (peak 2026), the model targets $43.5 over 2 years, suggesting mean reversion to the broader range. Key support is $48.47 (52w low), resistance at $58 (recent breakdown) and $68 (cycle high). Stock is -19.31% in the past quarter and -8.21% below SMA200 — clearly in a corrective phase. Kronos historical MAPE of 4.06% with 100% directional accuracy (small sample, n=1) lends some credibility to the near-term bounce thesis.
News flow is constructively skewed. The dominant theme is structural demand from AI data centers, LNG exports, and power generation lifting Q1'26 earnings above expectations, with EQT's low-cost Marcellus position singled out as a competitive moat (Yahoo/Simply Wall St., June 4). Mizuho (May 27) highlighted U.S. oil & gas mispricing amid Iran-related geopolitical tension. Jim Cramer flagged EQT as on his radar in oil stocks (June 2). The one cautionary signal: Leopold Aschenbrenner's hedge fund fully exited its EQT stake in Q1'26 filings (May 30) — a notable smart-money divergence worth respecting. Separately, an 'EQT Infrastructure VII' fund headline appears to reference EQT AB (the Swedish PE firm), NOT EQT Corp the US gas producer — this should be filtered as noise, not signal. Overall, the bullish AI/LNG demand narrative is genuine and durable but already partly priced in given the rally from $16 to $68.
- Data center power demand driving gas burn — EQT explicitly cited as beneficiary of AI infrastructure buildout (Yahoo, June 4)
- LNG export volumes ramping — Q1'26 results showed higher realized prices from LNG-linked sales channels
- Marcellus low-cost position enabling FCF generation even at modest gas prices ($2.46B FCF in Q1'26 alone)
- Debt reduction trajectory: total debt down from $8.32B to $5.99B in 3 quarters, path to IG rating supports multiple expansion
- Analyst consensus PT of $70.56 implies ~36% upside; Recom 1.74 (between Strong Buy and Buy)
- Natural gas commodity cycle: weekly Kronos forecast targets $43.55 over 2 years — model sees mean reversion risk
- Smart money exit: Leopold Aschenbrenner's hedge fund fully divested in Q1'26 — notable contrarian signal
- Operating leverage works both ways: 63% Q1 operating margin assumes elevated gas prices; sensitivity is severe
- Working capital deficit: current ratio 0.66, working capital -$809M leaves little liquidity cushion
- Stock down 19.3% over past quarter and below SMA20/50/200 — momentum is broken, no confirmed bottom yet
- Forward P/E (11.2) higher than trailing P/E (9.9) implies consensus expects EPS to decline next year (EPS next Y: -2.26%)
- Concentration risk in Appalachian Basin and single commodity exposure
Get AI analysis on any stock
This is one of hundreds of Kronos AI reports — scored fundamentals & technicals, bull/base/bear price targets, a multi-horizon plan, and continuously-updated forecasts across the market. Create a free account to explore them all.
Create your free account →Already a member? Sign in · Join our Discord