EXE — AI Stock Forecast & Price Targets
Published 7/29/2026 · A free sample of K3vl4r’s AI-powered analysis.
Kronos price forecasts, scored fundamentals & technicals, and a multi-horizon plan.
View the live EXE price forecast →
Expand Energy delivered a solid Q2 beat ($1.33 vs $1.12 EPS) with strong FCF generation, but the stock is stuck in a downtrend, down ~30% from 52-week highs and trading near multi-month support at $87-89. Fundamentals are healthy (6.6x P/E, 0.80 PEG, 17.6% ROE, 3.5% yield) and analyst target of $125.81 implies significant upside, but weak nat-gas price sensitivity, poor short-term forecast reliability, and a broken technical structure argue for patience rather than aggressive accumulation.
HOLD / patient accumulator. Price at $88.52 is pinned against the $85-89 multi-month support shelf with a broken trend and a downside-skewed weekly forecast ($86.42). Do not chase. Nibble only on a tag of $85-86 with a hard stop below $84 (breaks 52-week low = invalidation, thesis reset). Alternatively wait for a confirmed reclaim of $92 (above SMA50) with volume to add. Avoid sizing up ahead of any macro nat-gas print. Position size: quarter to half normal.
1-6 month view is constructively cautious. With Q3 earnings on Oct 27, the setup is: quality assets, cheap multiple (6.6x P/E, 4x EV/EBITDA), buyback support, 2.6% yield, and analyst target $125.81 (+42%) versus a commodity-price overhang and broken chart. Base case: mean-reversion toward $100-105 as nat-gas seasonality (winter demand) kicks in, worth roughly +15-20%. What changes the mind: sustained nat-gas price weakness below key strip levels, or a break of $84 support that invites another leg to $75-80. Watch Twin Eagle integration commentary and Q3 FCF trajectory.
1-3 year thesis is favorable if you believe in a structural nat-gas demand story (LNG export capacity build-out, data-center / AI power demand, coal-to-gas switching). EXE is a top-tier low-cost Marcellus/Haynesville operator with scale, strong ROIC (13.6%), disciplined capital allocation, and a growing dividend. Fair value in a normalized cycle is comfortably above $110-125. Biggest structural risk: a durable secular decline in nat-gas realizations from renewable displacement or a warm-winter demand shock, compounded by the cyclical operating leverage that turned Q2 EPS -46% YoY.
The Q2 2026 print was a clear beat: EPS $1.33 vs $1.12 consensus (+19%), revenue $2.96B (though -20% YoY and slightly below the $3.05B estimate), with adj. EBITDAX of $1.18B and operating cash flow of $1.10B. TTM metrics are strong — revenue $12.96B, net margin 24.9%, operating margin 34%, ROE 17.6%, ROIC 13.6%. Valuation is undemanding at 6.6x trailing P/E, 1.09x P/B, 4.0x EV/EBITDA, and a 0.80 PEG. The balance sheet is manageable: $2.22B cash vs $5.06B debt (D/E 0.26, current ratio 1.11), and working capital swung positive to $437M in Q1 2026 from -$652M in Q2 2025 — a material improvement from the prior thesis concern. FCF of $1.69B TTM comfortably covers the $2.30 dividend (30% payout, 2.6-3.5% yield depending on source). The Twin Eagle acquisition and new buyback announced alongside earnings signal management confidence. The obvious blemish: Q2 revenue was down 20% YoY and EPS down 46% YoY, reflecting commodity price sensitivity — the core structural risk.
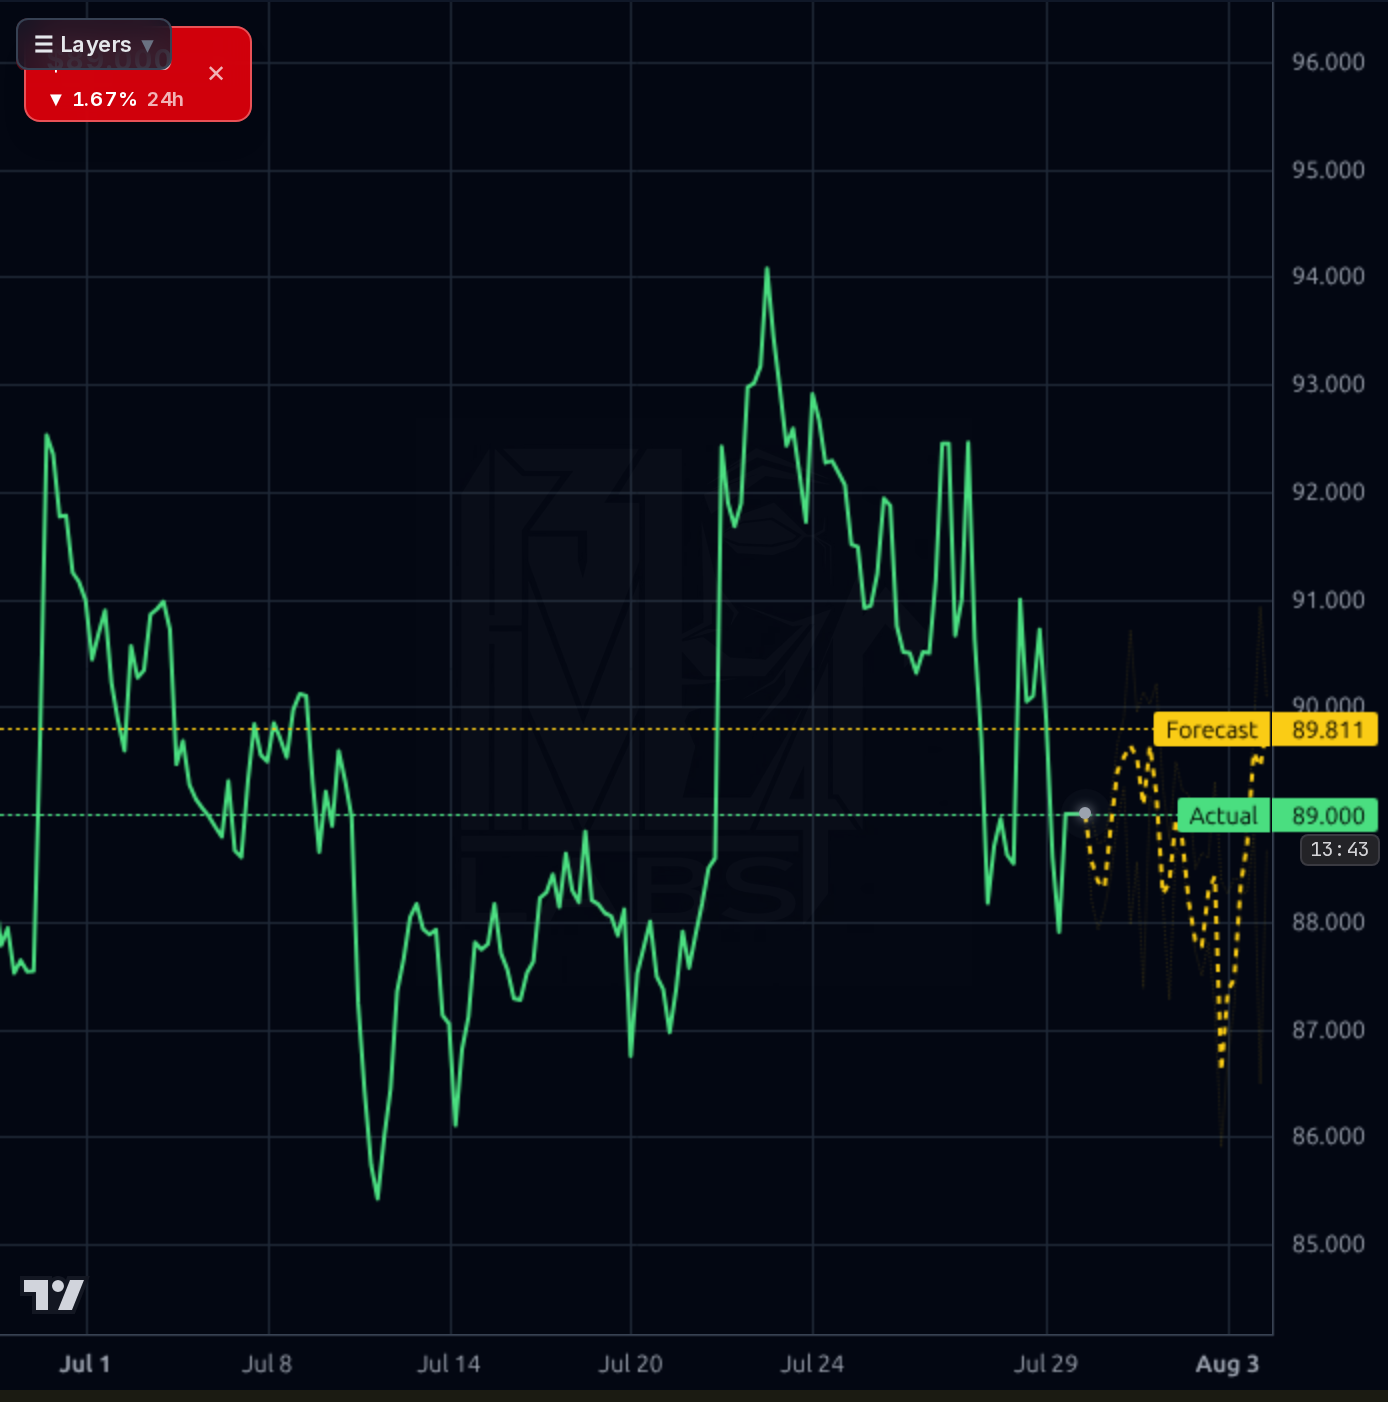
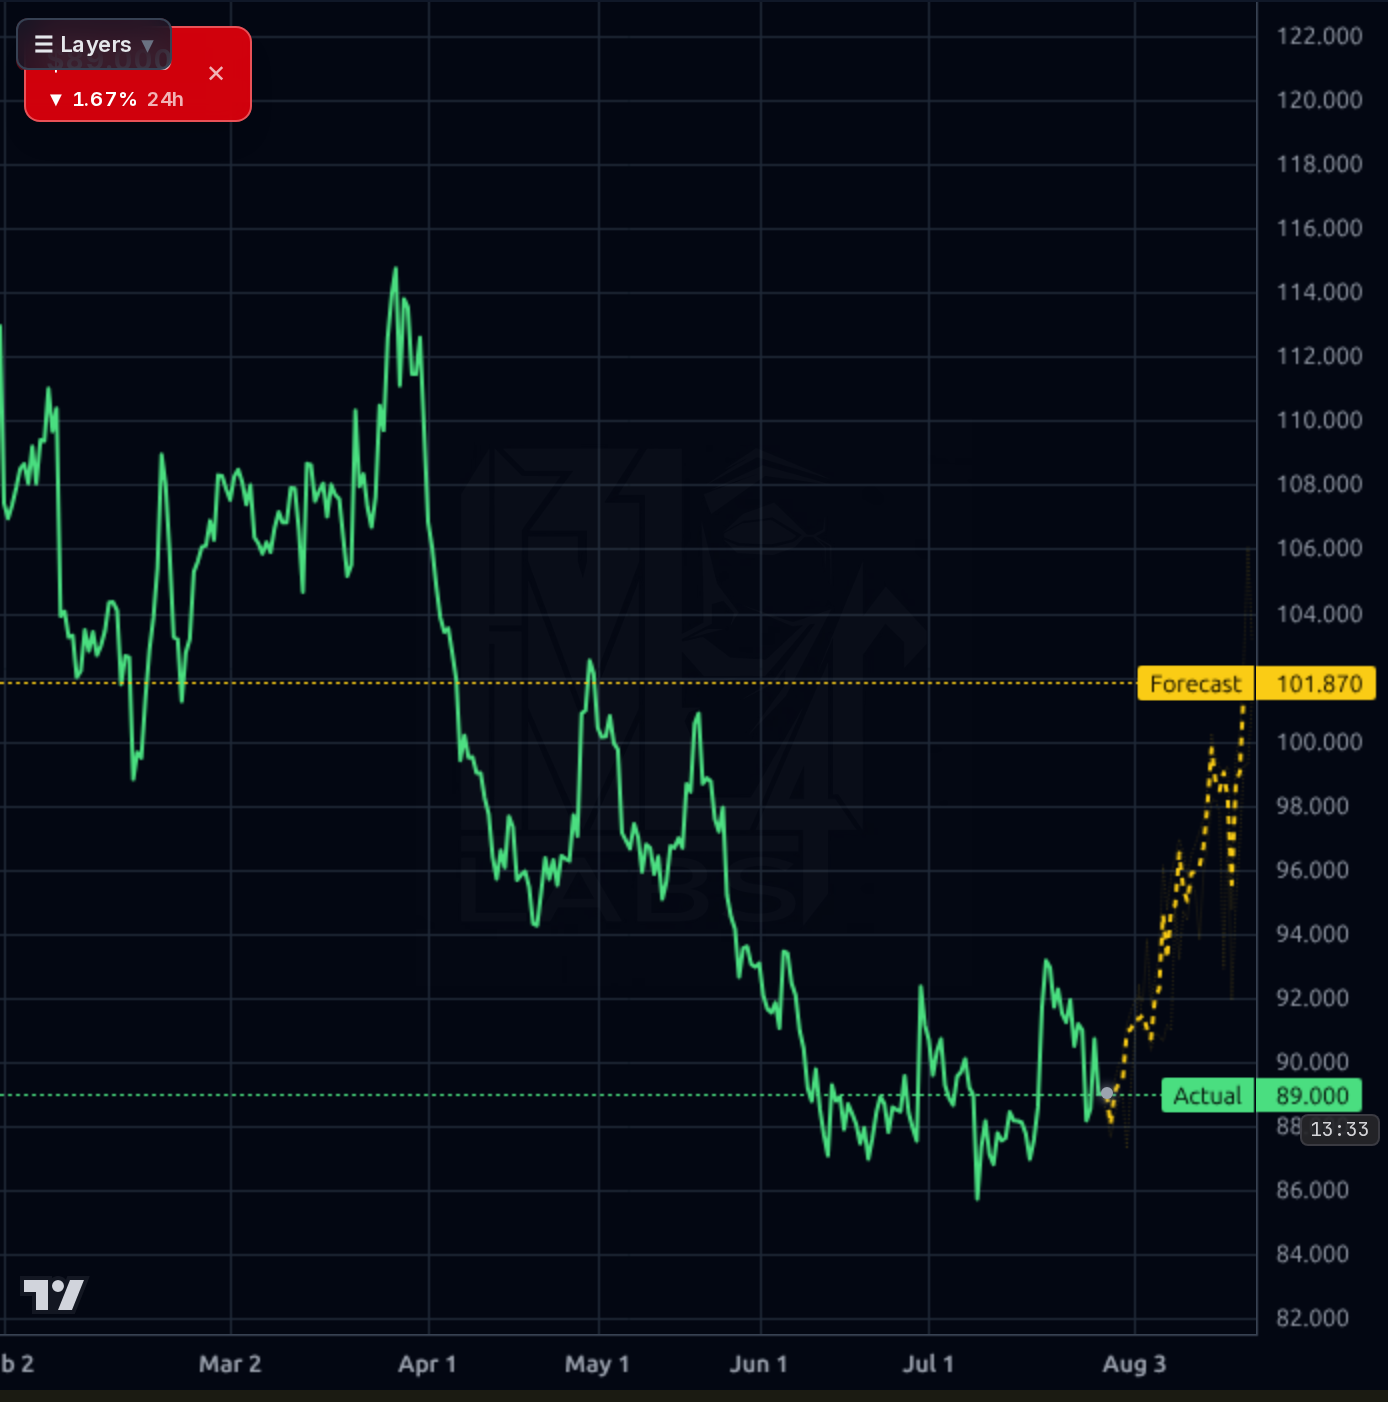
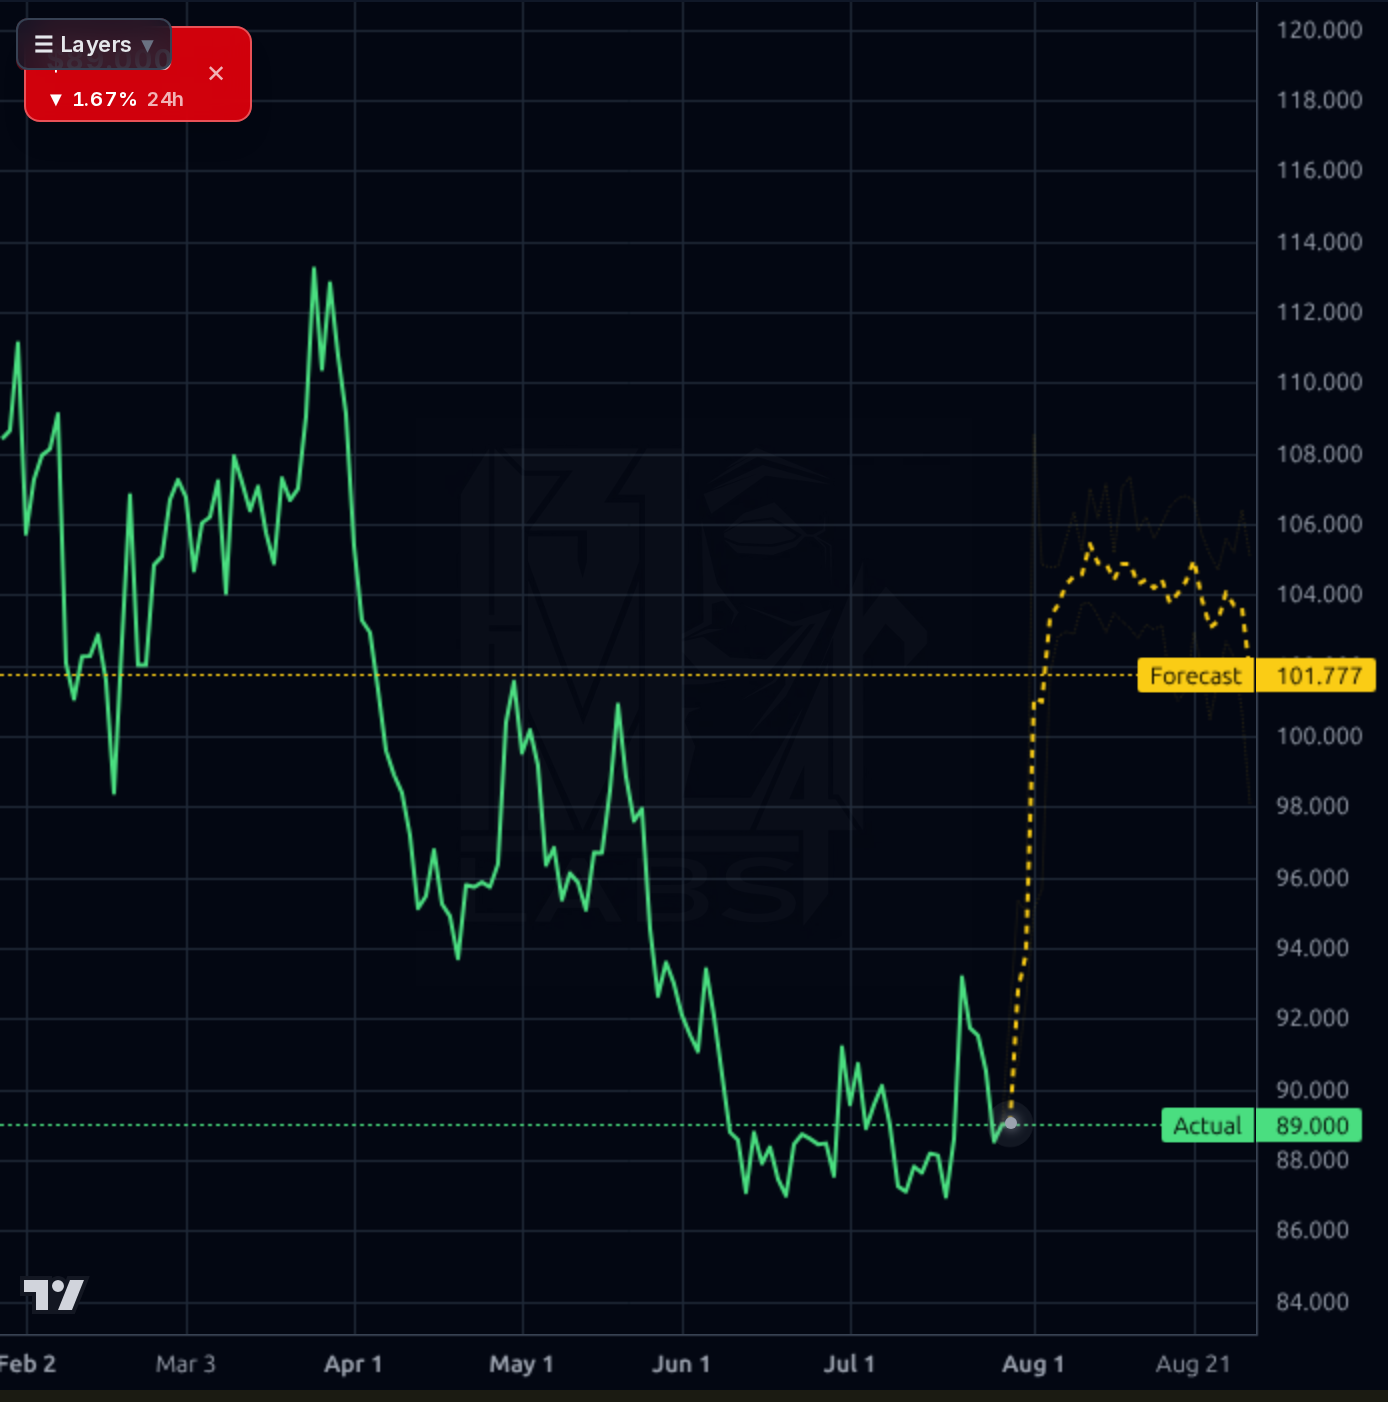
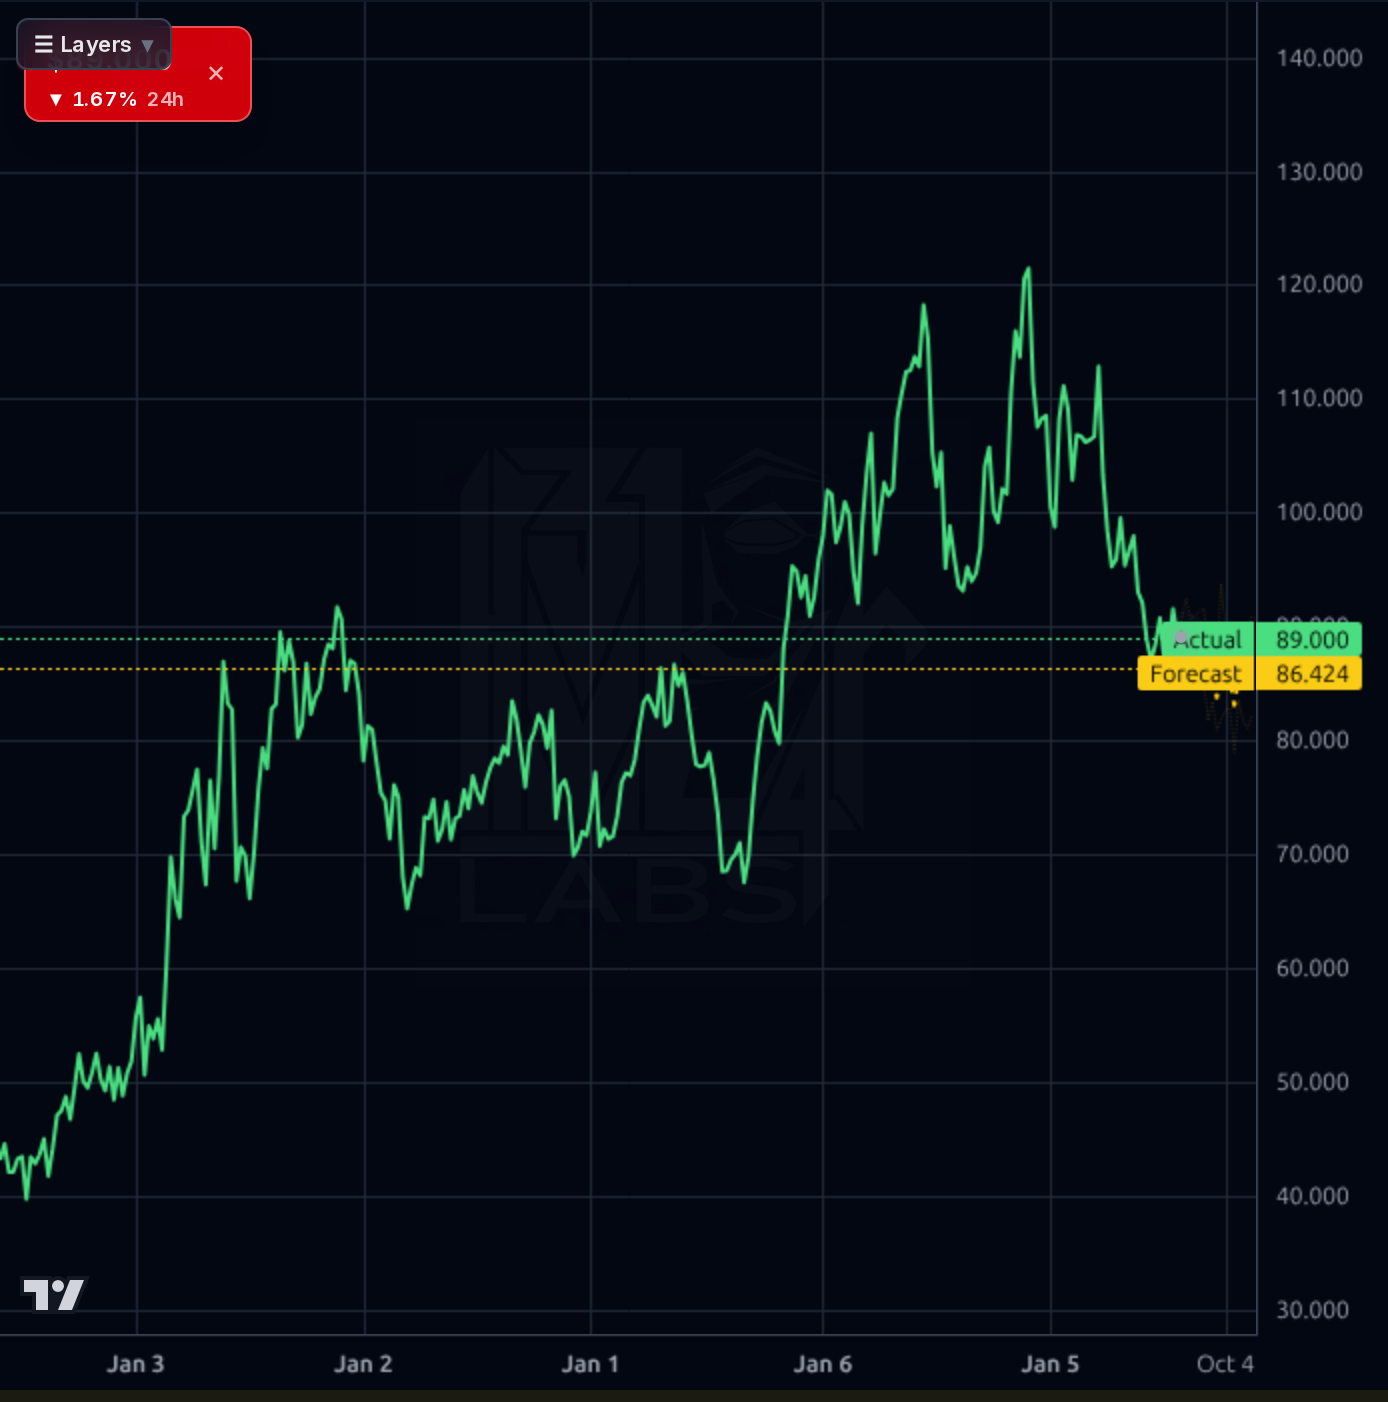
The setup is technically weak. On the 1h chart, price rolled from $94 down to $88-89, and the model's forecast band actually points lower ($87 area) despite the misleading '1.00 bullish_prob' header. The 4h chart shows a bullish forecast toward $101.87, but 1d and 1wk model calls diverge — 1d bullish, 1wk only 40% bullish with forecast at $86.42, BELOW current. The weekly chart shows a decisive rollover from the $120+ high in early 2026, breaking through $100 and now testing multi-month support at $85-89 (52-week low $84.99, just 4% below). Price sits -0.9% below SMA20, -2.4% below SMA50, and -13.8% below SMA200 — a textbook downtrend. RSI 46 is neutral with no oversold bounce signal yet. YTD -19.8%, half-year -21%. Critically, the model's realized directional accuracy is BELOW naive baseline on both 1d (48% vs 52%) and 1wk (50% vs 83%) horizons — its bullish signals should be heavily discounted. The $85 level is the line in the sand; a break opens $80.
The signal is the Q2 earnings beat filed via 8-K on 7/28 (Items 2.02, 7.01, 9.01): $1.33 adj EPS vs $1.13 consensus (+18% surprise), $2.96B revenue, $1.18B adj EBITDAX, ~7.48 Bcfe/d production (92% natural gas), plus a new buyback authorization and the Twin Eagle acquisition — a genuinely constructive print. The stock nonetheless traded -1.7% to -2.2% on the news, consistent with 'sell-the-news' or profit-taking behavior in a weak tape. Yahoo Finance TV coverage repeatedly namechecked EXE alongside EQT as preferred natural gas plays on strategic advantage — supportive but low-signal chatter. Reporting language ('down 46% YoY EPS, down 20% YoY revenue') captures why the market is unimpressed: the beat is against lowered bars in a cyclical trough. Broader macro news (Belgium GDP, crypto, Bloom Energy) is noise for this name.
- Twin Eagle acquisition announced alongside Q2 print — bolt-on scale in core basins pending integration commentary
- New share buyback authorization (per Q2 release) providing floor support alongside the 2.6%+ dividend
- Working capital swung from -$652M (Q2 2025) to +$437M (Q1 2026), a material operational improvement
- Production ~7.48 Bcfe/d at 92% natural gas — direct leverage to LNG export ramp and winter demand
- TTM FCF of $1.69B fully covers dividend (30% payout ratio), leaving reinvestment and buyback capacity
- Nat-gas price sensitivity: Q2 revenue -20% YoY, EPS -46% YoY despite the beat — cyclical operating leverage cuts both ways
- Technical breakdown: -13.8% below SMA200, -30% from 52-week high, pinned at $85-89 support with no bounce yet
- Weekly model forecast is bearish ($86.42) and short-term model accuracy sits BELOW naive baseline — signals unreliable
- Debt load $5.06B vs $2.22B cash — manageable but leveraged to commodity prices
- Sell-the-news reaction post-Q2 (-1.7% to -2.2%) suggests the beat was already priced or the tape doesn't care
- Broader defensive-leadership market regime with distribution overtones caps re-rating enthusiasm for cyclicals
Get AI analysis on any stock
This is one of hundreds of Kronos AI reports — scored fundamentals & technicals, bull/base/bear price targets, a multi-horizon plan, and continuously-updated forecasts across the market. Create a free account to explore them all.
Create your free account →Already a member? Sign in · Join our Discord