FOUR— AI Stock Forecast & Price Targets
Published 7/2/2026 · A free sample of K3vl4r’s AI-powered analysis.
Kronos price forecasts, scored fundamentals & technicals, and a multi-horizon plan.
View the live FOUR price forecast →
Shift4 has staged a sharp ~40% rally from the $34.56 low to $49.20 on short-squeeze mechanics (29.9% short float, +3.3pp in 45d), a proactive debt refinancing, and Russell Value index inclusion, but is now pressing into resistance with RSI 66.5 and SMA20 stretched +18.8% ahead of an August 4 earnings print. Fundamentals remain a tug-of-war: 28% TTM revenue growth and a 7.2x forward P/E versus a sharp Q1'26 operating margin drop to 4.46%, $4.58B debt, and cash burn from $3.03B to $473M over three quarters. Base case is a consolidation into earnings with fair value near $52; bull case requires Q2 margin recovery confirmation.
Into the Aug 4 earnings print (~33 days), I would HOLD existing positions and NOT initiate new longs at $49.20 given RSI 66.5, SMA20 stretched +18.8%, and resistance at $52. Trim aggressive traders' positions into $52-54 to lock squeeze gains. Earnings is a binary event and the key catalyst; a beat with operating margin >7% likely opens $55-58, a miss or continued margin compression likely retraces to $42-43 (forecast anchor) or lower. Do not carry oversized swing risk into the print. Invalidation for the near-term bullish structure: break of $46 on volume before earnings.
Over 1-6 months, ACCUMULATE on weakness in the $40-44 zone. Base case is that Q2 margins partially normalize (structural mid-single-digit ops margin is unacceptable given peer set), and the stock re-rates toward $52-55 on a 7-8x forward EPS multiple. Expected return range: +6% to +18% from spot in base case, with a bull case to $60 (+22%) requiring a clean beat and cash-balance stabilization. What changes my mind bearishly: a second consecutive quarter of sub-6% operating margin, or cash falling below $400M without offsetting debt paydown. What changes my mind bullishly: operating margin back to 9-10% and FCF conversion holding above 55%.
Over 1-3 years, the terminal thesis rests on whether Shift4 can defend its niche in complex in-person payment environments (stadiums, restaurants, venues) against Stripe/Adyen/Toast while cross-selling software (SkyTab, Lighthouse) to lift take rates and margins. If the company executes and grows revenue at 20%+ CAGR while restoring 12-15% operating margins, the current $3.9B market cap looks materially undervalued vs peer multiples — a path to $75-90 exists. The biggest structural risk is that the Q1'26 margin drop reflects real competitive pricing pressure at scale, in which case the stock is a value trap with an over-levered balance sheet. Leverage (D/E 2.77) makes the equity a call option on operational execution — appropriate for a small allocation, not a core position.
Top-line remains robust — Q1'26 revenue of $1.121B is up meaningfully YoY (Sales Y/Y TTM +28.3%, Sales Q/Q +32.2%) and TTM revenue sits at $4.45B. However, the Q1 operating margin collapsed to 4.46% from 10.2% in Q4'25 and 9.5% in Q3'25, and net margin fell to 1.34% from 3.38% — that sequential margin degradation is the single most important red flag and directly maps to the EPS Y/Y TTM of -72.4% and EPS Q/Q -106.8%. Balance sheet has deteriorated visibly: cash dropped from $3.03B (Jun'25) to $1.51B (Sep'25) to $964M (Dec'25) to $473M (Mar'26), while total debt sits at $4.58B (D/E 2.77, LT Debt/Eq 2.75). That said, FCF quality remains real — TTM FCF ~$488M, Q1'26 FCF of $63M, and P/FCF of just 7.4x. Forward P/E of 7.2x with PEG 0.49 screens as deep value if — and only if — margin normalization occurs. Insider ownership of 29.6% and institutional ownership of 91.2% signal alignment but also a crowded holder base. Capital allocation has pivoted toward debt management (recent refinancing) rather than buybacks, appropriate given leverage.
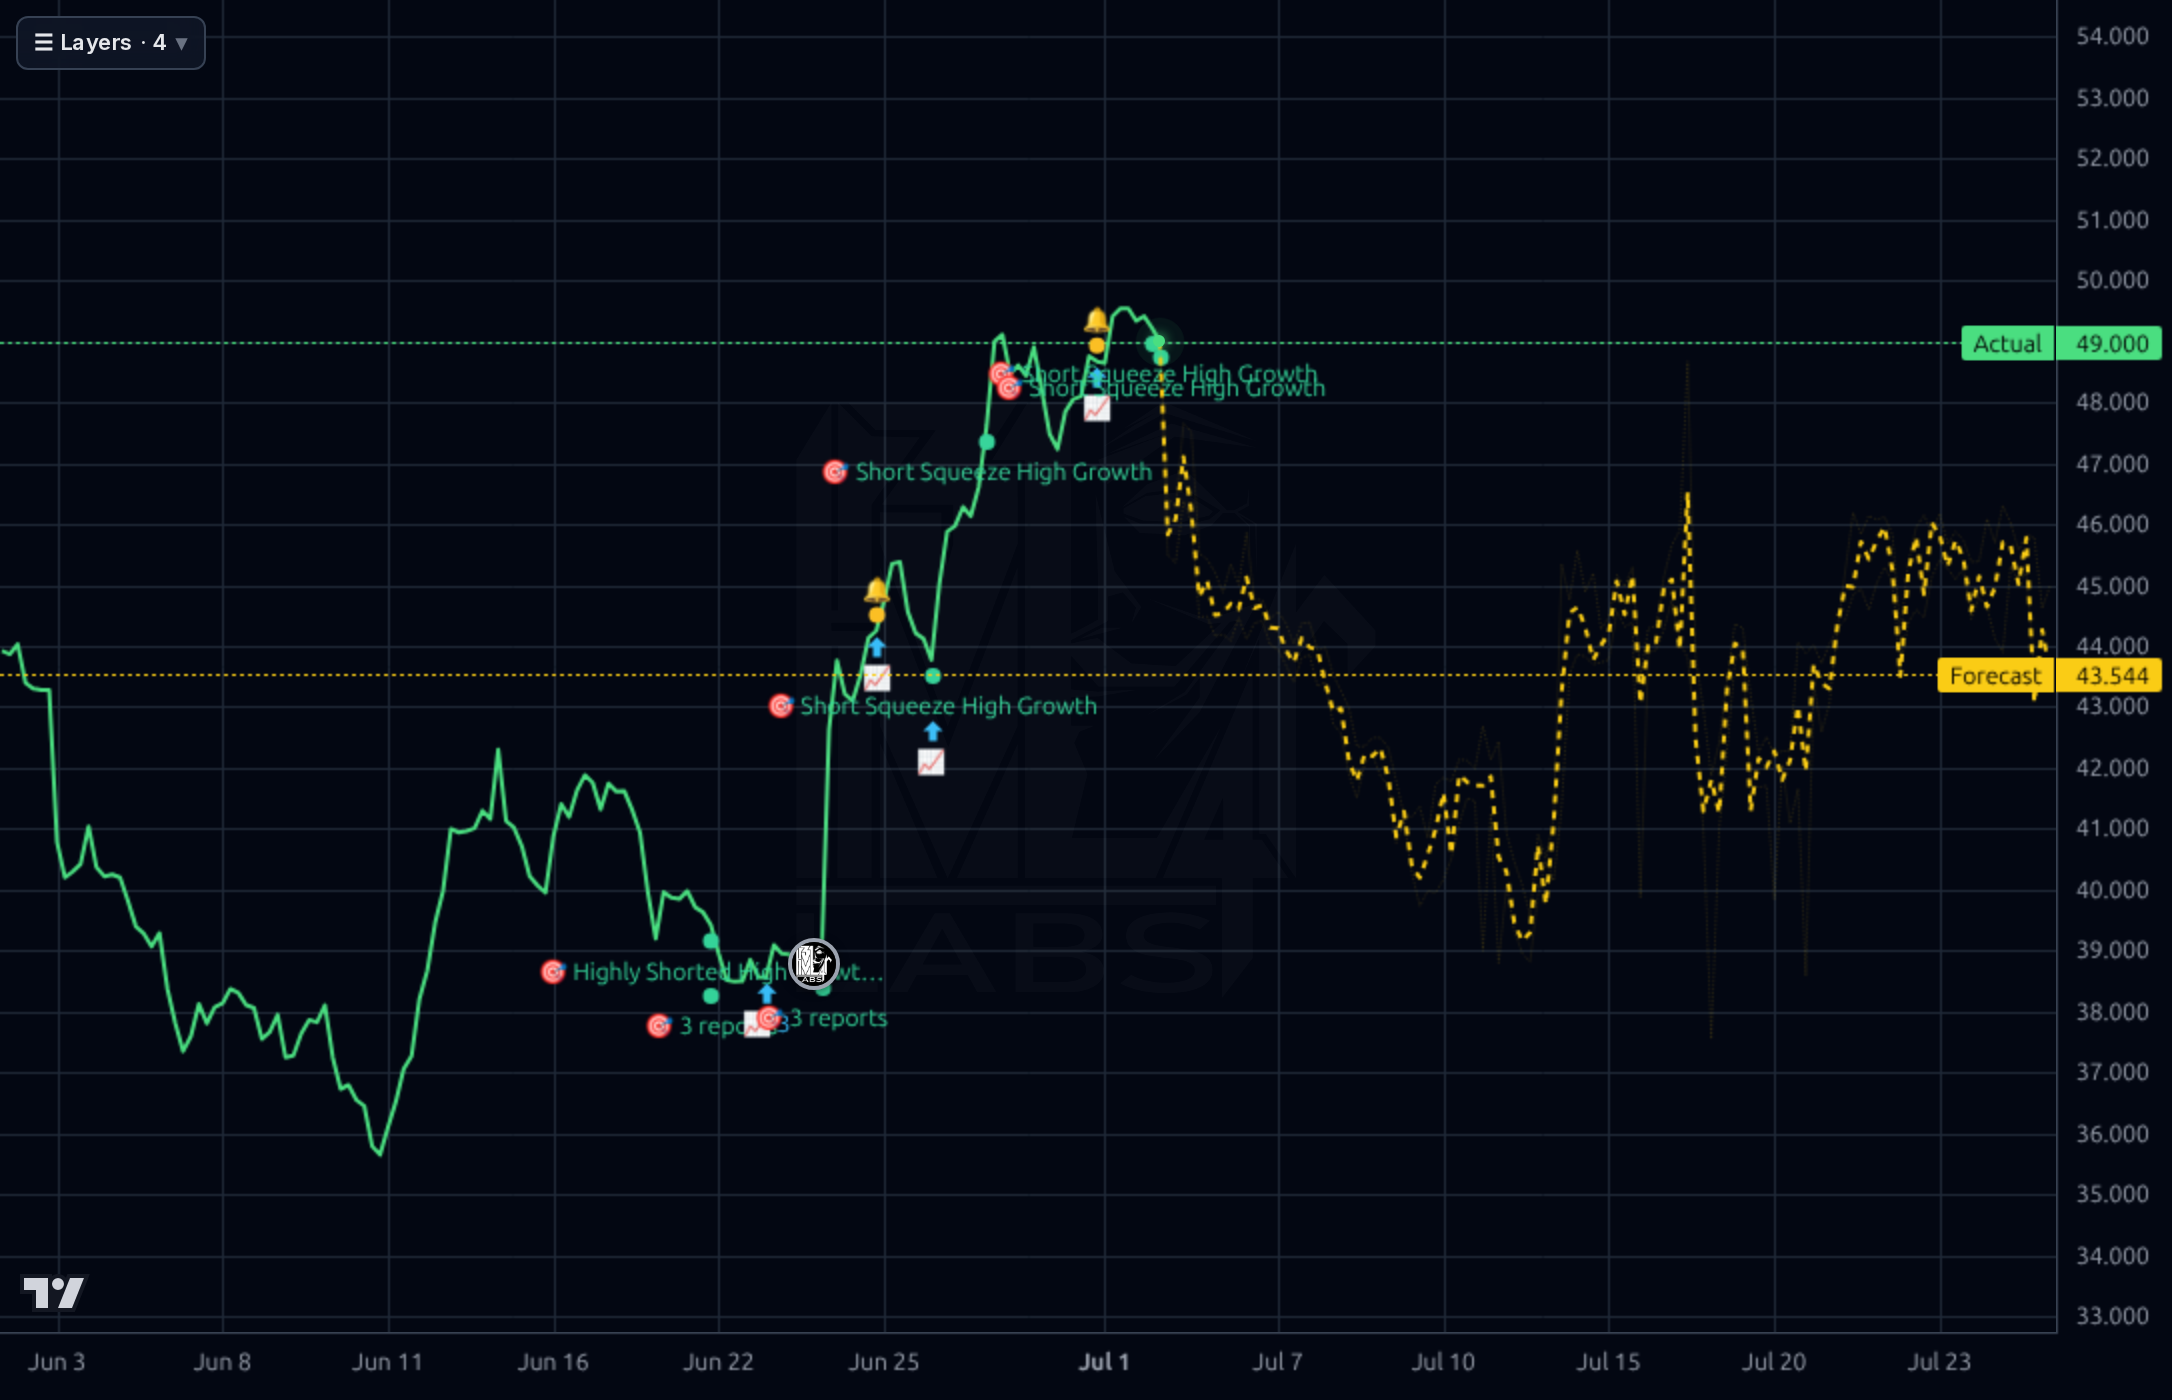
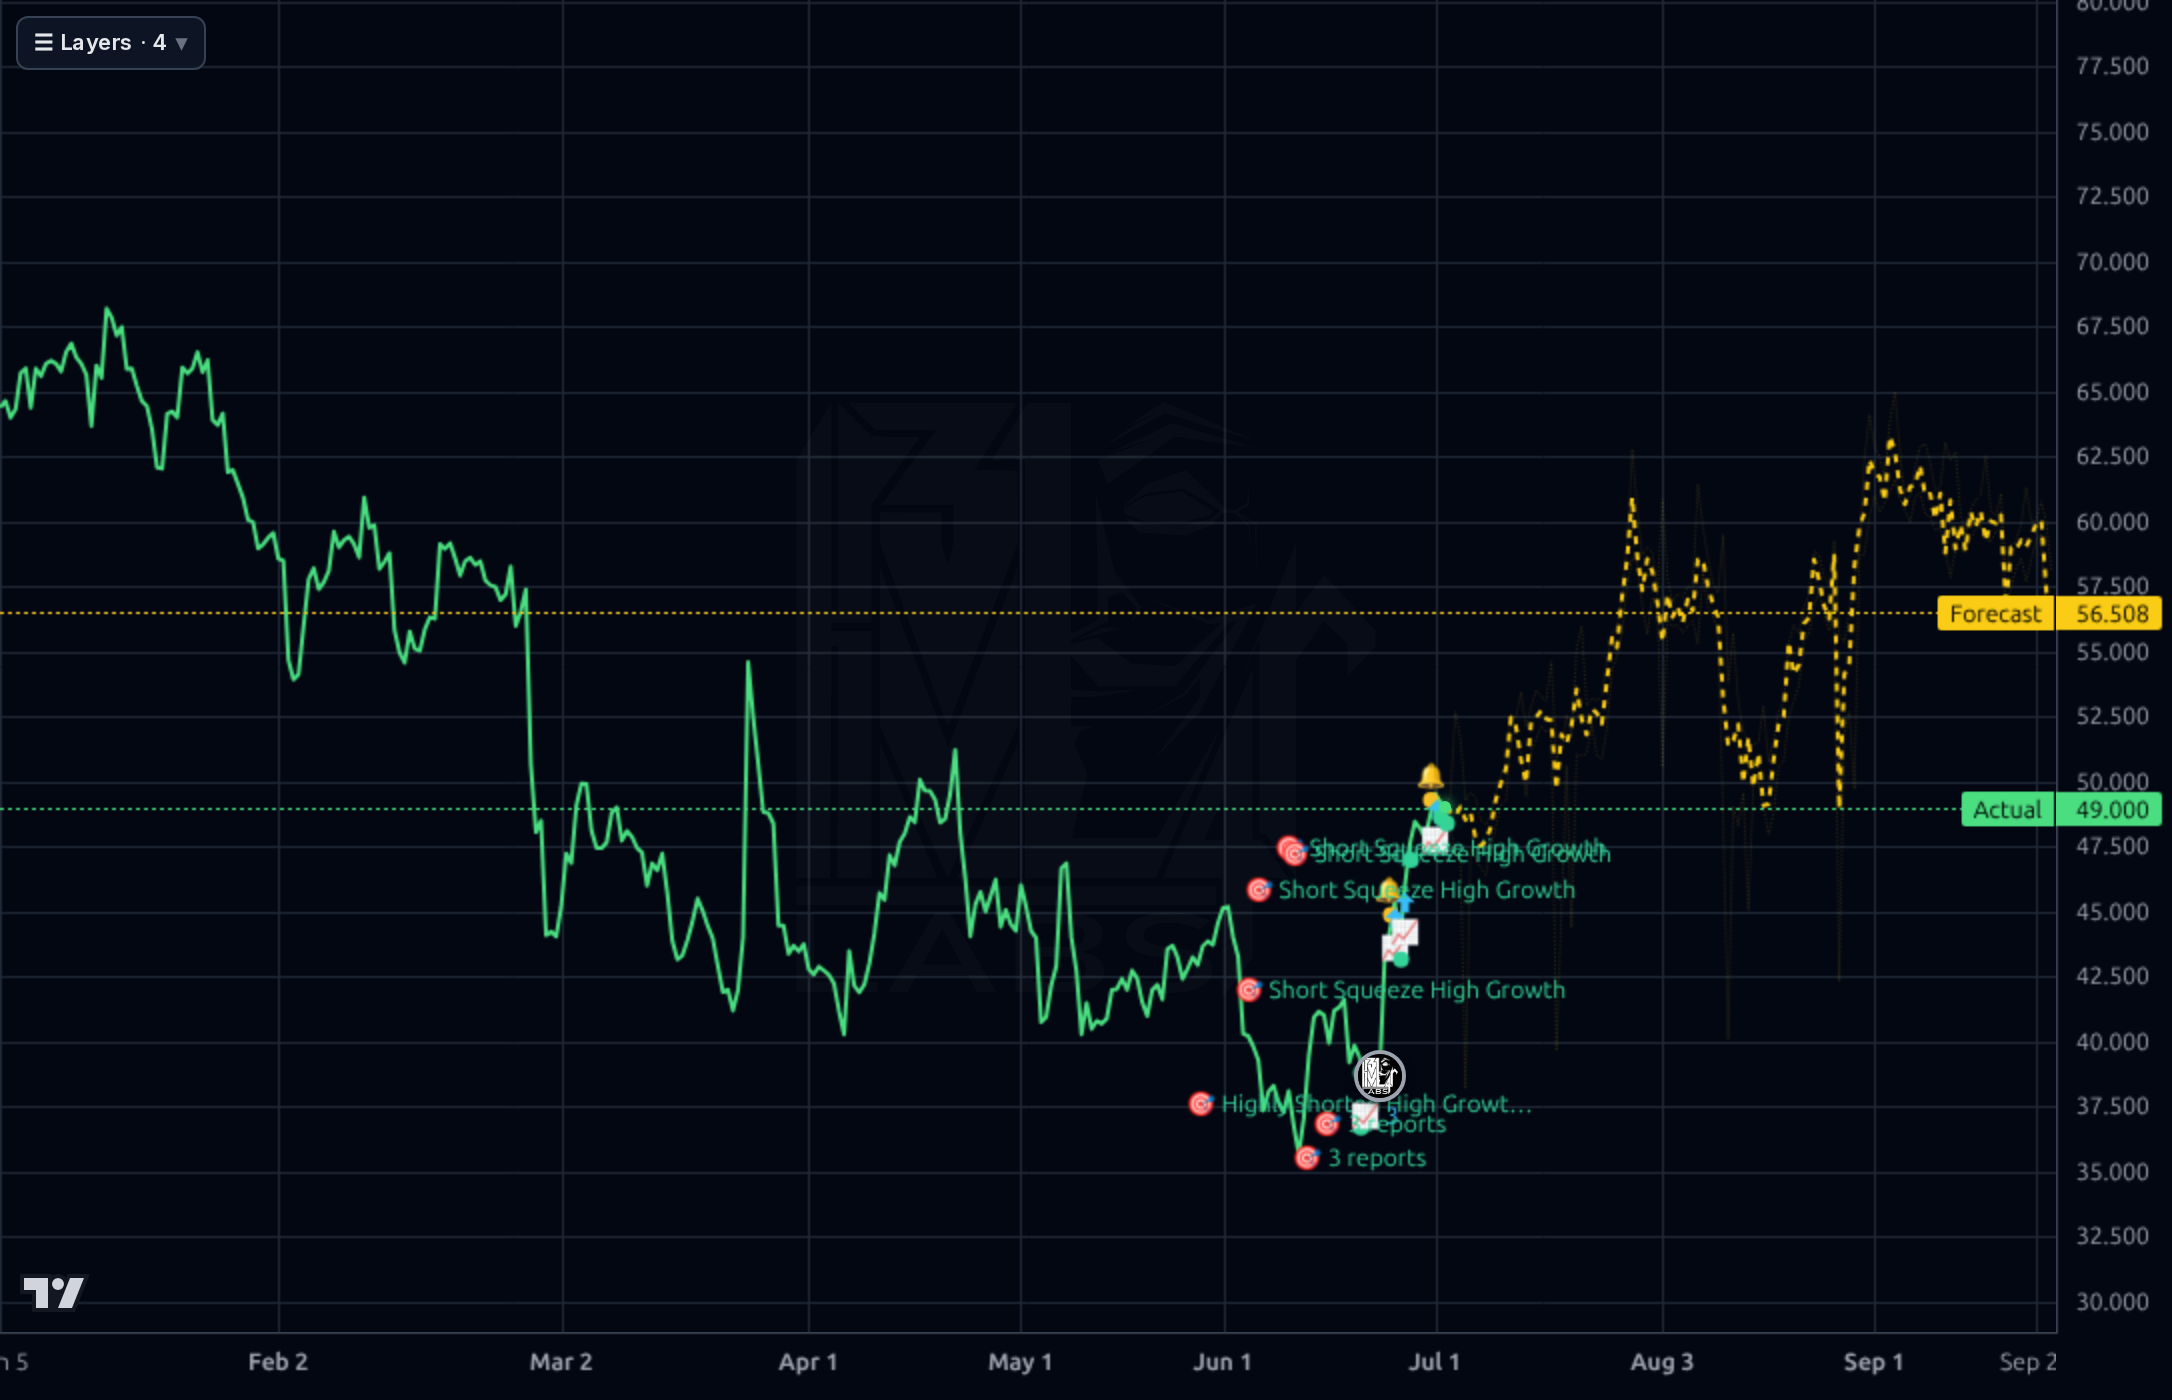
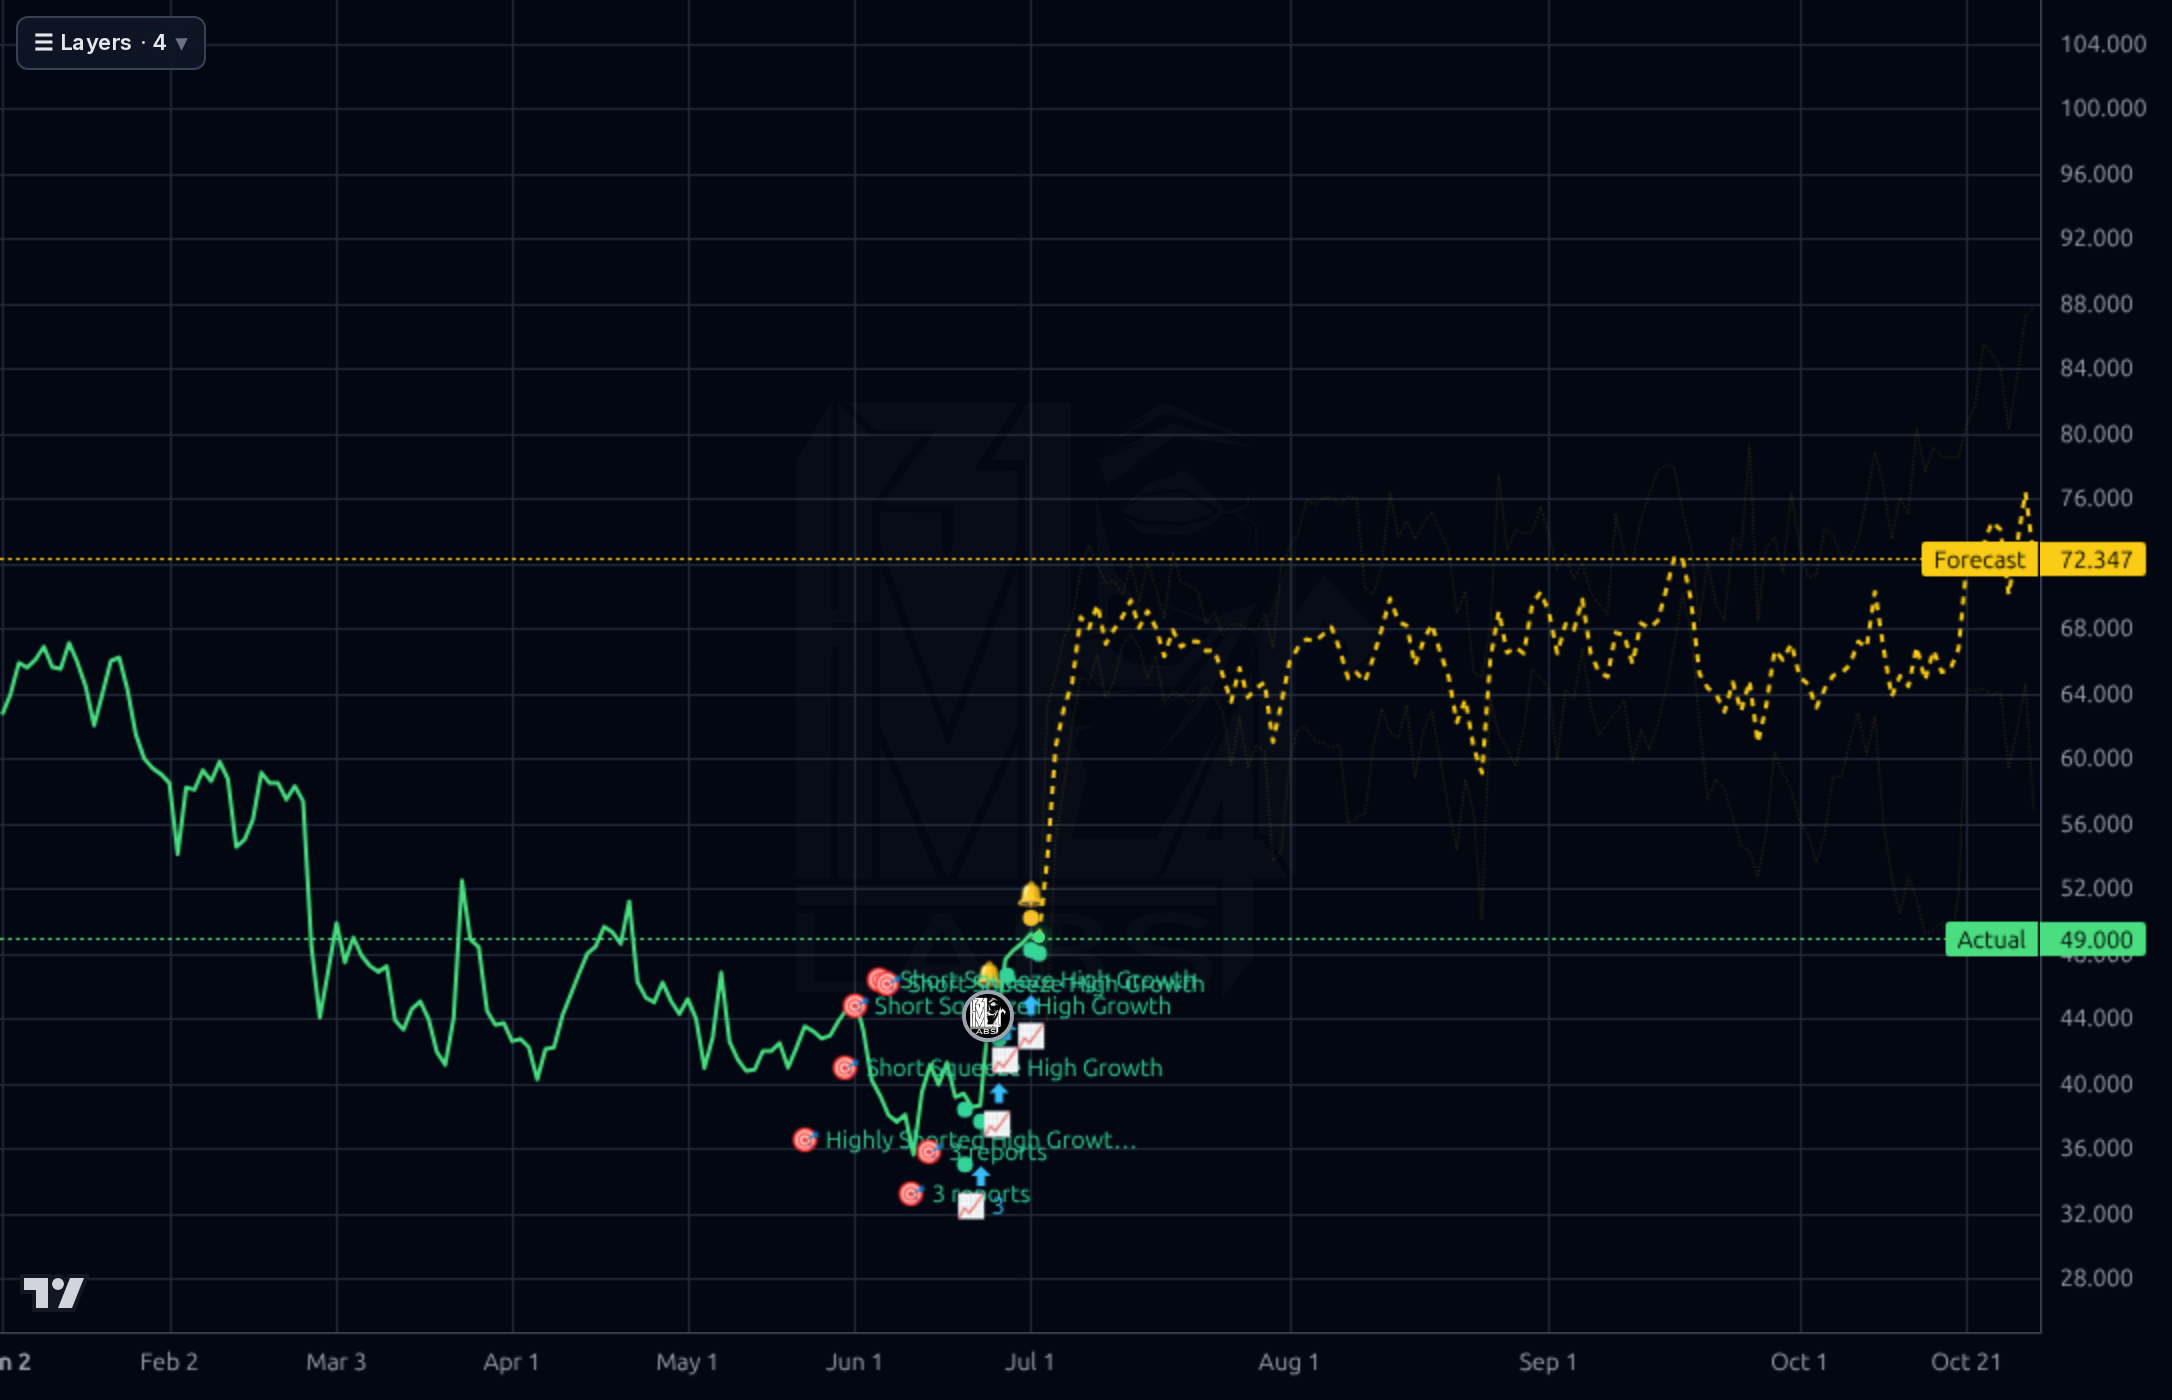
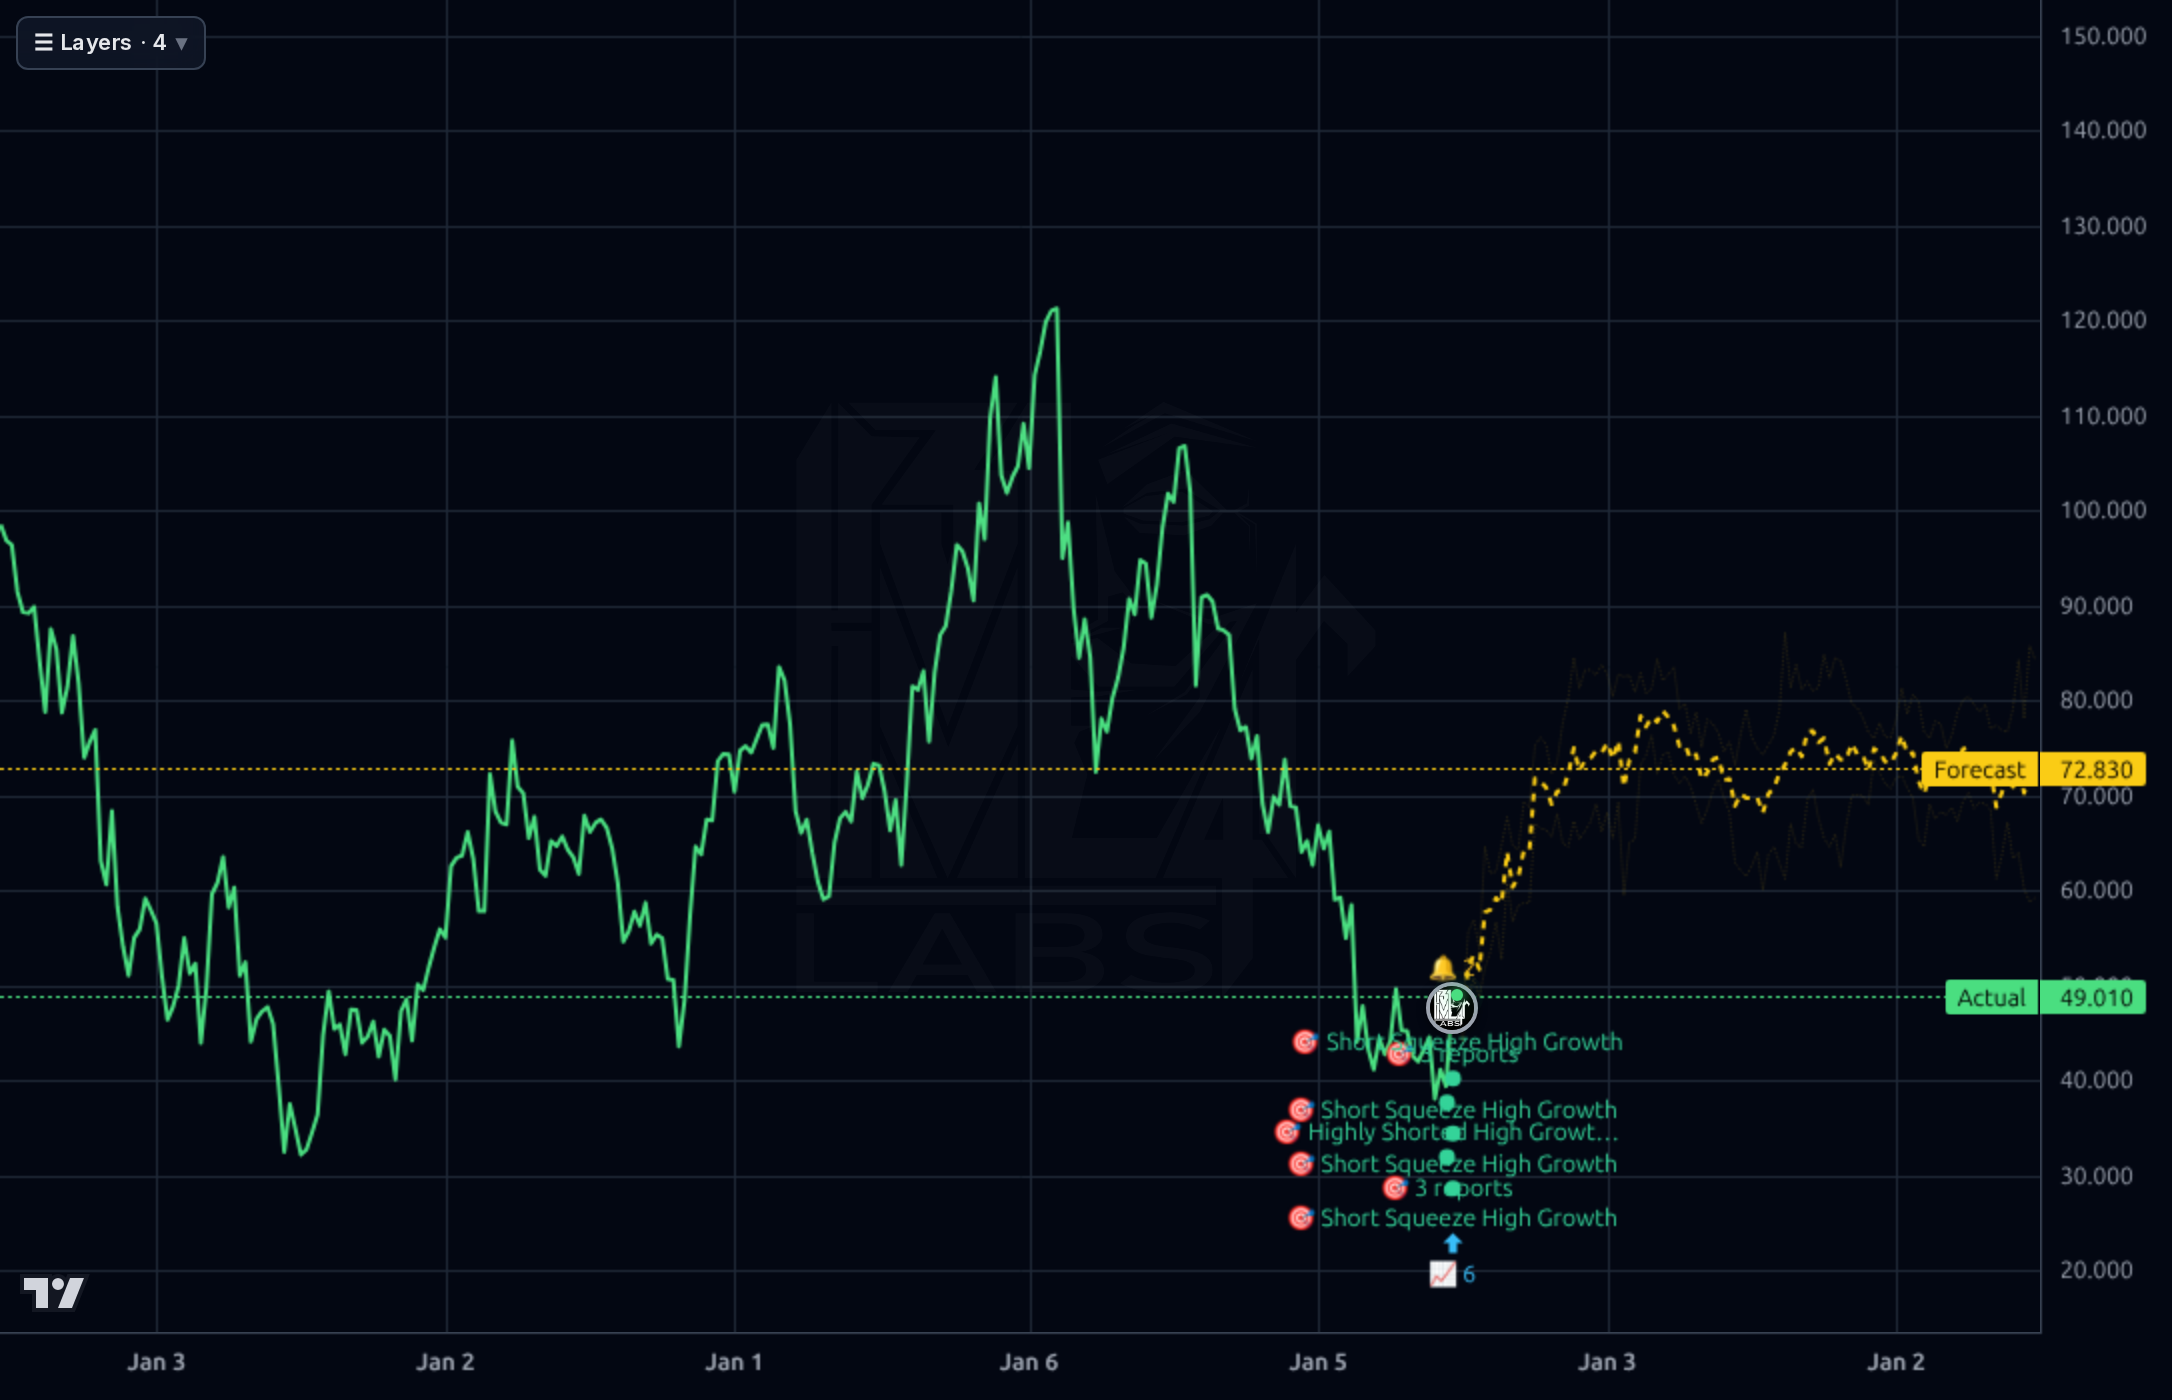
The 1h chart shows a powerful impulse from ~$36 on Jun 22 to ~$49 by Jul 1 (+36% in ~9 sessions), with the forecast band ($43.54) sitting well below spot — the model expects mean-reversion. The 4h chart confirms the reclaim of the multi-month downtrend, but the forecast projects a drift to ~$56.5 over 2 months, with the actual price now testing the underside of the prior distribution zone ($45-50) that acted as support before the March breakdown. The 1d chart contextualizes the move as a bounce off the $34.56 52-week low within a broader downtrend from $108.50 (-54.6% off high); the model's 1d forecast of $72 is aspirational and, per accuracy stats, its longer horizons are being beaten by the naive baseline — discount those. The 1wk chart shows the stock still trading at less than half its 2024 highs of ~$120. Momentum indicators are stretched: RSI 66.5, +18.8% above SMA20, +14.7% above SMA50, but still -15.3% below SMA200 — classic mean-reversion bounce within a bear structure. Perf Week +11.3%, Perf Month +8.8%, Perf Quarter +12.5%. Immediate resistance is $52 (prior breakdown shelf), then $58-60 (SMA200 confluence). Support: $46, then $42-43 (forecast anchor), then $38.
[Correction: 8 recent article(s) were provided — see the news.] The news flow is constructive but not transformative. Russell 1000 Value / Midcap Value index inclusion (Jun 27) is a genuine passive-flow tailwind and adds visibility, though Simply Wall St. frames it as a mismatch given FOUR's growth narrative. Multiple outlets (Simply Wall St., Yahoo, Zacks) flagged the 8.8% single-session surge and reasonable valuation post-50% drawdown, while Seeking Alpha's bullish 'experience economy' pitch cites Q4'25 revenue +32% YoY and an EPS beat. A comparative piece pits FOUR against PYPL, and the crowd on Stocktwits is 100% bullish (small sample, contrarian caution warranted). Signal: index inclusion + short interest + refinancing = squeeze fuel that's already largely paid out. Noise: sell-side comparisons and the 'World Cup catalyst' chatter — real but not yet in numbers. Nothing in the news changes the core question, which is whether Q2 margins recover.
- World Cup 2026 processing volumes flagged by retail crowd and consistent with SkyTab Venue positioning in stadium/venue segment — potential Q3-Q4 volume kicker
- International expansion driving Sales Q/Q +32.2% and TTM Sales Y/Y +28.3% — continued mix shift toward higher-growth geographies
- Russell 1000 Value / Midcap Value index inclusion (Jun 27, 2026) — passive flow tailwind and improved institutional visibility (Inst Own already 91.2%)
- Proactive debt refinancing announced — potential interest expense reduction and covenant relief improving FCF conversion
- SkyTab POS / Lighthouse cross-sell into existing merchant base — software attach increases take rates and merchant stickiness
- Analyst forward EPS estimate of $6.75 implies substantial earnings recovery vs TTM $0.87 — mgmt guidance on this path is the key Aug 4 catalyst
- Q1'26 operating margin compression to 4.46% (from 10.2% in Q4'25) — if not reversed on Aug 4, thesis breaks
- Balance sheet leverage: $4.58B debt vs $1.65B equity (D/E 2.77); cash drawn from $3.03B to $473M in three quarters
- Short float 29.9% (+3.3pp in 45d) — squeeze fuel that has largely fired; unwind risk if fundamentals disappoint
- Competitive pressure from Stripe, Adyen, Toast, PayPal on core payment verticals — potential structural margin ceiling
- Technical resistance at $52 with RSI 66.5 and SMA20 stretched +18.8% — momentum exhaustion into earnings
- Stock still -54.6% from 52-week high of $108.50 and -49.6% YoY — the primary trend is not yet clearly broken
- Model directional accuracy (74% 1d, 67% 1wk) is below or at naive baseline — discount its bullish signal
- Historical EPS volatility (EPS Y/Y TTM -72.4%) creates asymmetric earnings-print risk
Get AI analysis on any stock
This is one of hundreds of Kronos AI reports — scored fundamentals & technicals, bull/base/bear price targets, a multi-horizon plan, and continuously-updated forecasts across the market. Create a free account to explore them all.
Create your free account →Already a member? Sign in · Join our Discord