FOUR — AI Stock Forecast & Price Targets
Published 8/10/2026 · A free sample of K3vl4r’s AI-powered analysis.
Kronos price forecasts, scored fundamentals & technicals, and a multi-horizon plan.
View the live FOUR price forecast →
Shift4's Q2 revenue beat (34% YoY growth to $1.3B) is offset by margin compression and guidance cuts, creating a high-growth/deep-value tension. The stock trades at deep-value multiples but faces structural risks from integration costs and macro headwinds. Technicals show consolidation near $40 with weak momentum.
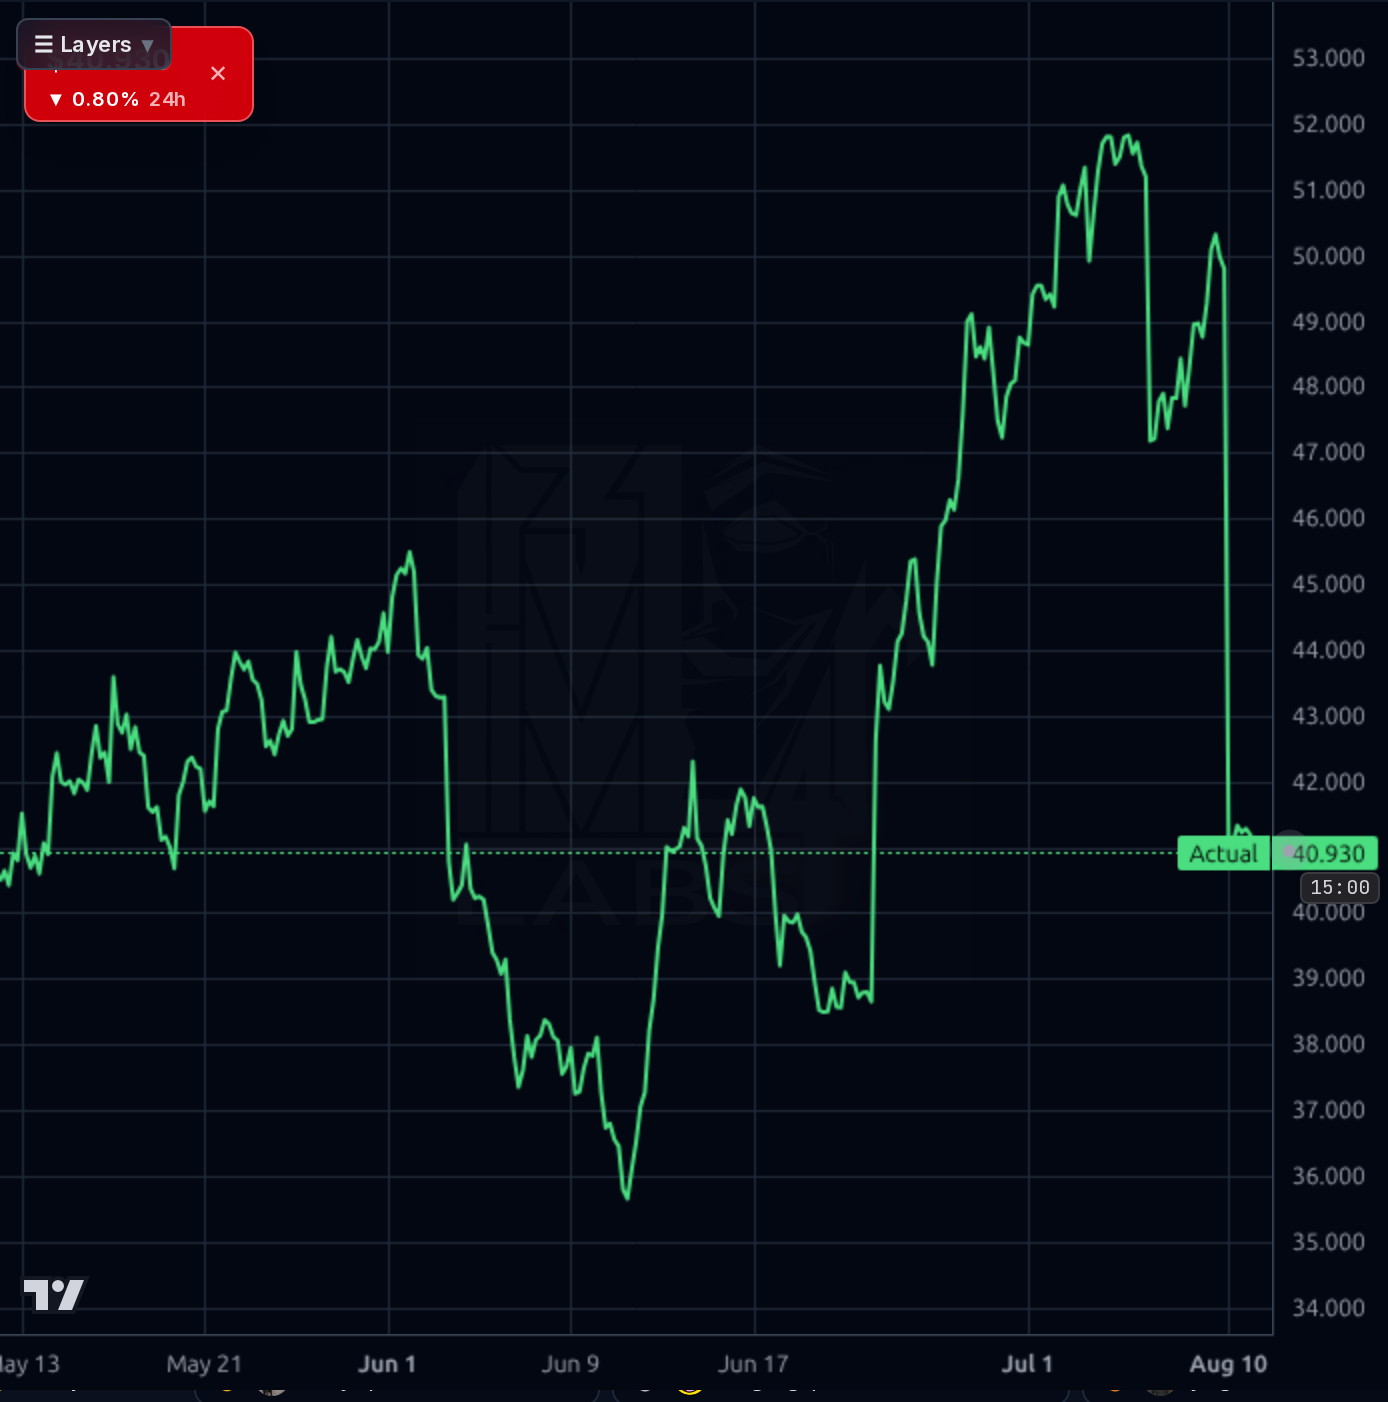
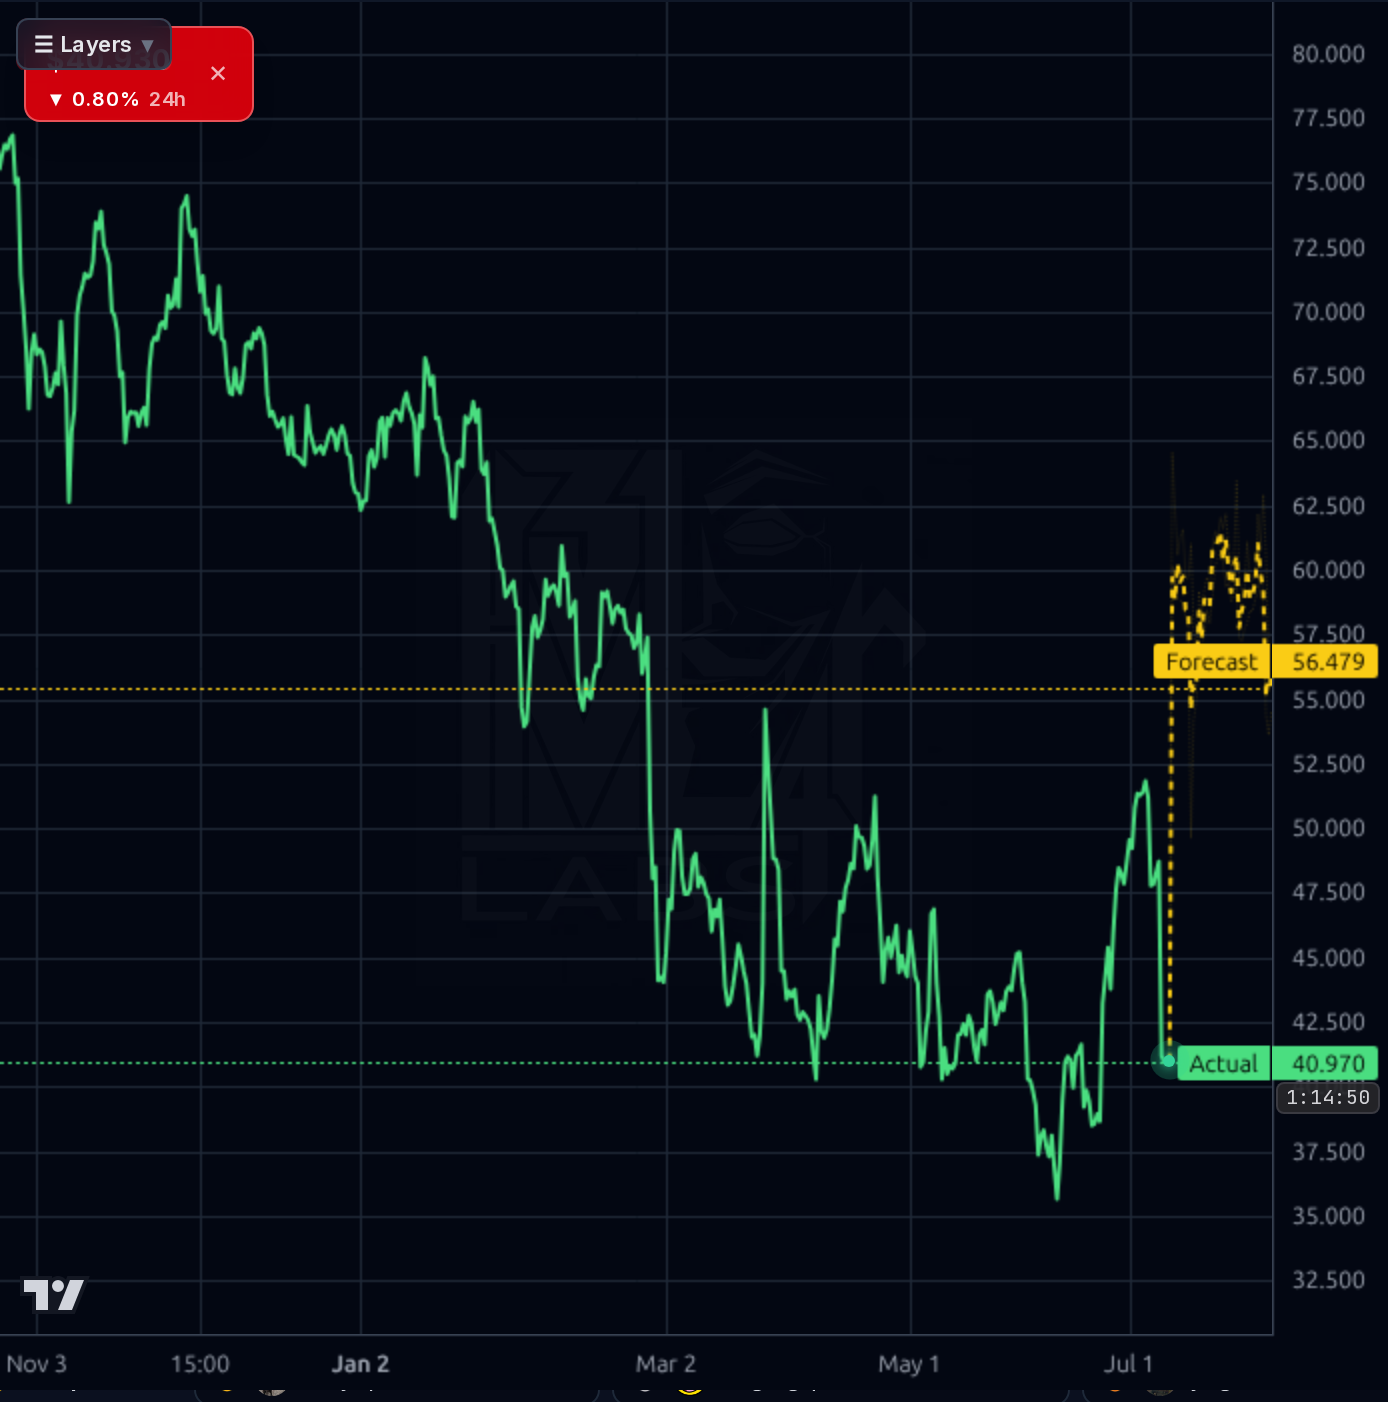
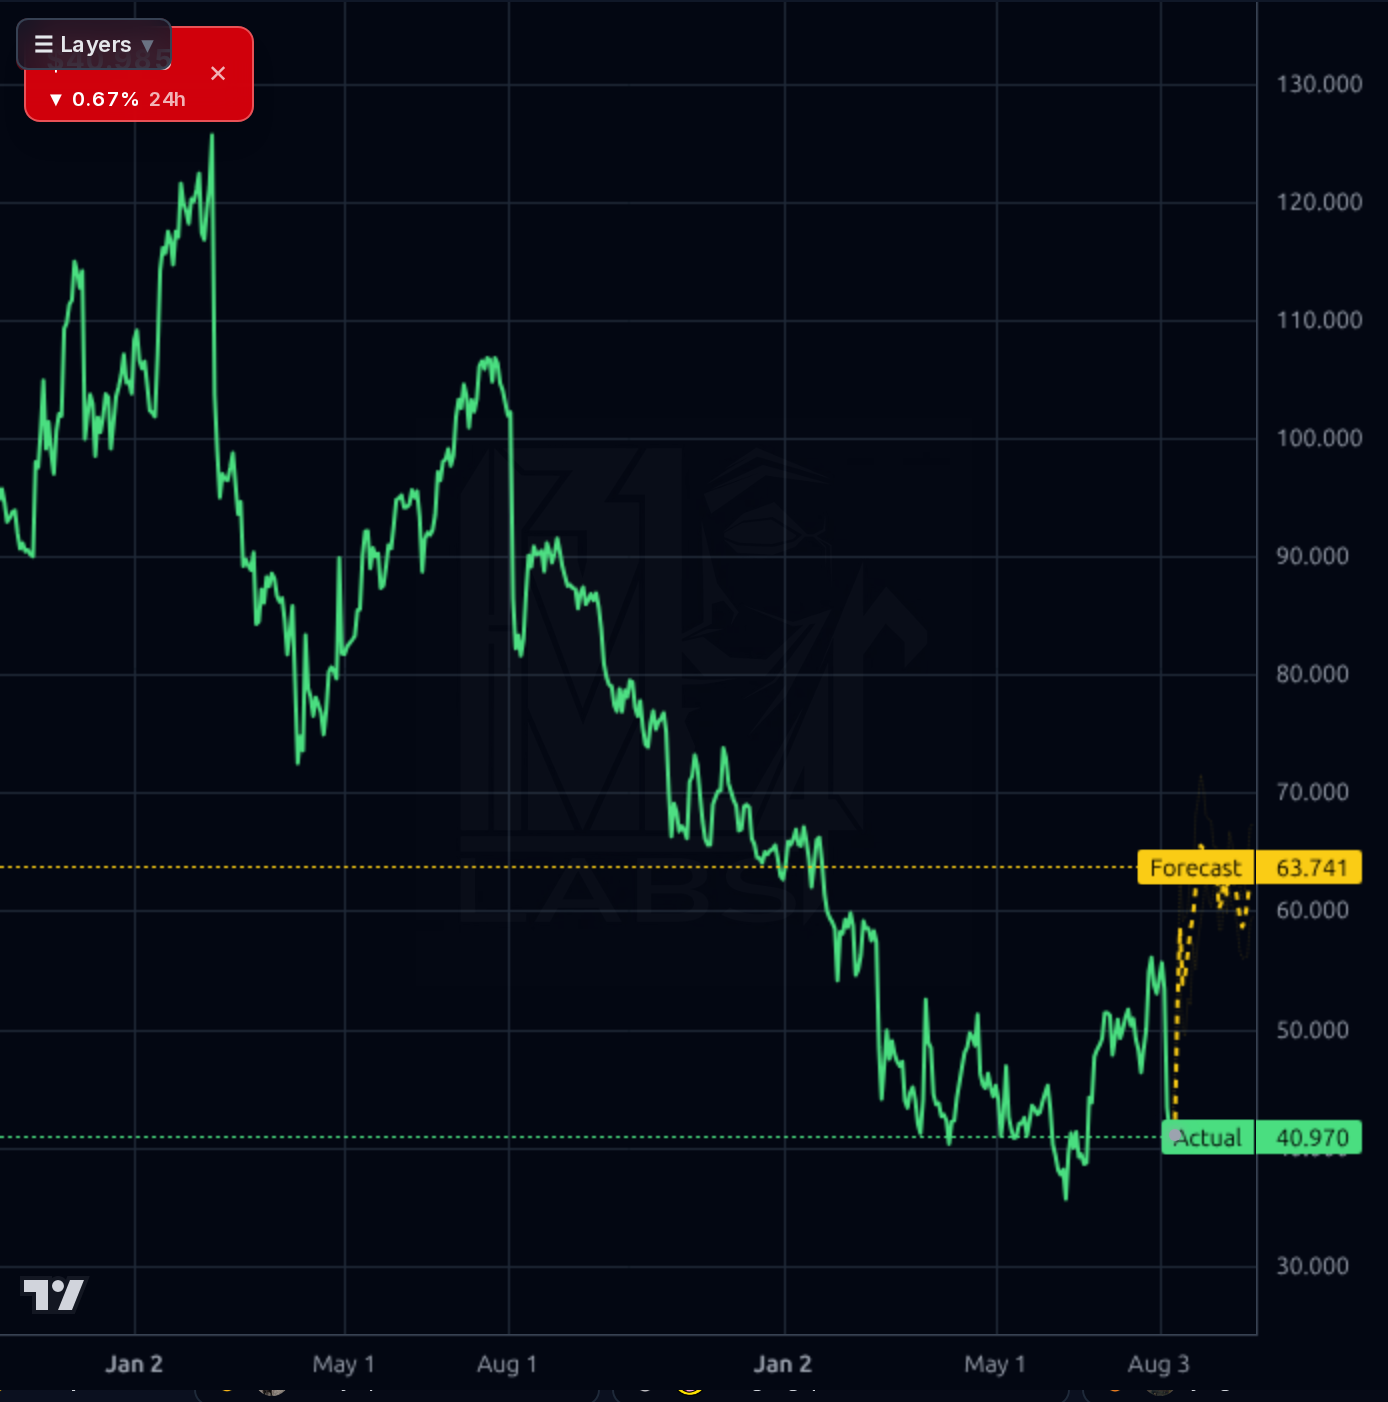
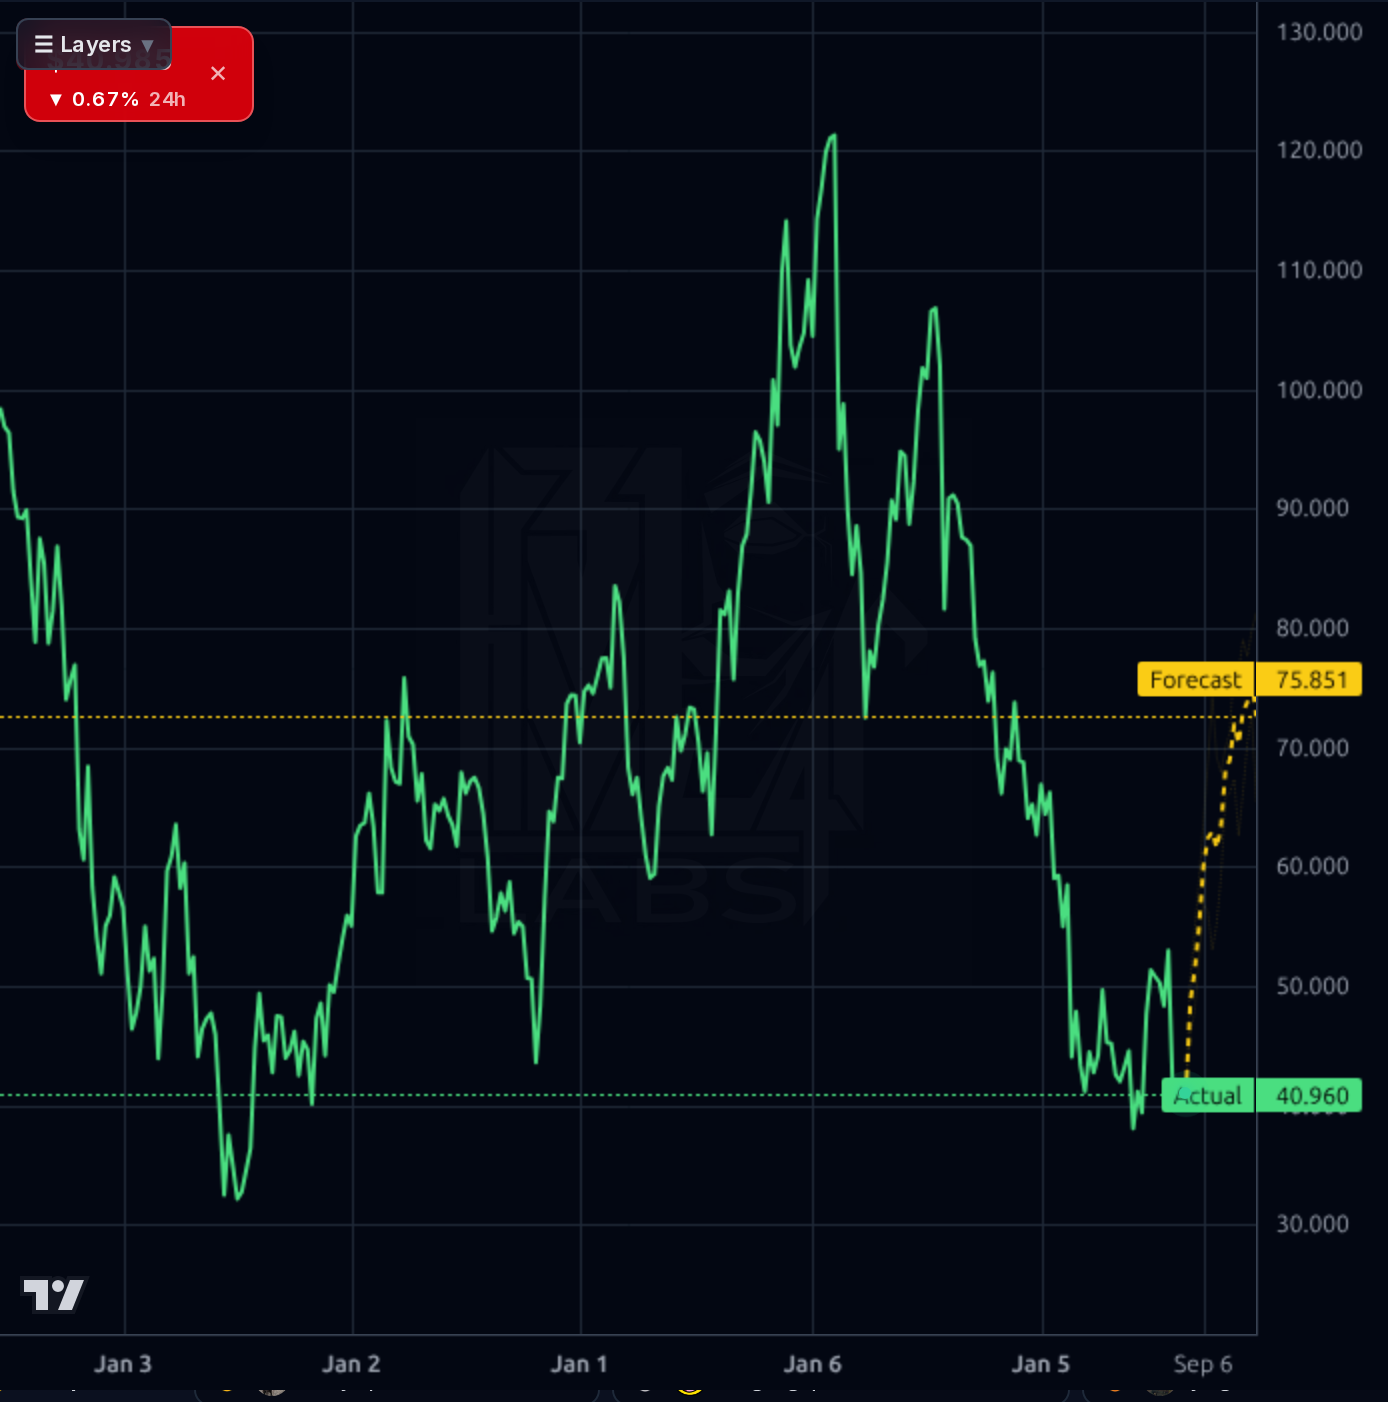
Hold near $41.26; invalidation below $34.56 (52-week low). Monitor for short-squeeze mechanics but expect consolidation due to weak momentum. No sizing change unless guidance improves or technical breakout occurs.
Accumulate if operating margins rebound above 8% by Q4, targeting $50-$55. Catalysts include Global Blue integration progress and software cross-sell growth. Invalidation is sustained margin compression below 6% or further debt issuance.
Terminal thesis: Shift4 could become a high-margin payments leader with 12-15% operating margins by 2027, driven by Lighthouse/SkyTab adoption. Structural risk is persistent macro headwinds and integration costs delaying margin recovery beyond 2026.
Revenue growth remains strong (Q2 revenue up 34% YoY to $1.3B), but operating margins collapsed to 7.3% in Q2 from a prior low of 4.5% in Q1, indicating margin compression risk. The balance sheet shows high leverage ($4.58B debt vs $1.65B equity) and negative cash flow (-$9M in Q2), though free cash flow has improved to $353.5M annually. Capital allocation is constrained by integration costs for Global Blue, with no clear path to margin recovery beyond the current quarter. The company's forward P/E of 6.3x suggests deep-value optics but is undermined by persistent margin pressure and high debt.
The chart shows a downtrend from $92.79 to $41.26 over 18 months, with recent consolidation near $40. The forecast band (yellow) indicates a potential rebound to $53.74 but is constrained by technical resistance at $40.96 and $40.970. RSI of 35.93 suggests oversold conditions but weak momentum due to the guidance cut, with no clear breakout above $52 resistance. The model's forecast accuracy is low (MAPE 26% for 1d), indicating unreliable near-term signals.
Q2 results beat revenue expectations but missed on full-year guidance due to Middle East travel disruption and FX headwinds, triggering a ~22% one-week drawdown. Analysts cut targets (Raymond James to $51 from $60, UBS to $52 from $60), while the stock trades at 7x forward P/E with high short interest (28.05%). The company's strong top-line growth is offset by margin compression and debt concerns, creating a binary thesis on whether margins can recover.
- Global Blue acquisition unlocks $1.3B cross-border VAT refund TAM with Shift4 One rollout
- Lighthouse software adoption driving gross margins toward 45% by 2027
- Margin compression risk from Global Blue integration costs and macro headwinds
- High leverage ($4.58B debt) limiting operational flexibility
- Technical resistance at $52 unbroken, preventing upside momentum
Get AI analysis on any stock
This is one of hundreds of Kronos AI reports — scored fundamentals & technicals, bull/base/bear price targets, a multi-horizon plan, and continuously-updated forecasts across the market. Create a free account to explore them all.
Create your free account →Already a member? Sign in · Join our Discord