
FOUR— AI Stock Forecast & Price Targets
Published 6/18/2026 · A free sample of K3vl4r’s AI-powered analysis.
Kronos price forecasts, scored fundamentals & technicals, and a multi-horizon plan.
View the live FOUR price forecast →
Shift4 Payments (FOUR) trades at $39.17, down ~58% YoY and ~64% off its 52-week high of $108.50, despite delivering 28% TTM revenue growth and $488M in free cash flow. The setup is a classic value-vs-broken-momentum debate: forward P/E of 5.8x and PEG of 0.39 look compelling against a leveraged balance sheet (Debt/Eq 2.77, $4.58B debt), decelerating Q1 margins, and a 26.6% short float signaling deep skepticism — Kronos forecasts mean-reversion higher but historical directional accuracy at this horizon is poor.
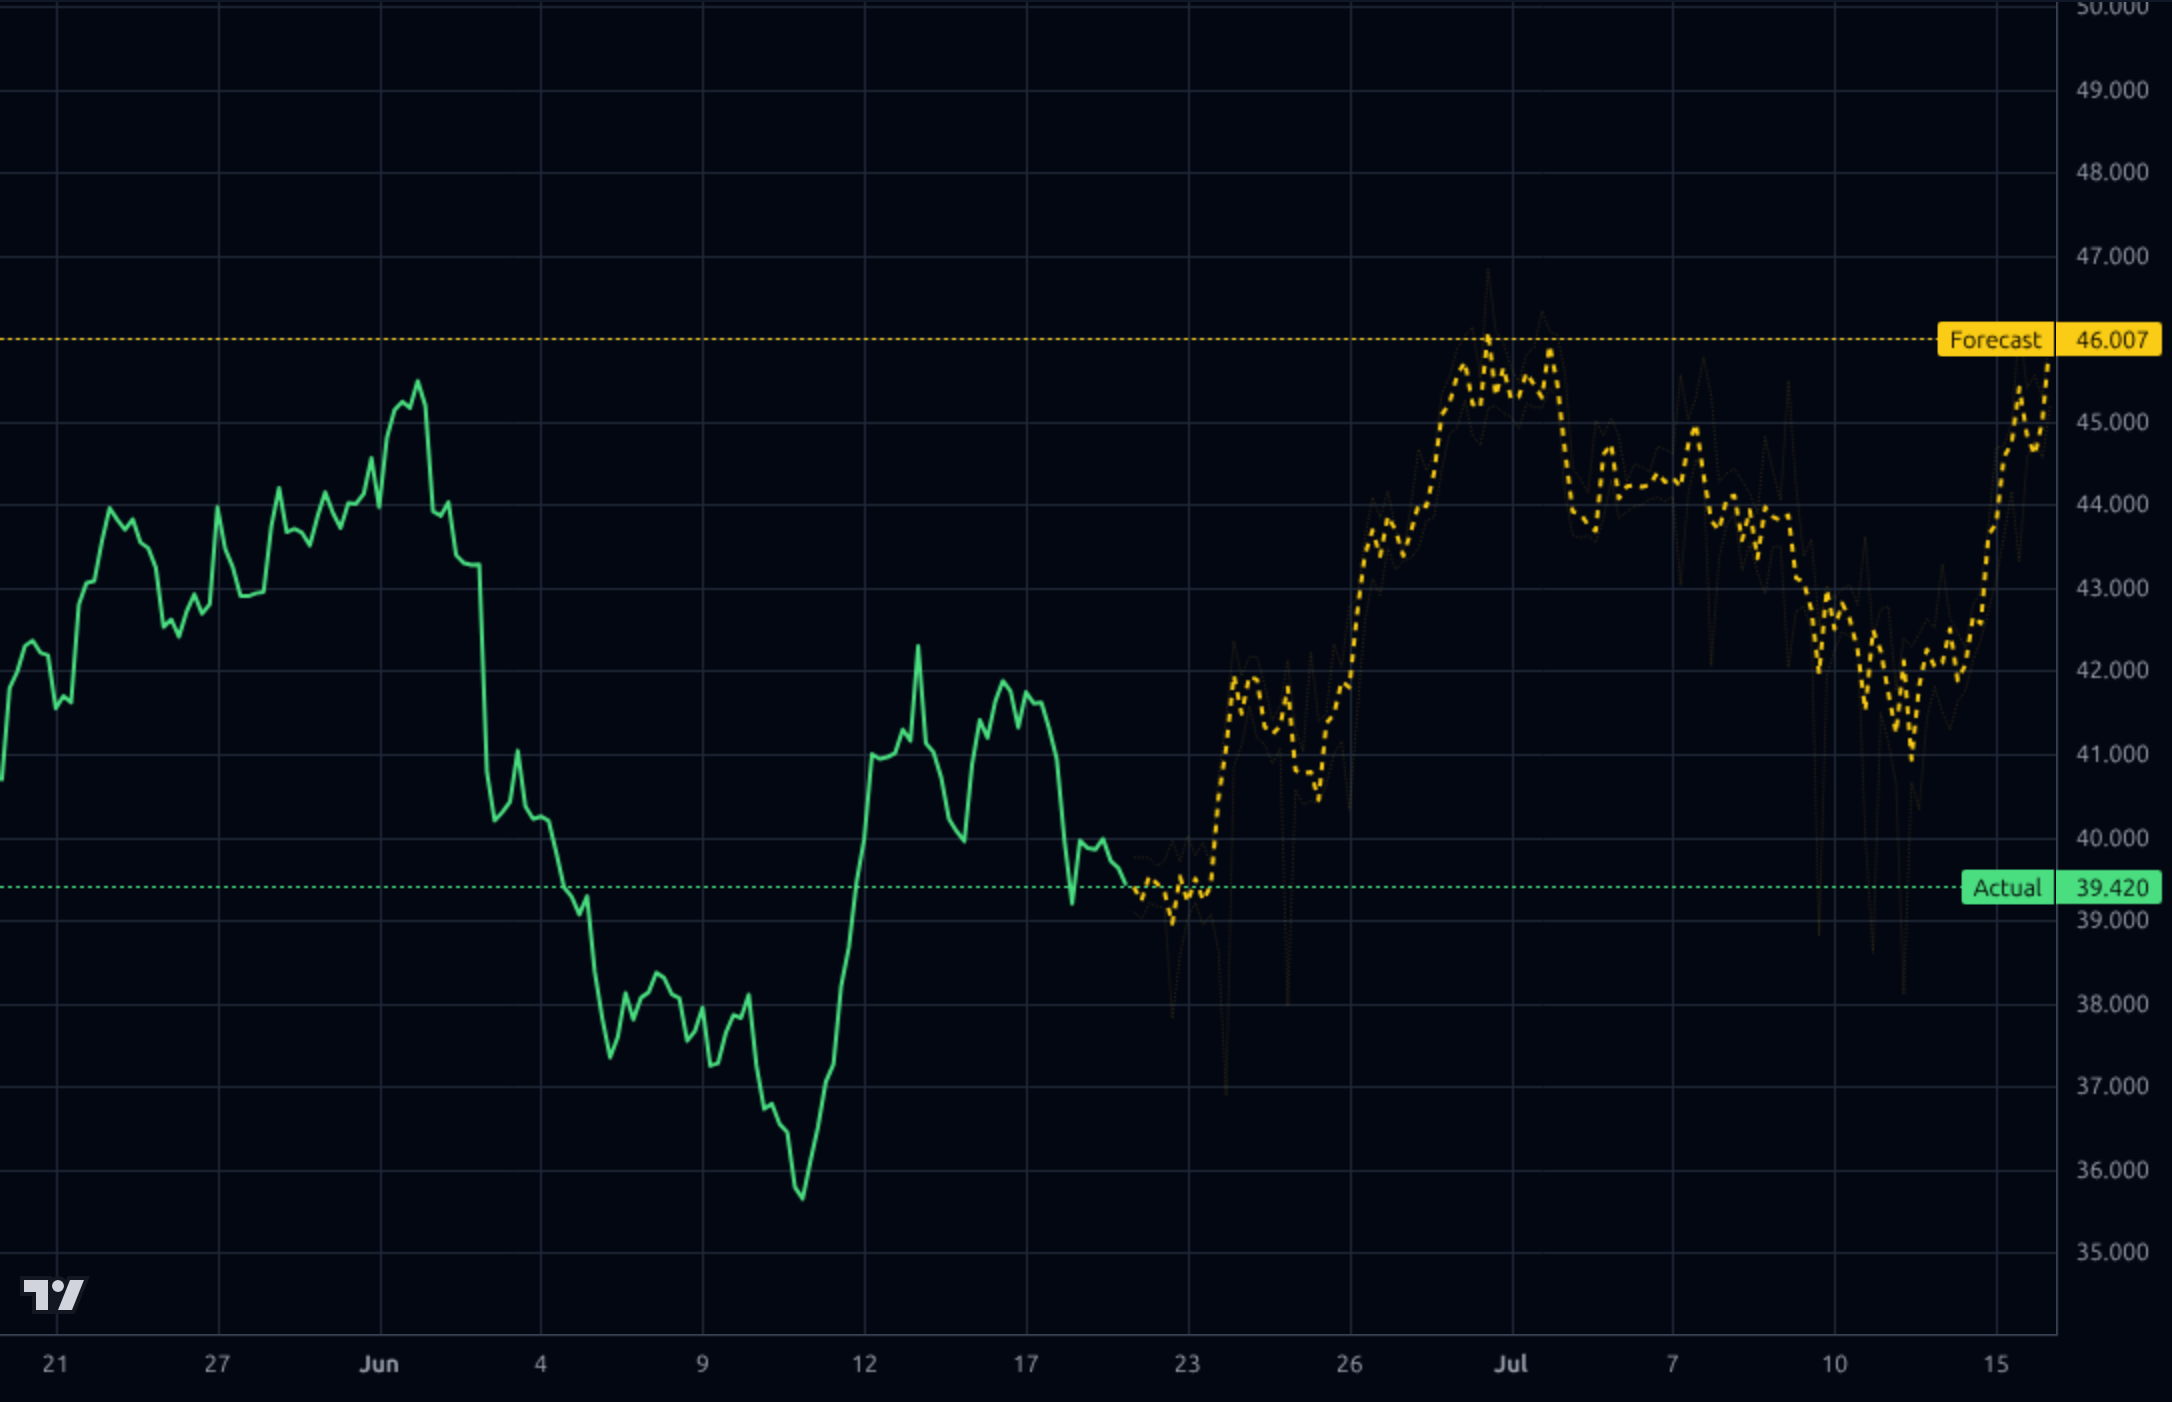
1-4 week view: Tactical long bias on the bounce off $35.6 with stop below $34.50 (52-week low). The 26.6% short float plus near-term Kronos bullish signal (1h 46.0, probability 1.0) sets up a possible squeeze toward the $42-46 resistance zone. Size small (1-2% of book) given model accuracy is only 20% directional. Invalidation: daily close below $34.50 takes the thesis to the bear case.
1-6 month view: HOLD/ACCUMULATE on weakness. Forward P/E of 5.8x and analyst target $59.52 (+52%) imply the market is pricing in either a guide-down or sustained margin compression. The Q2 2026 print (May earnings already past; next print in Aug) is the key catalyst — needs to show operating margin recovery back toward the 9-10% Q3/Q4 2025 range. Expected return range: -15% to +40%. What changes my mind: another quarter of <5% operating margin or any debt covenant commentary.
1-3 year view: The bull case rests on Shift4 becoming a genuine global Experience Economy payments platform, leveraging World Cup-class venue wins and international M&A into operating leverage. With sales 3/5Y CAGR of 28%/40%, even modest margin normalization back to 10% on $6B+ revenue would justify a $70-90 stock. The biggest structural risk is the $4.58B debt load colliding with higher-for-longer rates and an integration miss — leveraged rollups can unwind violently. ROIC of 1.87% must improve materially to validate the strategy.
Top-line growth is real: TTM revenue is $4.45B with Sales Y/Y TTM +28.3% and Sales Q/Q +32.2%, and the most recent quarter (Q1 2026) printed $1.121B in revenue. However, profitability has clearly degraded sequentially — Q1 2026 net income collapsed to $15M (1.34% net margin) from $40.2M in Q4 2025 and operating income fell to $50M (4.5% op margin) from $121.3M, driving the headline EPS Q/Q of -106.81%. Gross margin reported by Finviz at 27.74% is well below the trailing 35.1% Yahoo figure, suggesting mix/integration pressure. The balance sheet is the bigger concern: total debt of $4.58B against just $473M cash (down from $3.03B in June 2025 and $1.51B in September 2025) implies aggressive M&A spend — consistent with the news flow about international acquisitions. Debt/equity of 2.77 and EV/EBITDA of 8.2x are elevated for a company whose ROIC is only 1.87% and ROE 9.4%. The bright spot is cash generation: $488M TTM FCF, P/FCF of 5.86x, and Q1 FCF of $63M despite heavier capex ($71M). Capital allocation is clearly tilted toward growth-by-acquisition rather than deleveraging or returns — a binary bet on integration execution.
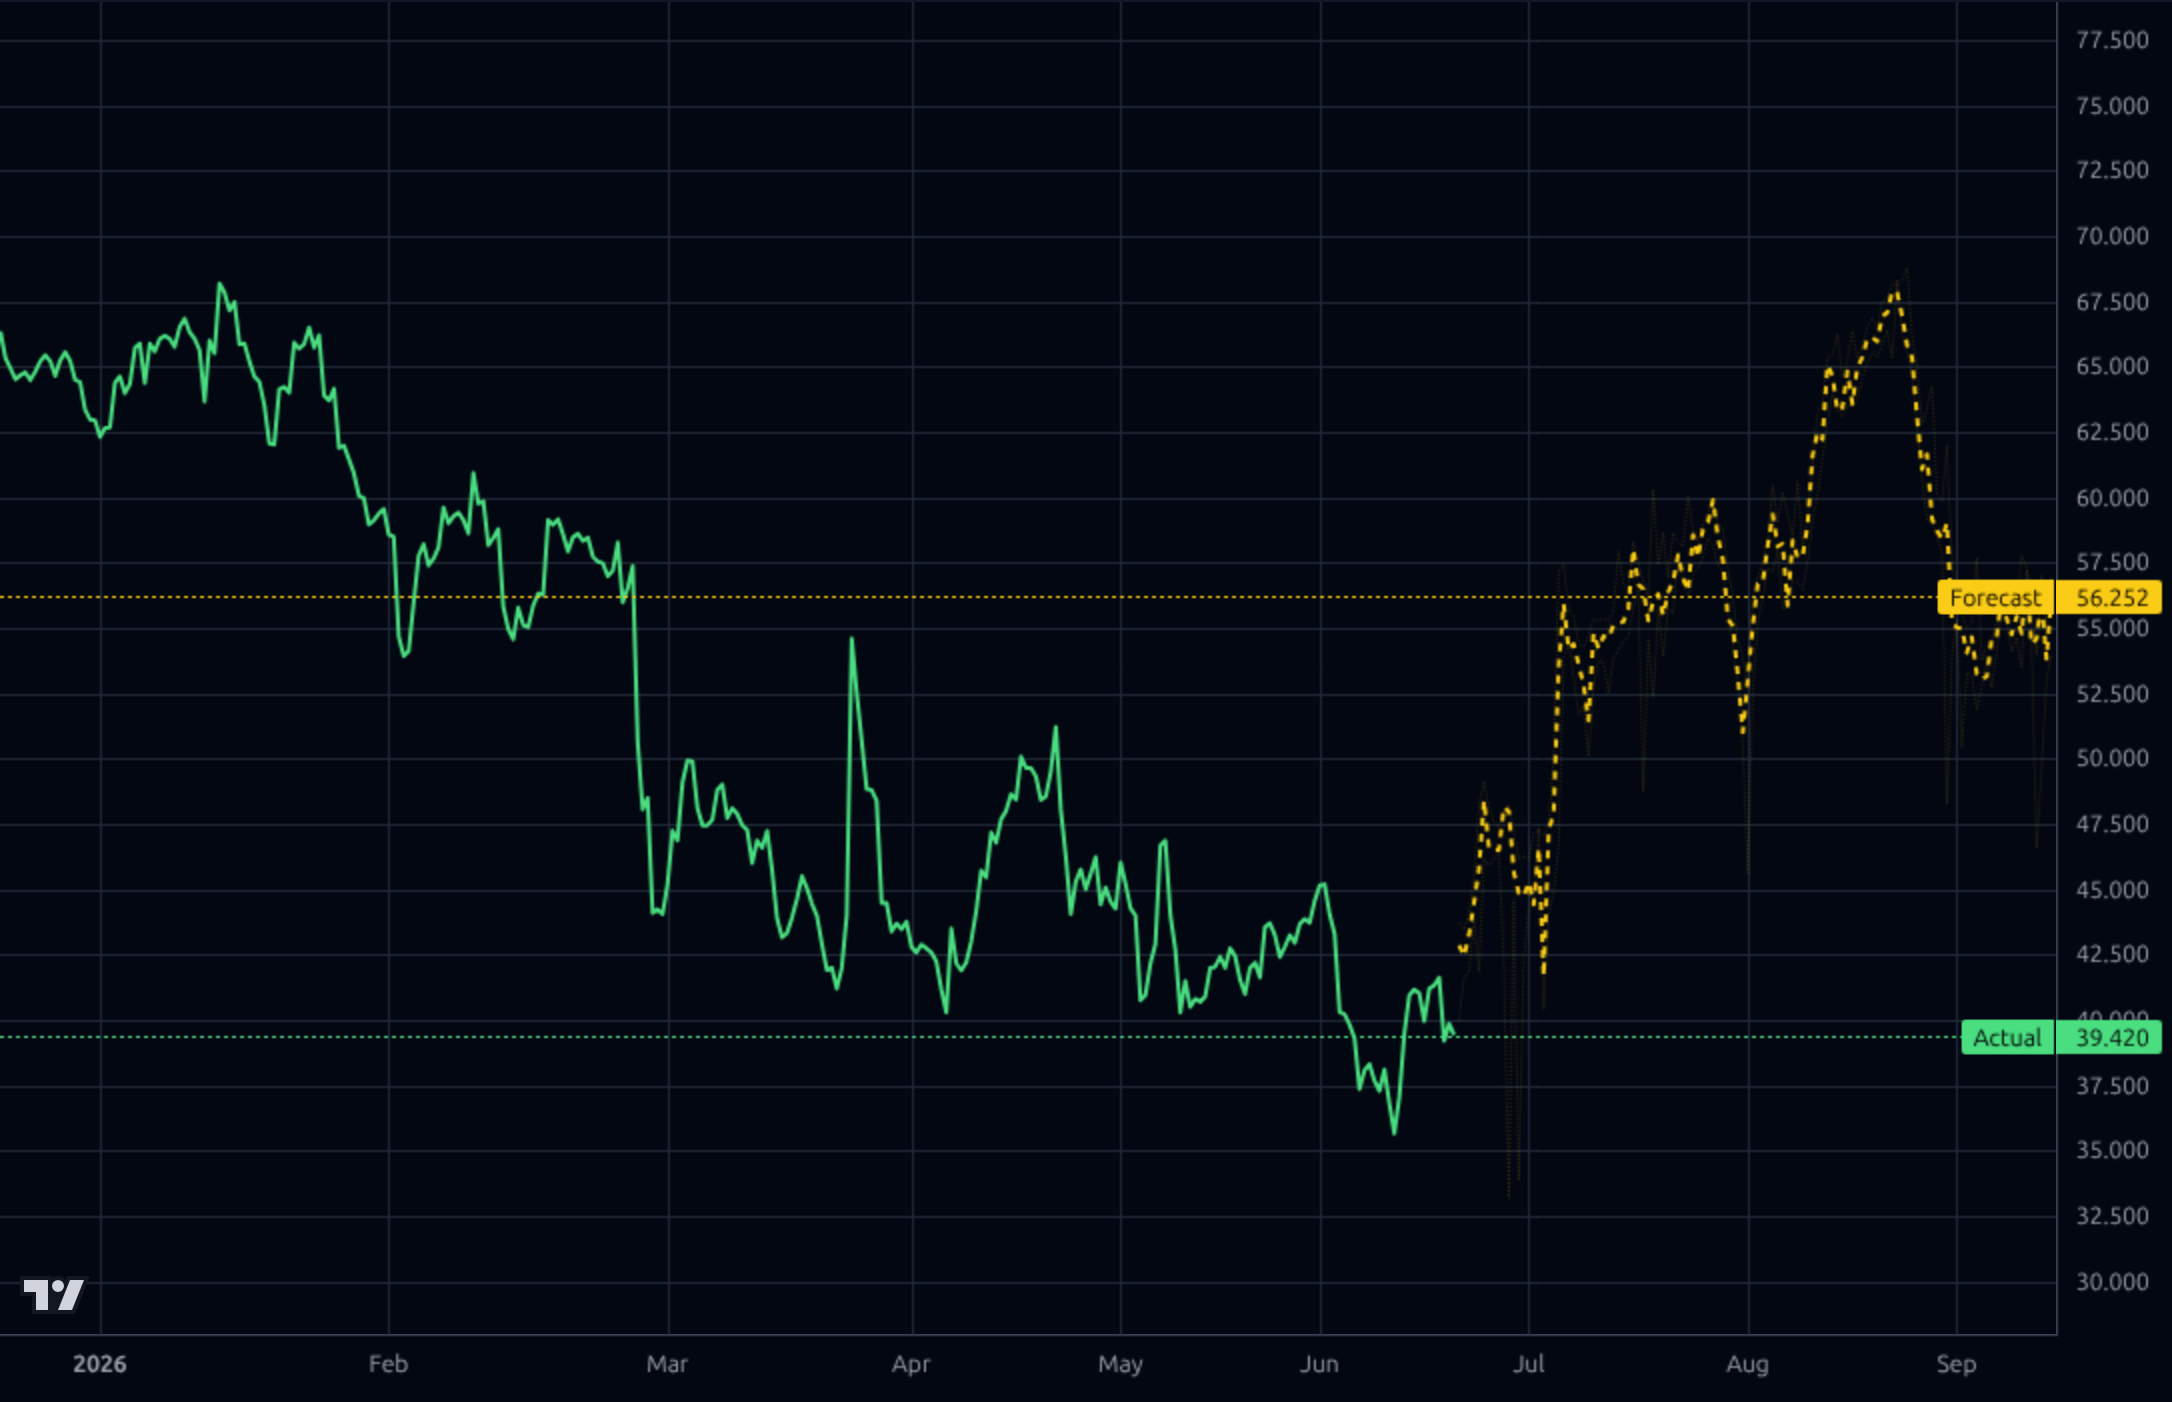
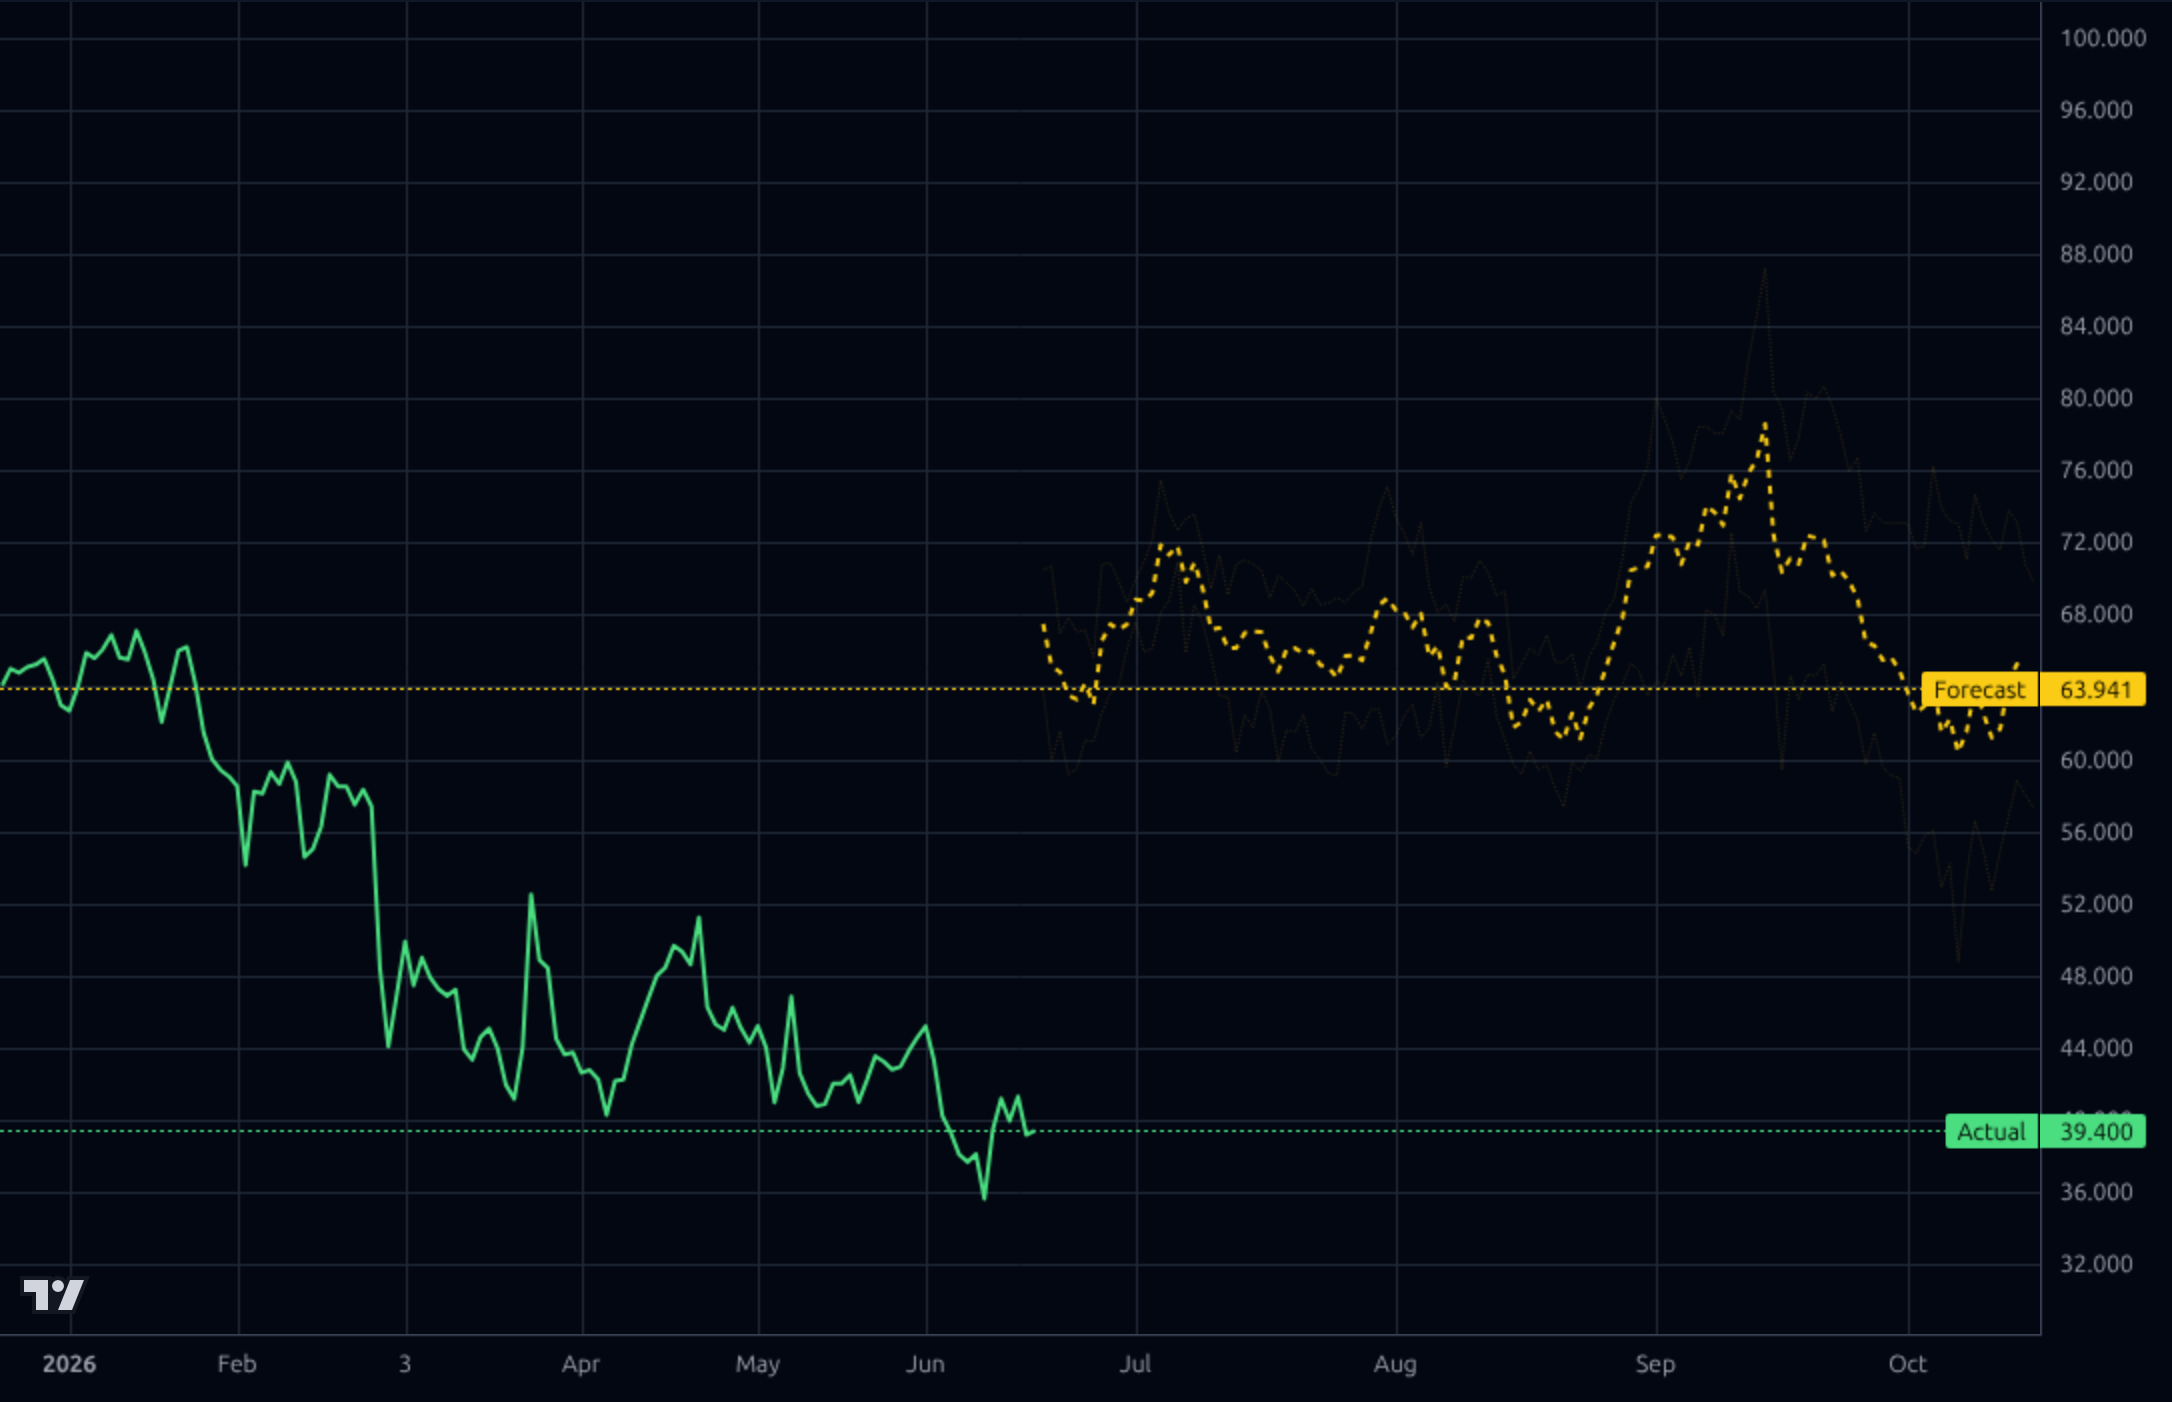
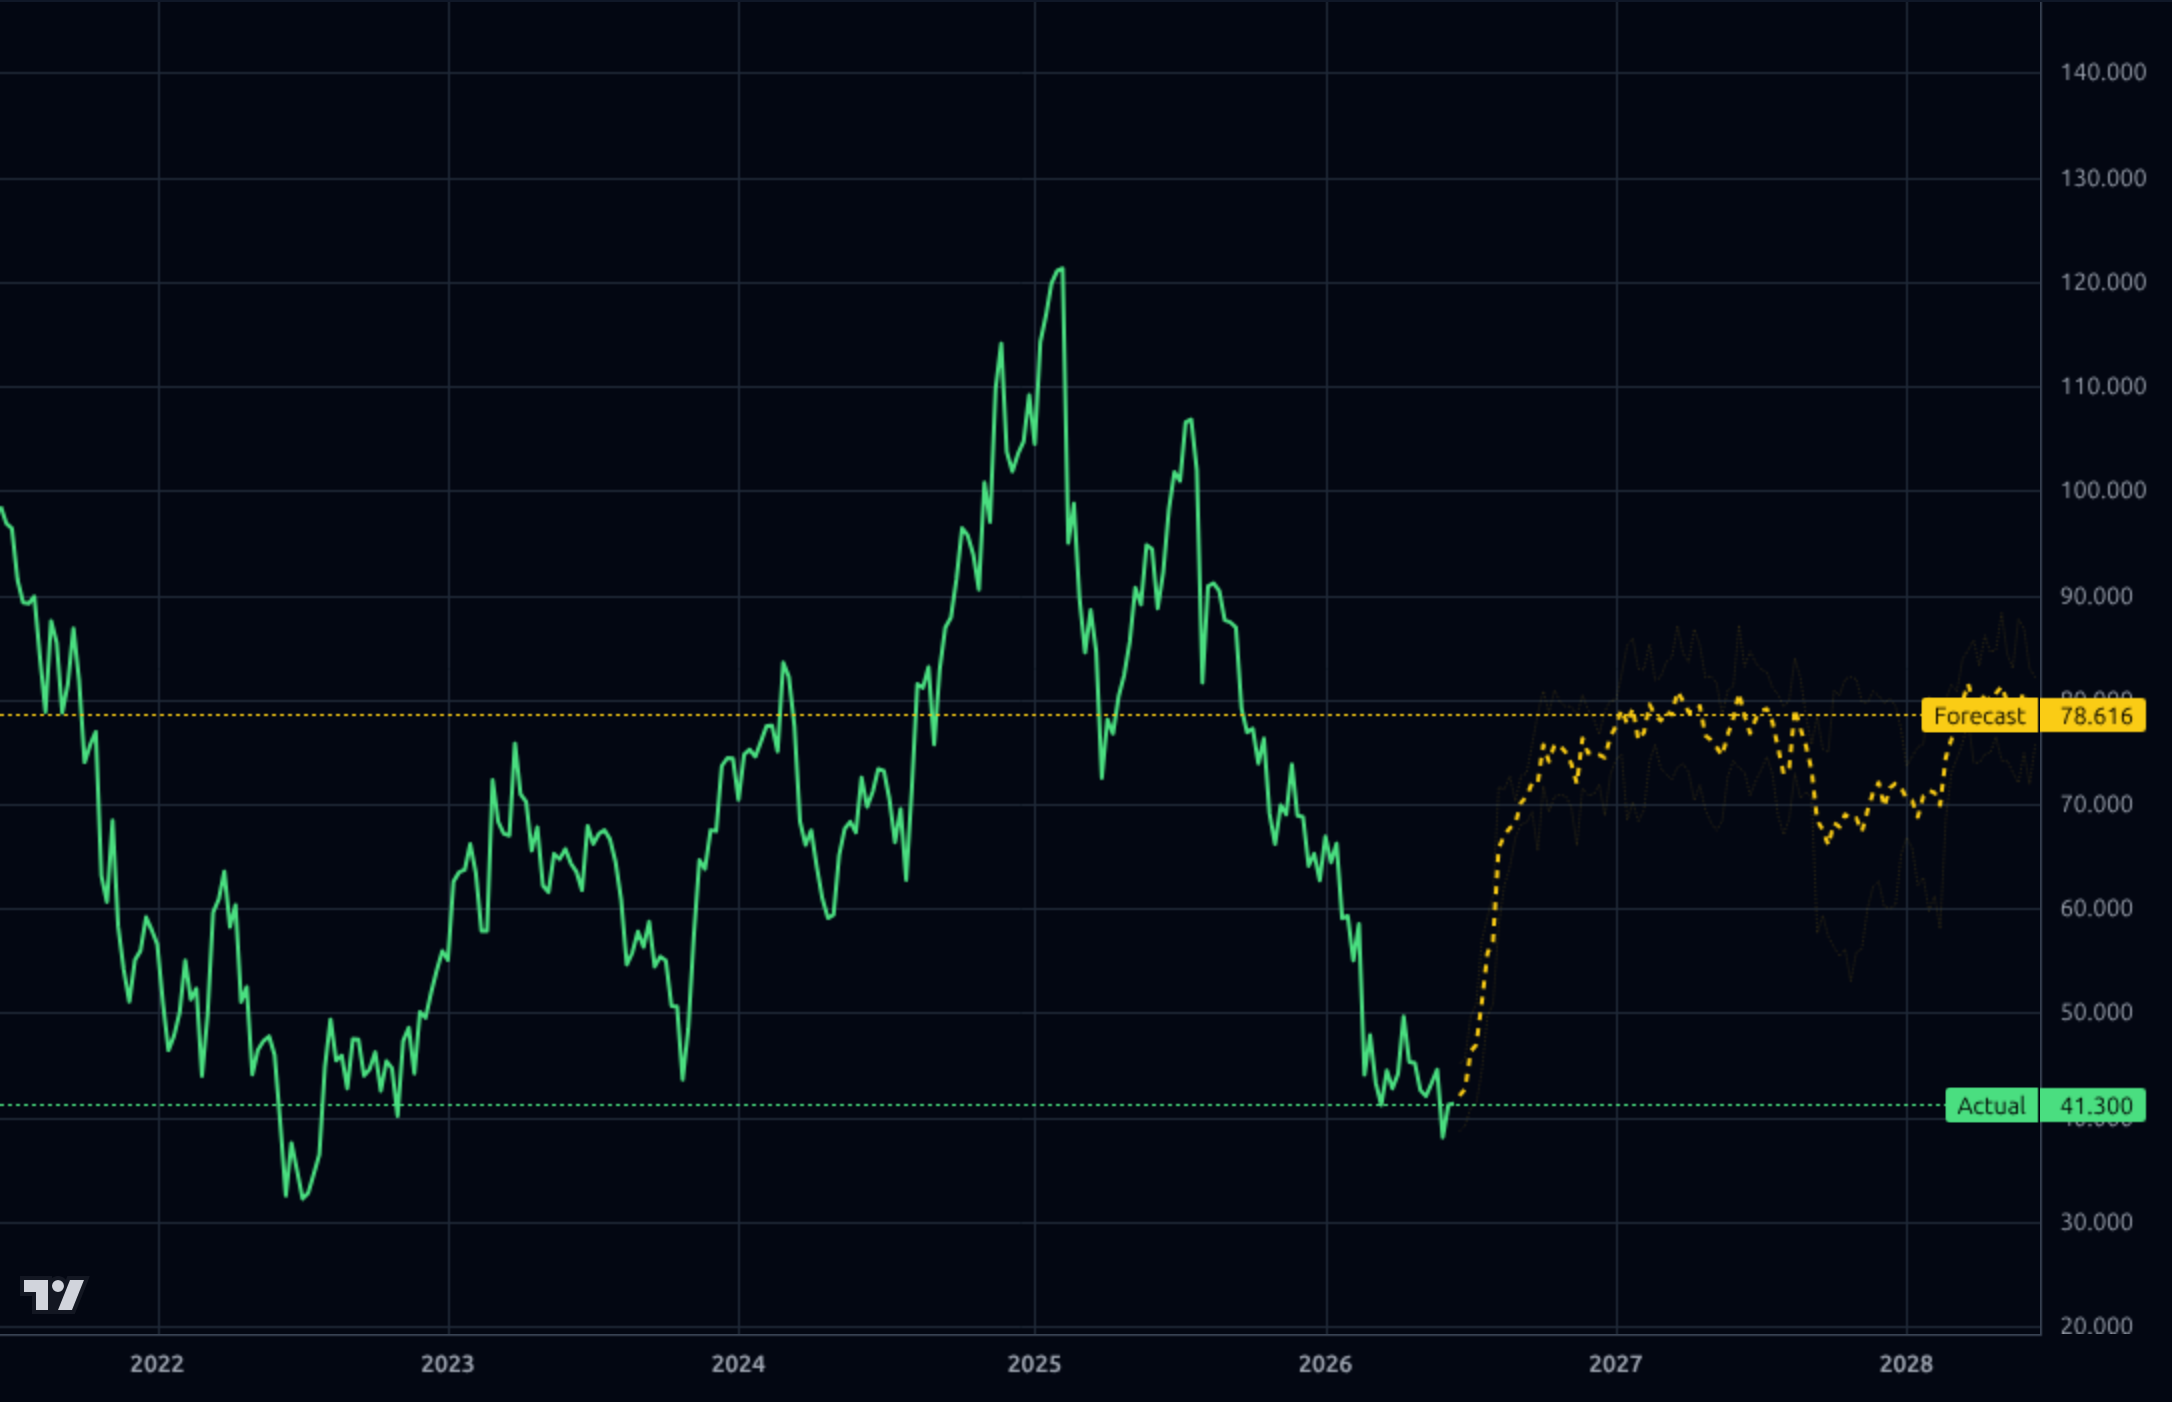
Across all four timeframes the chart is broken. The 1-week chart shows price collapsing from ~$120 in early 2025 to $41.30, a >65% drawdown that has erased multiple years of gains. The 1-day chart shows a persistent downtrend with Actual at $39.40, sitting -34.7% below the 200-day SMA, -9.45% below the 50-day, and -4.65% below the 20-day — a stacked bearish moving-average structure. RSI of 44.65 is neutral-to-weak, not yet oversold. The 4h and 1h charts show price stabilizing in a $36–$42 range with a recent bounce off the $35.6 low (mid-June). Kronos forecasts are constructive: 1h forecast 46.0, 4h forecast 56.3, 1d forecast 63.9, 1w forecast 78.6 — all implying significant mean-reversion. The critical caveat is that the model's directional accuracy on this name over 30 days is only 20% (and 0% at horizons 3-4), with MAPE of 21.8% — so the forecast band should be heavily discounted. Key levels: support $34.56 (52w low), then air; resistance $42 (recent pivot), $45 (1h forecast cap), and $50 psychological.
The news flow is constructive but largely strategic rather than near-term catalytic. The June 16 Yahoo/Investing.com piece highlighting Shift4's role processing payments at MetLife Stadium (2026 FIFA World Cup final venue) and Hard Rock Stadium is a strong showcase of platform reach in the 'Experience Economy.' The June 14 article on global M&A confirms management is in an aggressive international expansion phase — explaining the cash burn from $3B to $473M over three quarters and the elevated debt load. The June 17 Motley Fool comparison with PayPal frames FOUR as the higher-growth, higher-risk option. Signal: the company is executing a credible platform-expansion strategy and is embedded in marquee venues. Noise: the headlines don't address the central investor concern — whether margin compression in Q1 2026 is integration-related (transitory) or competitive (structural). No earnings surprises, no guidance changes, and no insider selling cluster were flagged. With 91% institutional ownership, 29.6% insider ownership, and 26.6% short float, the setup is crowded on both sides.
- 2026 FIFA World Cup processing at MetLife Stadium (final venue) and Hard Rock Stadium — concrete showcase for enterprise/stadium vertical (per June 16 news)
- International expansion via M&A targeting hospitality/entertainment 'Experience Economy' verticals (per June 14 release)
- SkyTab POS, SkyTab Mobile, and SkyTab Venue platform rollout driving Sales Q/Q +32%
- EPS next Y growth estimate of +20.87% and EPS next 5Y of +14.95% imply analyst confidence in operating leverage recovery
- Forward EPS of $6.76 vs. TTM $0.87 — analysts expect dramatic earnings normalization
- Q1 2026 operating margin collapsed to 4.5% from 10.2% in Q4 2025 — could signal structural pricing pressure, not just integration noise
- Debt/Equity of 2.77 and total debt of $4.58B against $473M cash leaves no margin for an integration misstep or rate shock
- Cash position fell from $3.03B (Jun 2025) to $473M (Mar 2026) — aggressive M&A burn questions capital discipline
- Short float of 26.6% with short ratio of 9 indicates entrenched bearish institutional view
- Stock is -57.4% YoY, -40.8% over 6 months, -37.8% YTD — persistent distribution suggests informed selling
- Kronos model directional accuracy on FOUR is only 20% over 30 days; forecast band should be discounted heavily
- Profit margin of just 1.36% and ROIC of 1.87% — quality metrics do not support the growth multiple narrative
Get AI analysis on any stock
This is one of hundreds of Kronos AI reports — scored fundamentals & technicals, bull/base/bear price targets, a multi-horizon plan, and continuously-updated forecasts across the market. Create a free account to explore them all.
Create your free account →Already a member? Sign in · Join our Discord