GOOS — AI Stock Forecast & Price Targets
Published 8/7/2026 · A free sample of K3vl4r’s AI-powered analysis.
Kronos price forecasts, scored fundamentals & technicals, and a multi-horizon plan.
View the live GOOS price forecast →
GOOS is a strong luxury brand trapped in a cyclical downdraft, with Q1 FY26 showing a seasonal loss (-$90.8M net, -$190.7M OCF) that magnifies balance sheet stress (D/E ~1.58, $833M debt). Shares just hit fresh 52-week lows at $8.57 with RSI 32 and are -25.7% below the 200-day SMA; while forward P/E of 10.3x looks cheap and the sell-side sees $10.15, the tape, negative sentiment, and analyst downgrades (UBS to $10.50, SA downgrade) argue for patience rather than a hero bid.
1-4 weeks: HOLD/avoid new longs. Stock is oversold (RSI 32) at fresh 52W lows on heavy volume (Rel Vol 2.2). A tactical bounce toward $9.00–9.30 is plausible from these levels, but the trend is intact down. Traders can attempt a small long only on reclaim of $9.00 with stop below $8.40; invalidation of any bullish setup is a weekly close under $8.50. Do not chase the model's $11+ forecast — it has beaten by the naive baseline.
1-6 months: HOLD. The Sep/Dec quarters are when GOOS actually makes money (Q3 FY26 had 29% operating margin) — that seasonality is the real potential catalyst, not analyst chatter. Expected trading range $8.00–$10.50. Would flip constructive if (1) Q2 FY26 print shows sales holding +MSD with contained OCF burn, (2) management articulates a concrete debt-reduction plan, or (3) price reclaims the $10.20 200d proxy. Would turn negative on a weekly close below $7.50 or evidence of DTC comp deceleration.
1-3 years: The brand is real and the forward P/E of 10x on a 70% gross margin luxury franchise is arguably too cheap IF margins normalize back to the mid-teens operating range seen in peak quarters. Multi-year drivers: China/APAC re-acceleration, footwear/non-parka category expansion, DTC mix shift. Biggest structural risk: climate change eroding demand for premium heavy outerwear combined with a leveraged balance sheet that leaves no room for a bad winter. Requires patience and position sizing consistent with high-beta (1.63) cyclical exposure.
The FY26 Q1 print (period ending 2026-06-30) is ugly on the surface but partly seasonal: revenue of $118.9M is off-season and produced an operating loss of $103.8M, net loss of $90.8M, and operating cash burn of $190.7M. Trailing twelve-month revenue of $1.54B (Sales Y/Y TTM +13.6%) and gross margin of ~70% show the brand still commands pricing power, and Q3 FY26 (Dec 2025) delivered a robust 28.8% operating margin at peak season — this is a highly seasonal business. However, the balance sheet is the sore spot: $833M total debt vs. $207M cash, D/E of 1.58, and stockholders' equity slipping from $608M (Mar) to $526M (Jun). ROE of 11.8% and ROIC of 4.6% are unimpressive for a 'luxury' name, and TTM FCF of $142M is meaningful but lumpy. Divestiture of Baffin (bought for C$32.5M in 2018) signals a portfolio 'focus' but is small and unlikely to move the leverage needle. Forward P/E of 10.3x and PEG of 0.64 are inexpensive, but only if margin normalization holds — the Q1 miss on EPS and SA downgrade suggest the market is pricing execution risk, not opportunity.
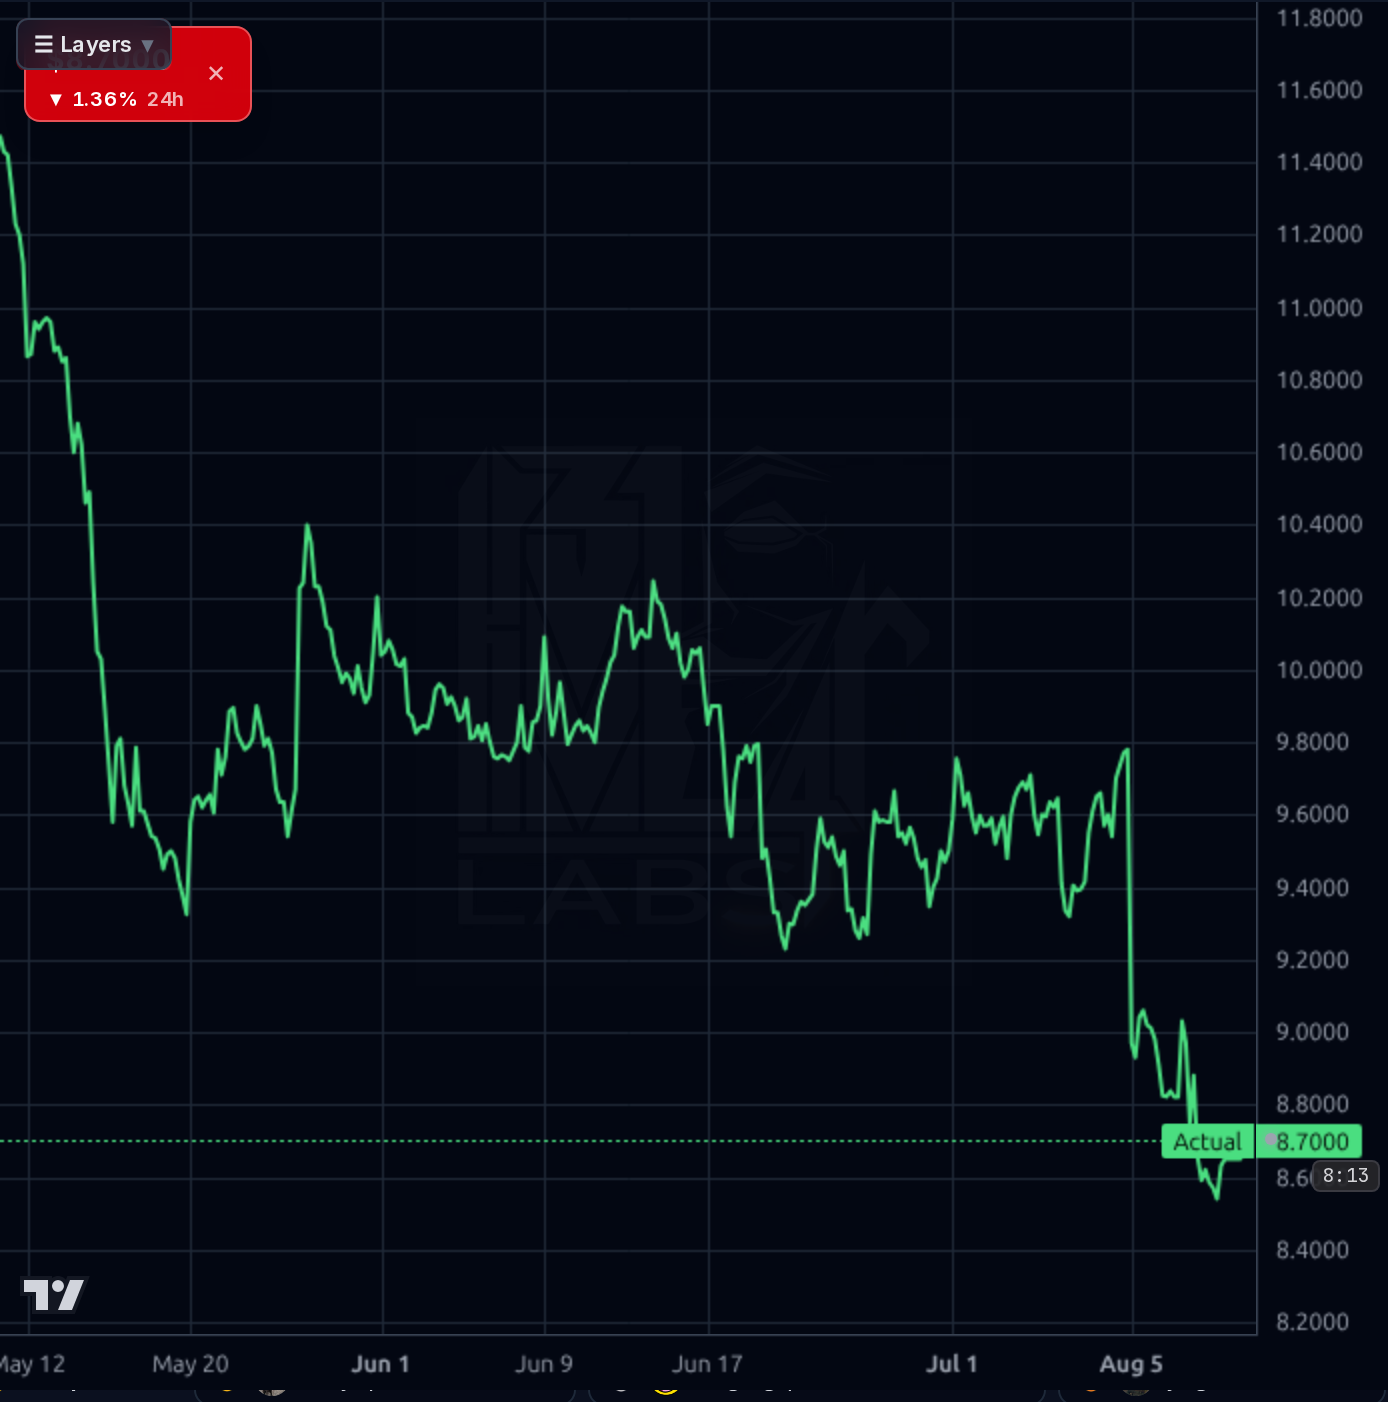
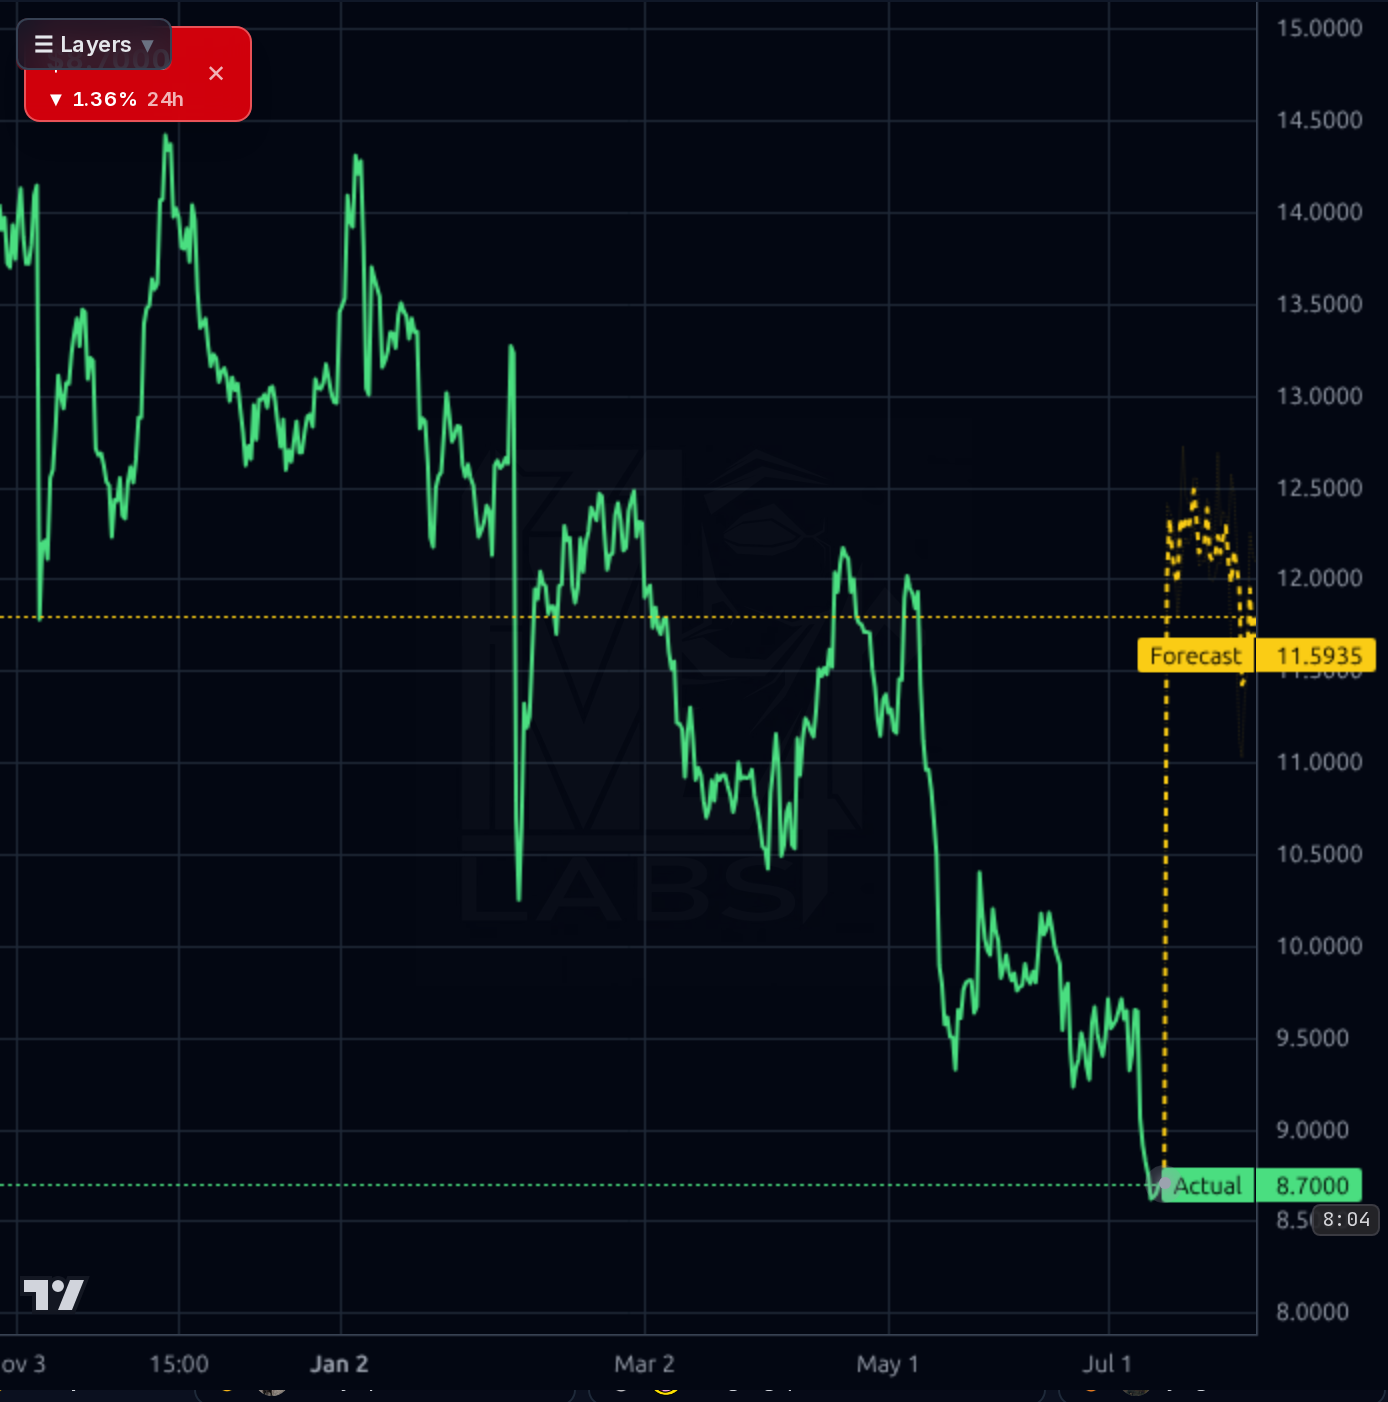
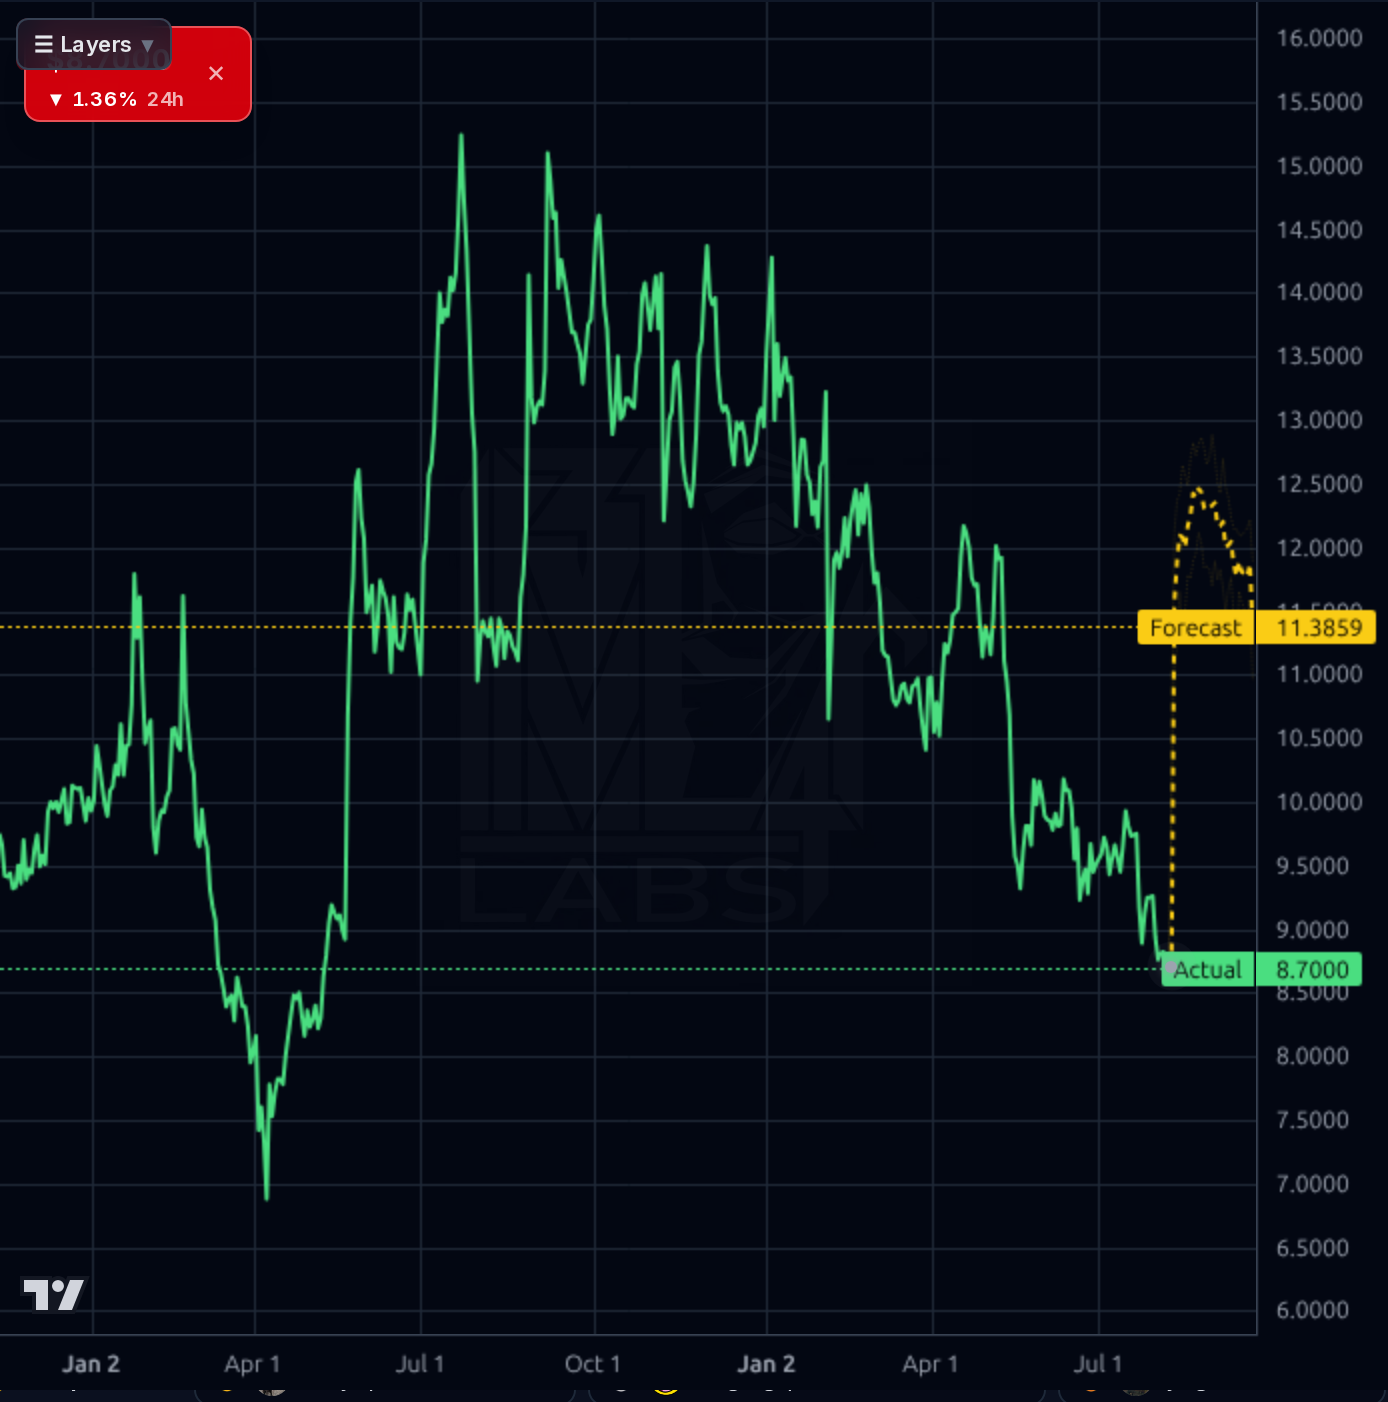
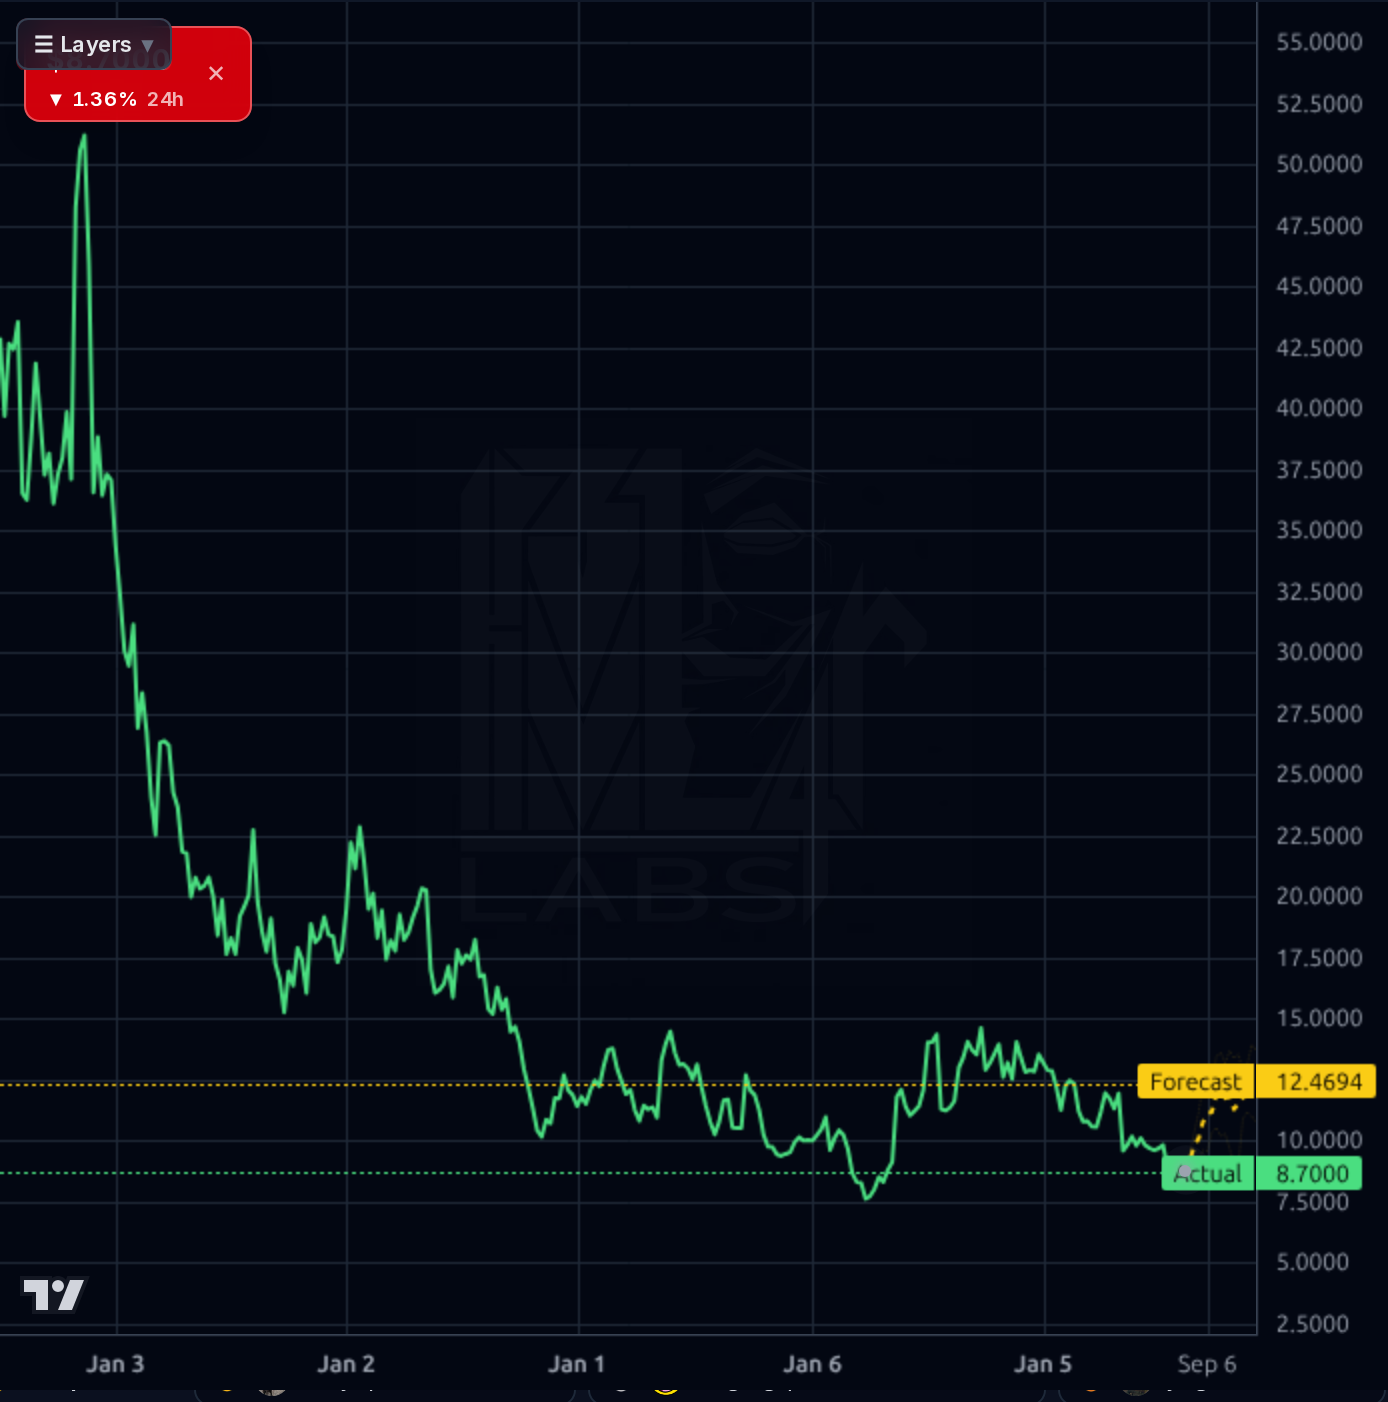
Every timeframe is bearish. The 1-day/1-hour chart shows a clean lower-high, lower-low sequence from ~$11.40 in mid-May to fresh lows near $8.53 today, with the stock breaking the June-July $9.30 floor on the earnings reaction. The 4-hour chart confirms a persistent multi-quarter downtrend from $14.50 (Nov) → $8.57 today. The weekly chart shows GOOS testing the lower end of a two-year $7.00–$15.30 range; a decisive break of the April 2025 low near $7.00 would open the IPO-era void. RSI at 32, price -7.9% below SMA20, -10.5% below SMA50, and -25.7% below SMA200 confirm a strong downtrend but also flag oversold conditions and potential for a mean-reversion bounce. The model's forecast band (yellow) on the 4h/1d/1wk charts implies a snap-back to $11.4–12.5, but the reliability data is damning: 1d directional accuracy is 27% vs. a 74% naive baseline, and the model has 0% directional accuracy at horizons ≥10. That forecast should be heavily discounted — treat as a low-probability upside scenario. Immediate support: $8.50 (today's intraday low), then $7.50 (Apr 2025). Resistance: $9.00 (broken shelf), $9.30 (prior floor), $9.80 (July high).
The dominant signal is negative: TD Cowen cut targets (initially to $12, then confusingly to $18 in a follow-up — the $12 revision is the operative recent action), UBS trimmed to $10.50 with Neutral, and Seeking Alpha explicitly downgraded to Neutral citing 'sharply decelerating comp sales growth.' The Baffin divestiture to L.P. Royer is a modest 'focus' move but not a value catalyst. Zacks flagged GOOS as a value idea, which is the lone constructive outside voice. Social sentiment is 100% bearish (small sample) and stocktwits chatter references '52-week low' and 'shit show' — classic capitulation tone that can precede a bounce but not a trend change.
- Peak-season leverage: Q3 FY26 delivered $694.5M revenue and 28.8% operating margin — a repeat print in Dec-2026 is the single biggest earnings catalyst
- Portfolio 'focus' via Baffin divestiture to L.P. Royer allows management to concentrate capex/marketing on core Canada Goose brand
- Footwear and non-parka categories (sneakers, rain, apparel) are expanding the addressable market beyond seasonal outerwear
- Forward EPS growth of +10% and 5Y estimate of +16% imply operational leverage IF DTC growth continues at the 9%+ rate seen in Q1
- Balance sheet fragility: $833M debt vs. $207M cash, D/E 1.58, and Q1 OCF of -$190.7M leaves little buffer against a weak Sep/Dec season
- Sell-side momentum negative: UBS cut to $10.50, SA downgraded citing decelerating comps
- Technical breakdown: fresh 52W low at $8.56, -25.7% below 200d SMA, no visible support until $7.50
- Cyclical luxury exposure into late-cycle backdrop; beta 1.63 amplifies any consumer discretionary risk-off
- Short interest 8.98% with 5.4-day cover — bearish crowding could either extend the decline or fuel a squeeze on any good news
- Model forecast is unreliable in this regime (27% directional accuracy vs. 74% naive baseline) — the yellow bullish band should not be relied upon
Get AI analysis on any stock
This is one of hundreds of Kronos AI reports — scored fundamentals & technicals, bull/base/bear price targets, a multi-horizon plan, and continuously-updated forecasts across the market. Create a free account to explore them all.
Create your free account →Already a member? Sign in · Join our Discord