GPI — AI Stock Forecast & Price Targets
Published 9/1/2026 · A free sample of K3vl4r’s AI-powered analysis.
Kronos price forecasts, scored fundamentals & technicals, and a multi-horizon plan.
View the live GPI price forecast →
GPI presents a classic value trap profile: statistically cheap based on P/B (1.09x) and forward P/E (~6.1x), but this valuation is severely undermined by collapsing sequential operating cash flow ($155M to $62.6M) and high leverage ($5.78B debt). The stock's technical support at the 52-week low ($249.54) offers a potential buying zone, but the immediate catalyst risk remains the confirmation of OCF inflection or further balance sheet stress.
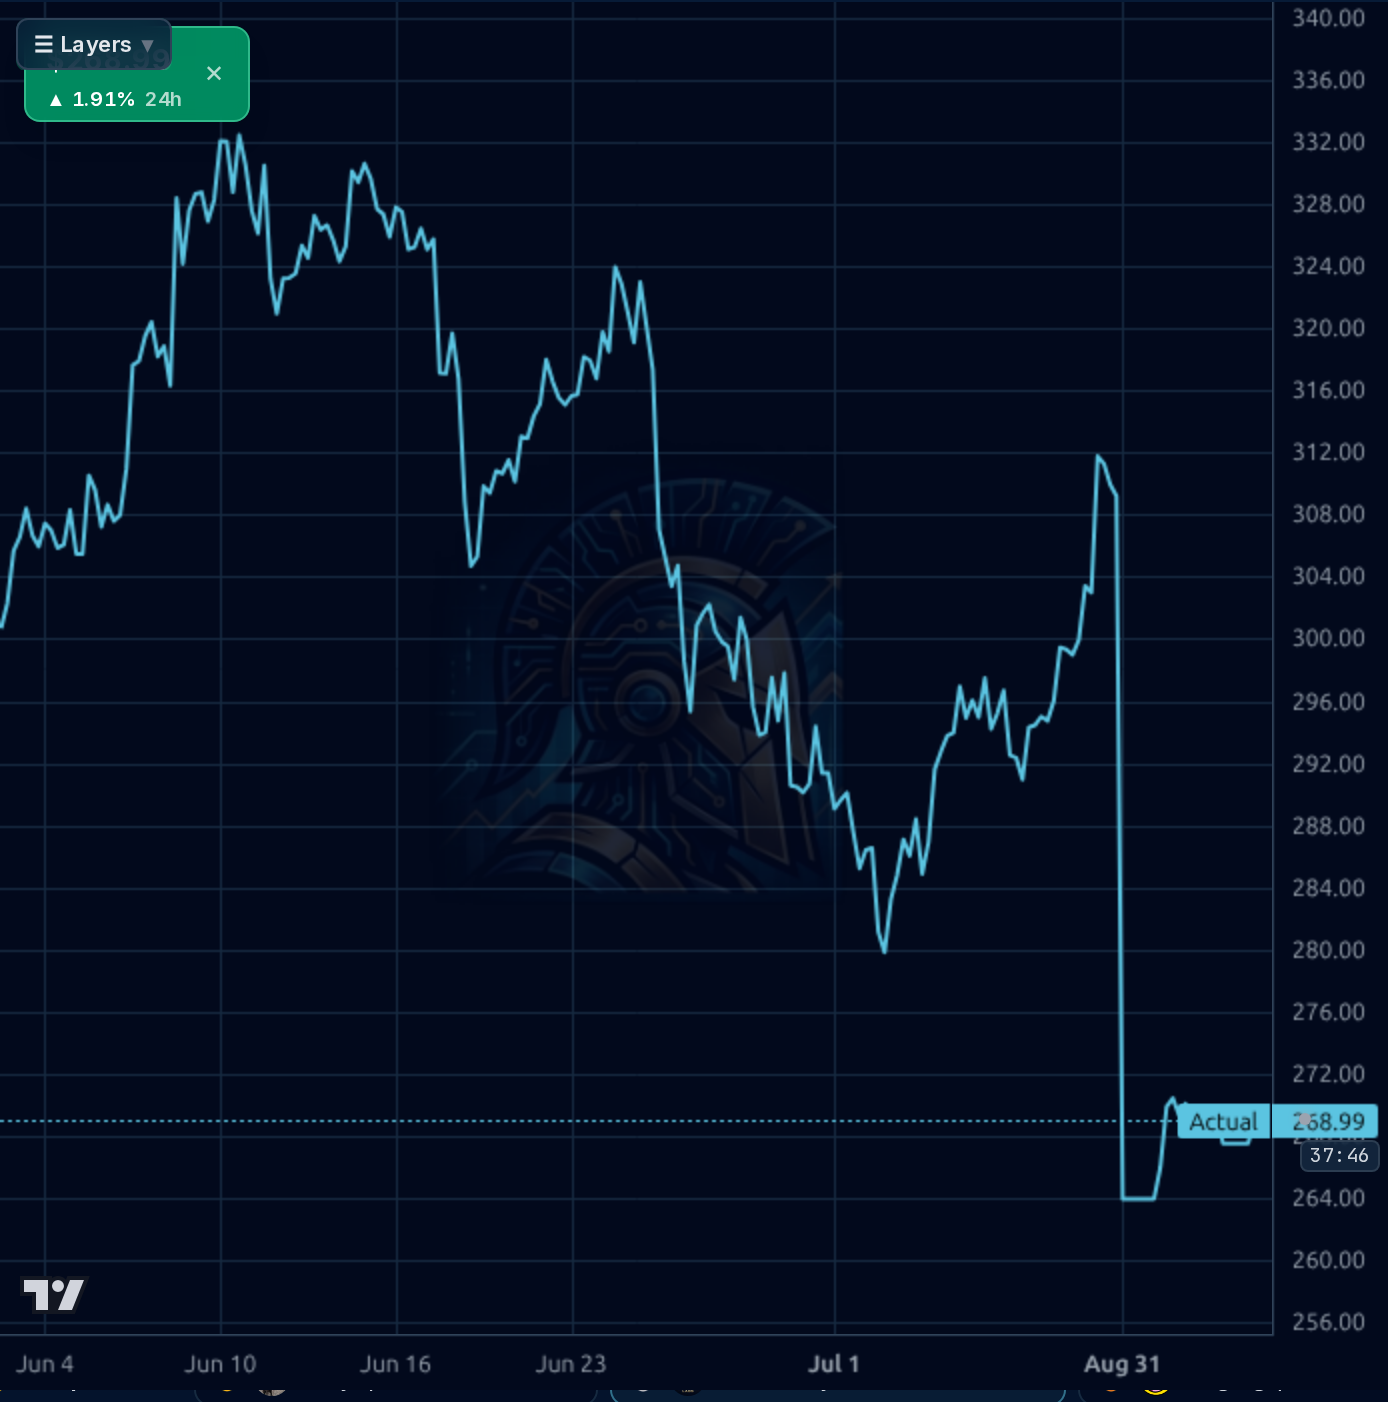
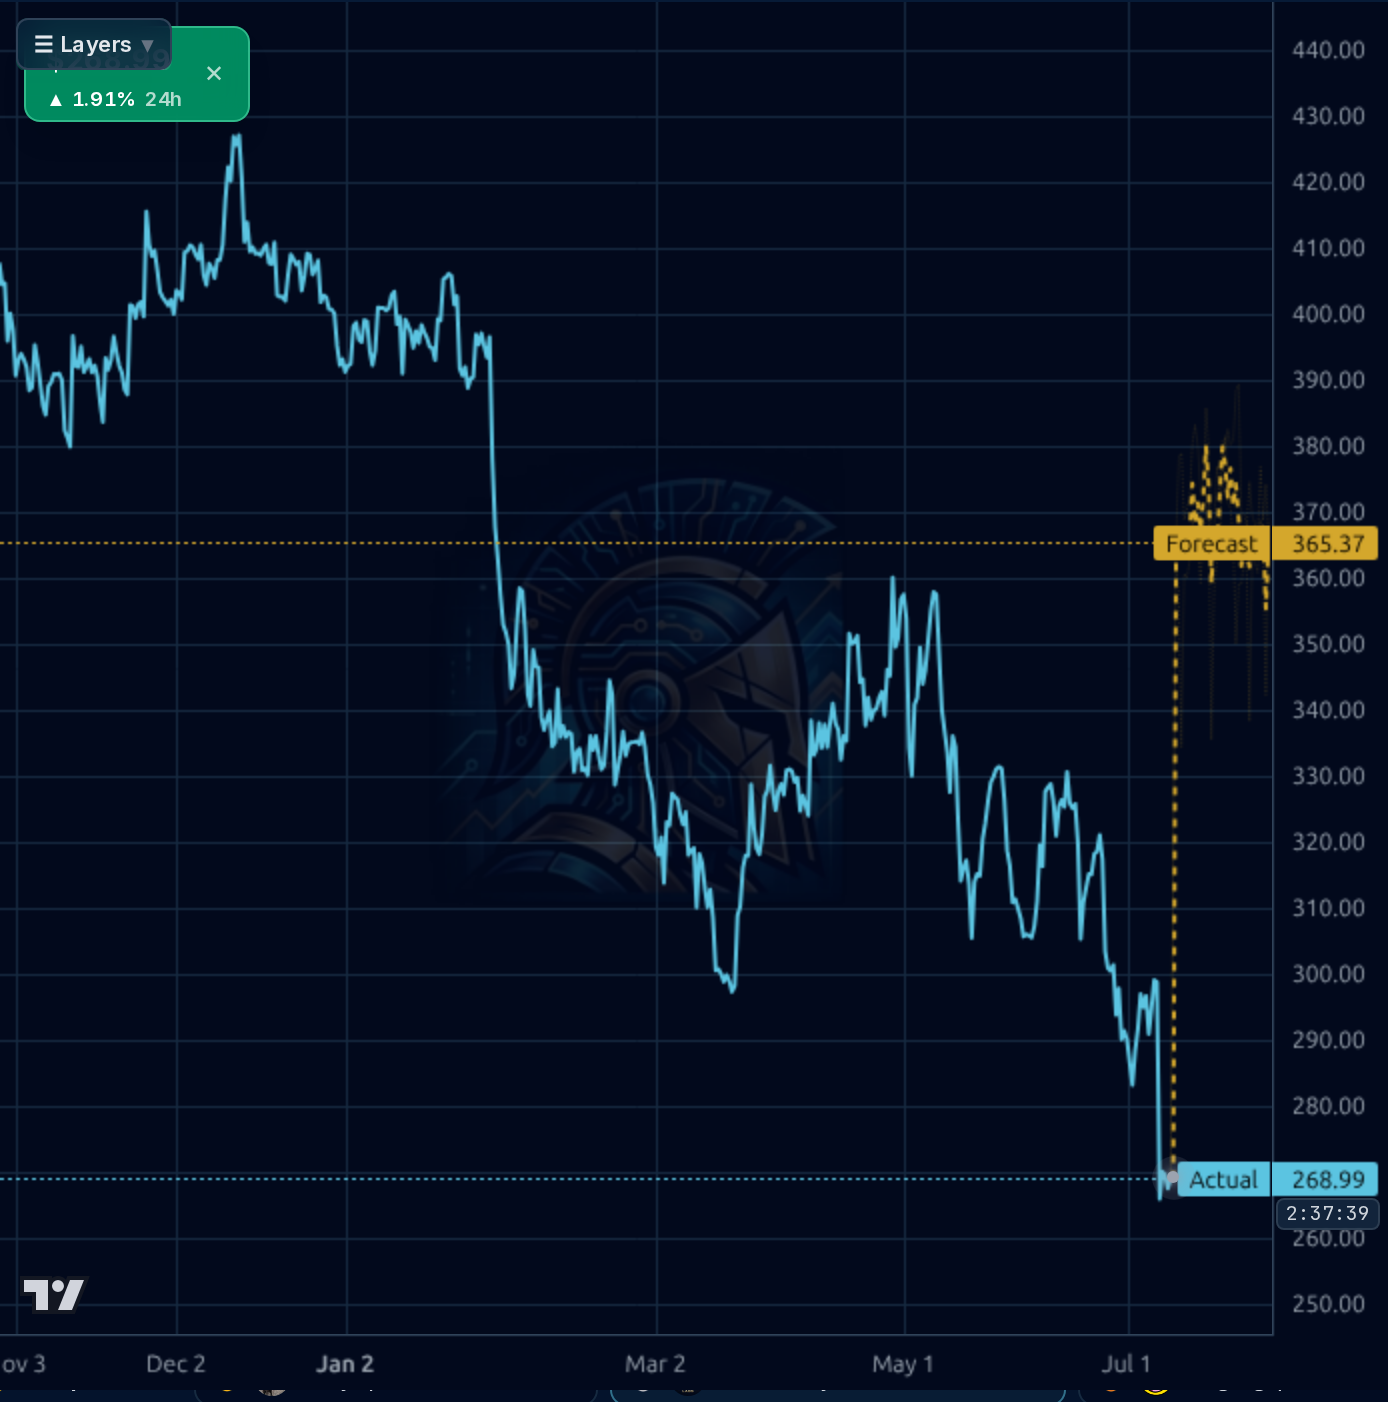
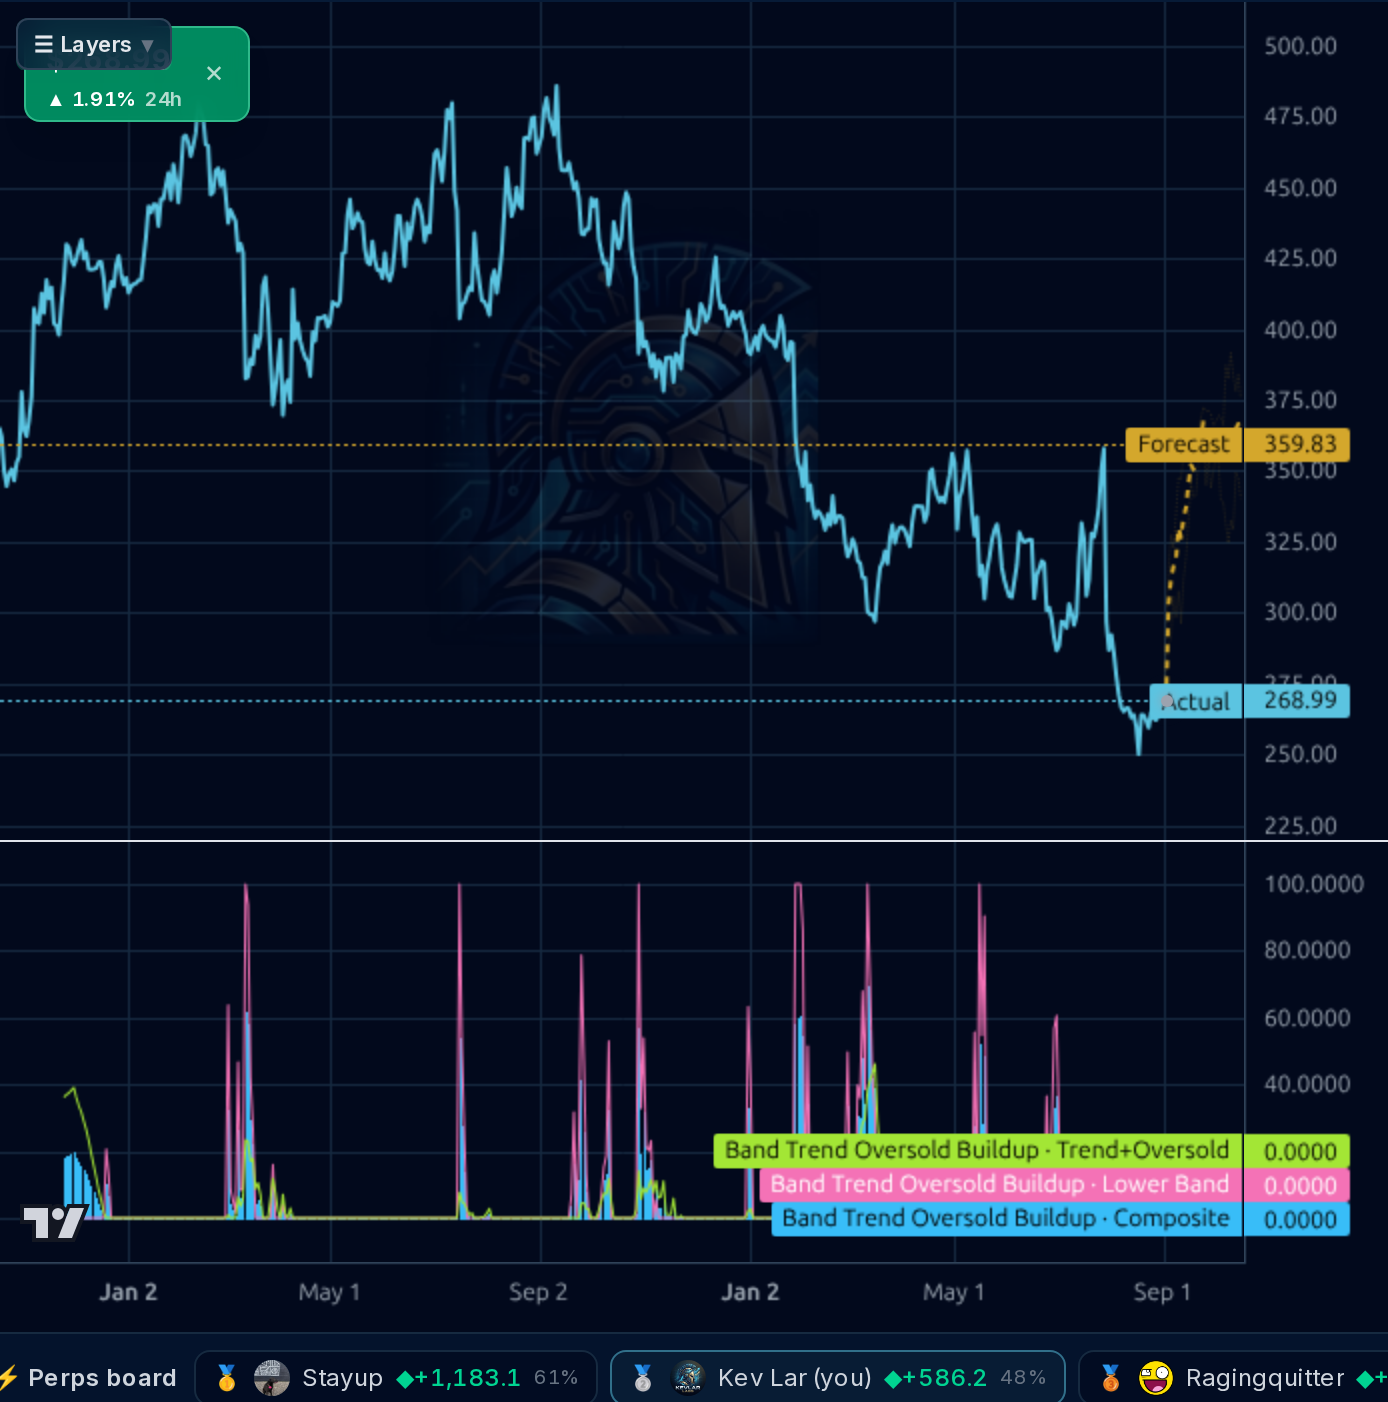
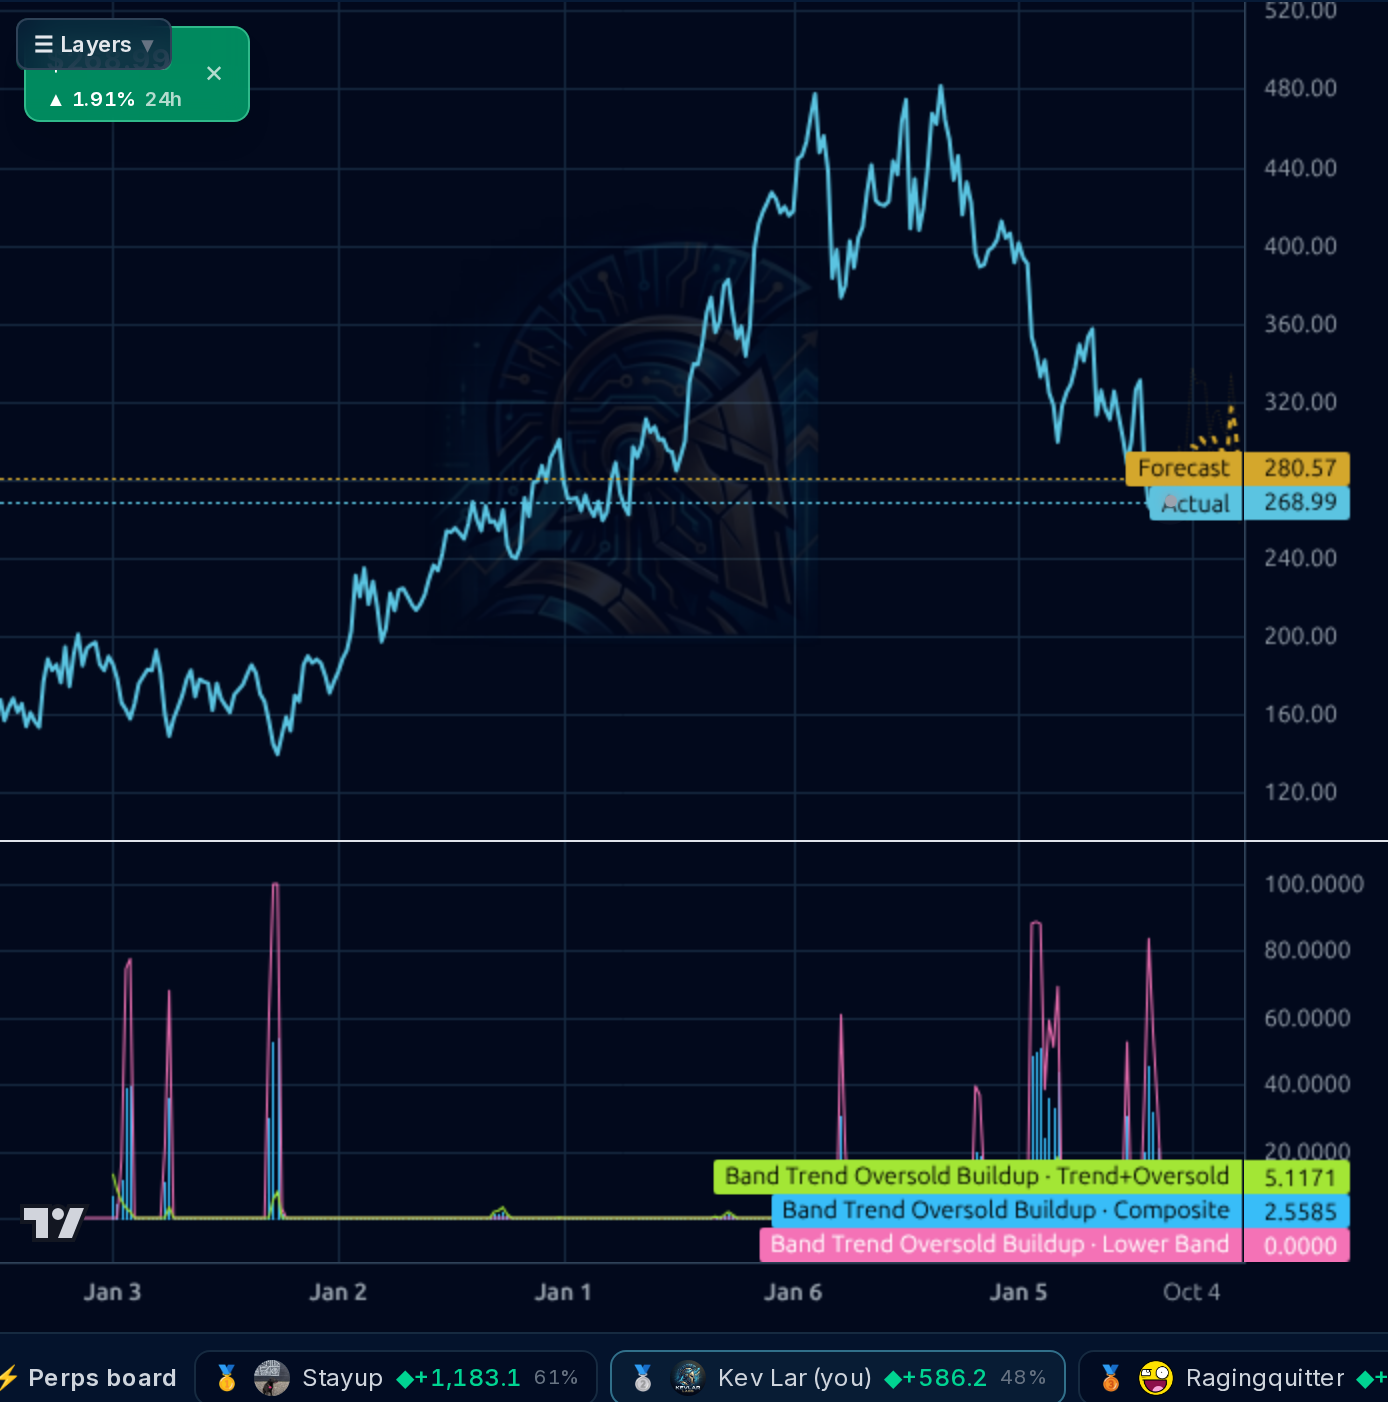
Wait for a clear technical confirmation of support at $249–$250, ideally accompanied by positive commentary on Parts & Service segment resilience. A break below this level invalidates the immediate value floor thesis.
The mid-term thesis hinges entirely on Q3 earnings (Oct 27): a clear inflection in OCF/FCF above $150M is required to justify moving toward the base target of $282. If OCF remains weak, expect continued downward pressure towards the $220s basing zone.
The long-term thesis requires management to demonstrate a sustainable path to deleveraging and margin recovery that outpaces the structural headwinds from OEM D2C shifts. The current debt load makes this difficult without significant asset sales or refinancing.
The fundamentals show a cyclical retailer with strong historical margins (Gross Margin: 15.38%, Operating Margin: 4.23%) and solid book value ($247.54/share). However, the cash flow quality is deeply concerning; operating cash flow has fallen sharply from $155M to $62.6M sequentially, which overrides positive headline EPS beats. The balance sheet is stressed with a high Debt/Equity ratio of 1.96 and a low Quick Ratio of 0.25. While the dividend yield (0.82%) provides some income support, the massive debt load relative to current cash ($164.5M) suggests significant capital structure risk, especially given the $1.3B Hennessy deal.
Technically, the stock is trading near its 52-week low of $249.54, suggesting a potential value floor or capitulation zone. The chart shows multiple instances where the price has tested this level and found support (as noted in prior reports). Momentum indicators are mixed; while the RSI (14) at 45.57 suggests neither extreme overbought nor oversold conditions, the recent downward trend is evident across all visible timeframes. The forecast bands suggest caution, as the model's directional accuracy for both 1D and 1W is significantly below its naive baseline, indicating high uncertainty.
The most material news flow centers on balance sheet events: the board declared a quarterly dividend ($0.55/share) and the company is pursuing a $1.3B all-cash Hennessy deal. These actions mechanically support per-share metrics but increase leverage risk. Conversely, sell-side sentiment has been negative, with Morgan Stanley downgrading the stock and Zacks adding it to their Strong Sell list. The primary signal conflict is between dividend/buyback support versus deteriorating operational cash flow.
- Parts & Service segment: This division remains the most durable, counter-cyclical cash flow anchor due to its high Gross Margin (>56%) and reliance on an aging U.S. vehicle fleet.
- Sequential OCF Collapse: The decline from $155M to $62.6M is the dominant negative signal, suggesting operational deterioration that current valuation metrics do not capture.
- Balance Sheet Stress: High debt ($5.78B) relative to cash and low quick ratio (0.25) makes the company vulnerable to interest rate hikes or unexpected capital calls.
Get AI analysis on any stock
This is one of hundreds of Kronos AI reports — scored fundamentals & technicals, bull/base/bear price targets, a multi-horizon plan, and continuously-updated forecasts across the market. Create a free account to explore them all.
Create your free account →Already a member? Sign in · Join our Discord