GPI — AI Stock Forecast & Price Targets
Published 7/15/2026 · A free sample of K3vl4r’s AI-powered analysis.
Kronos price forecasts, scored fundamentals & technicals, and a multi-horizon plan.
View the live GPI price forecast →
GPI trades at a headline-cheap 6.4x forward P/E and 0.79 PEG near 52-week lows, but Q1'26 FCF collapsed to $8.4M from $180M a year prior against $5.6B of debt and a sub-1 current ratio. With binary Q2 earnings ~15 days away (July 30), the correct posture is HOLD into the print — technicals are oversold but not bottomed, and prior forecasts on this name have consistently overshot the realized tape.
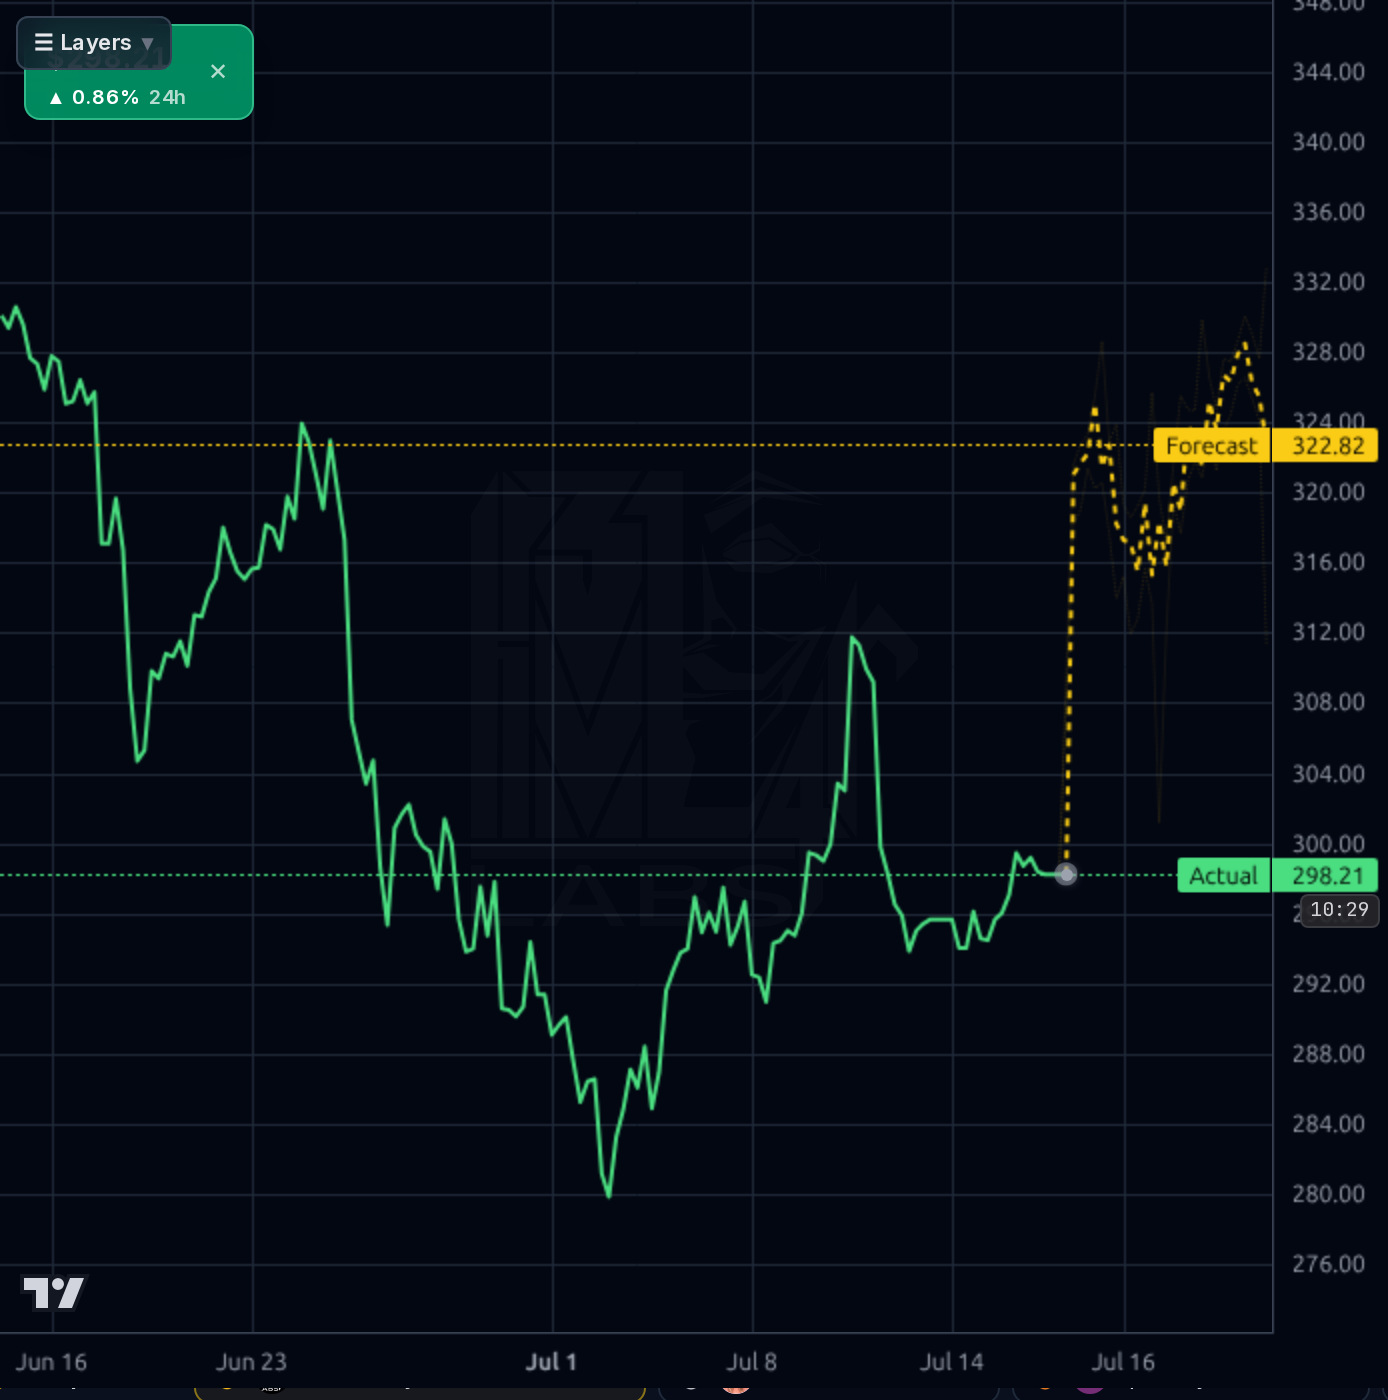
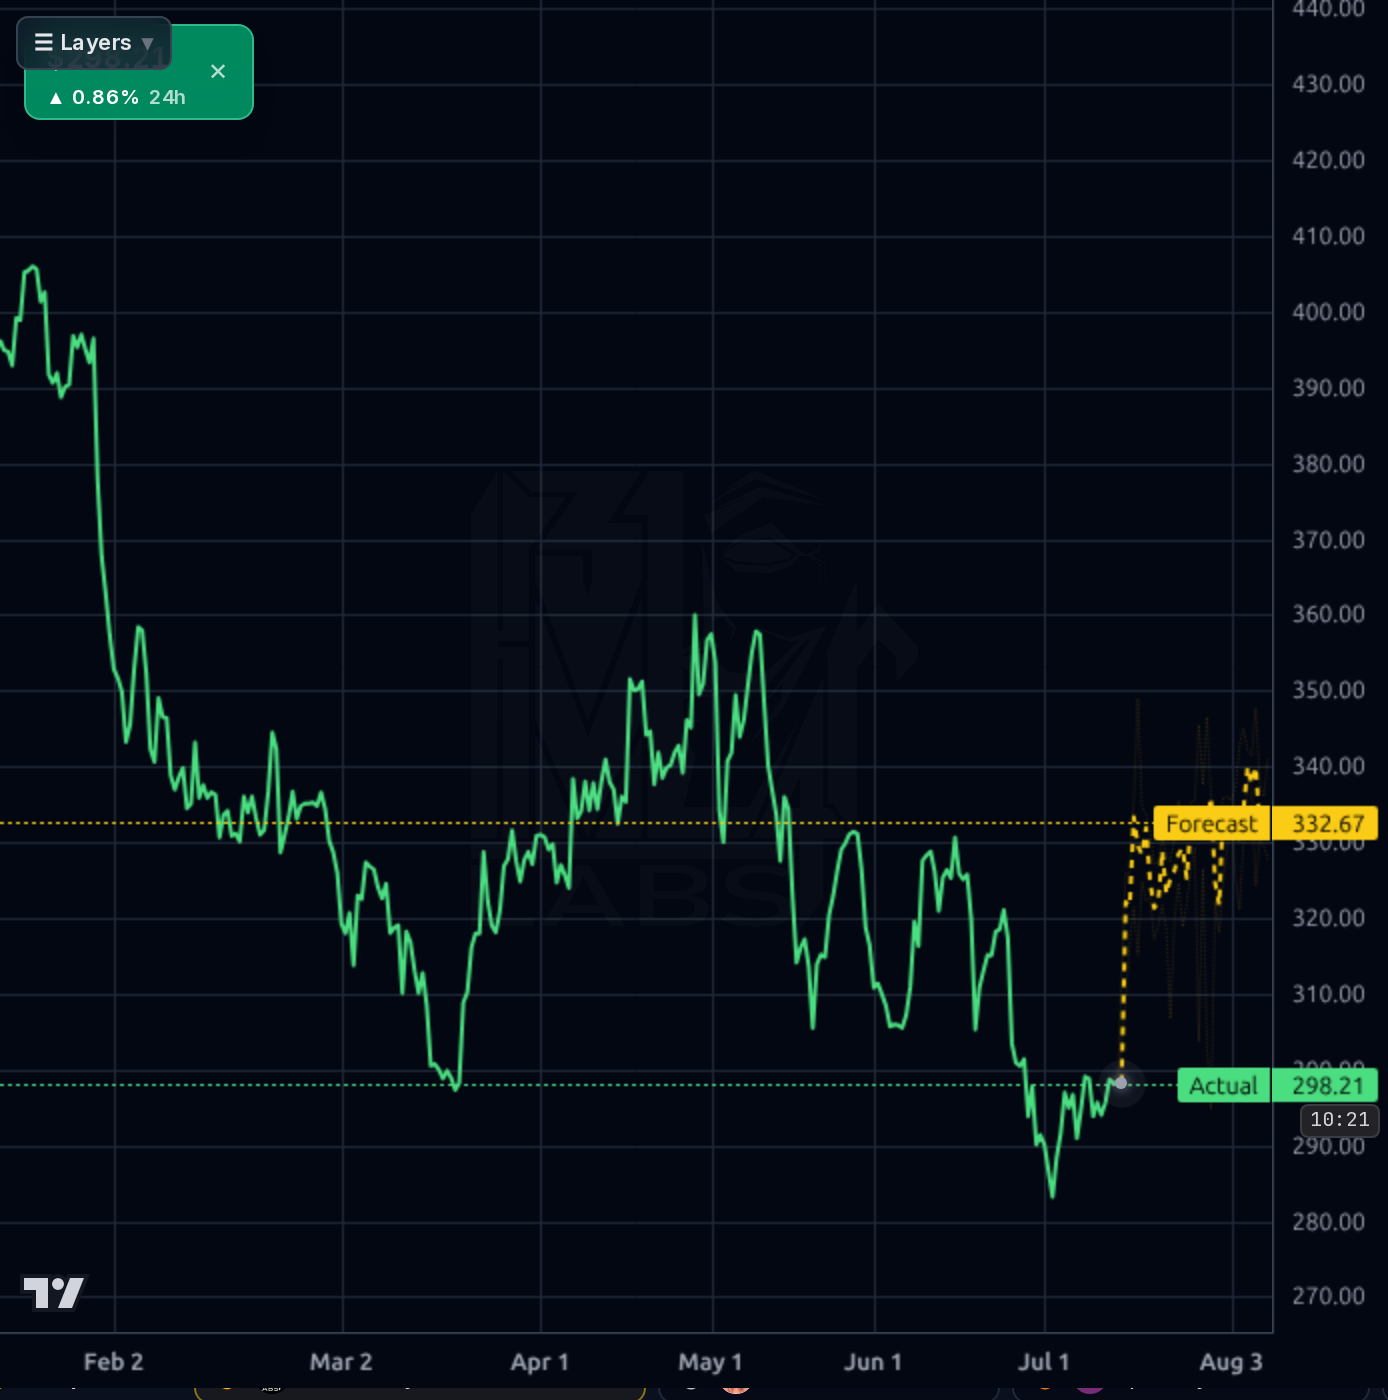
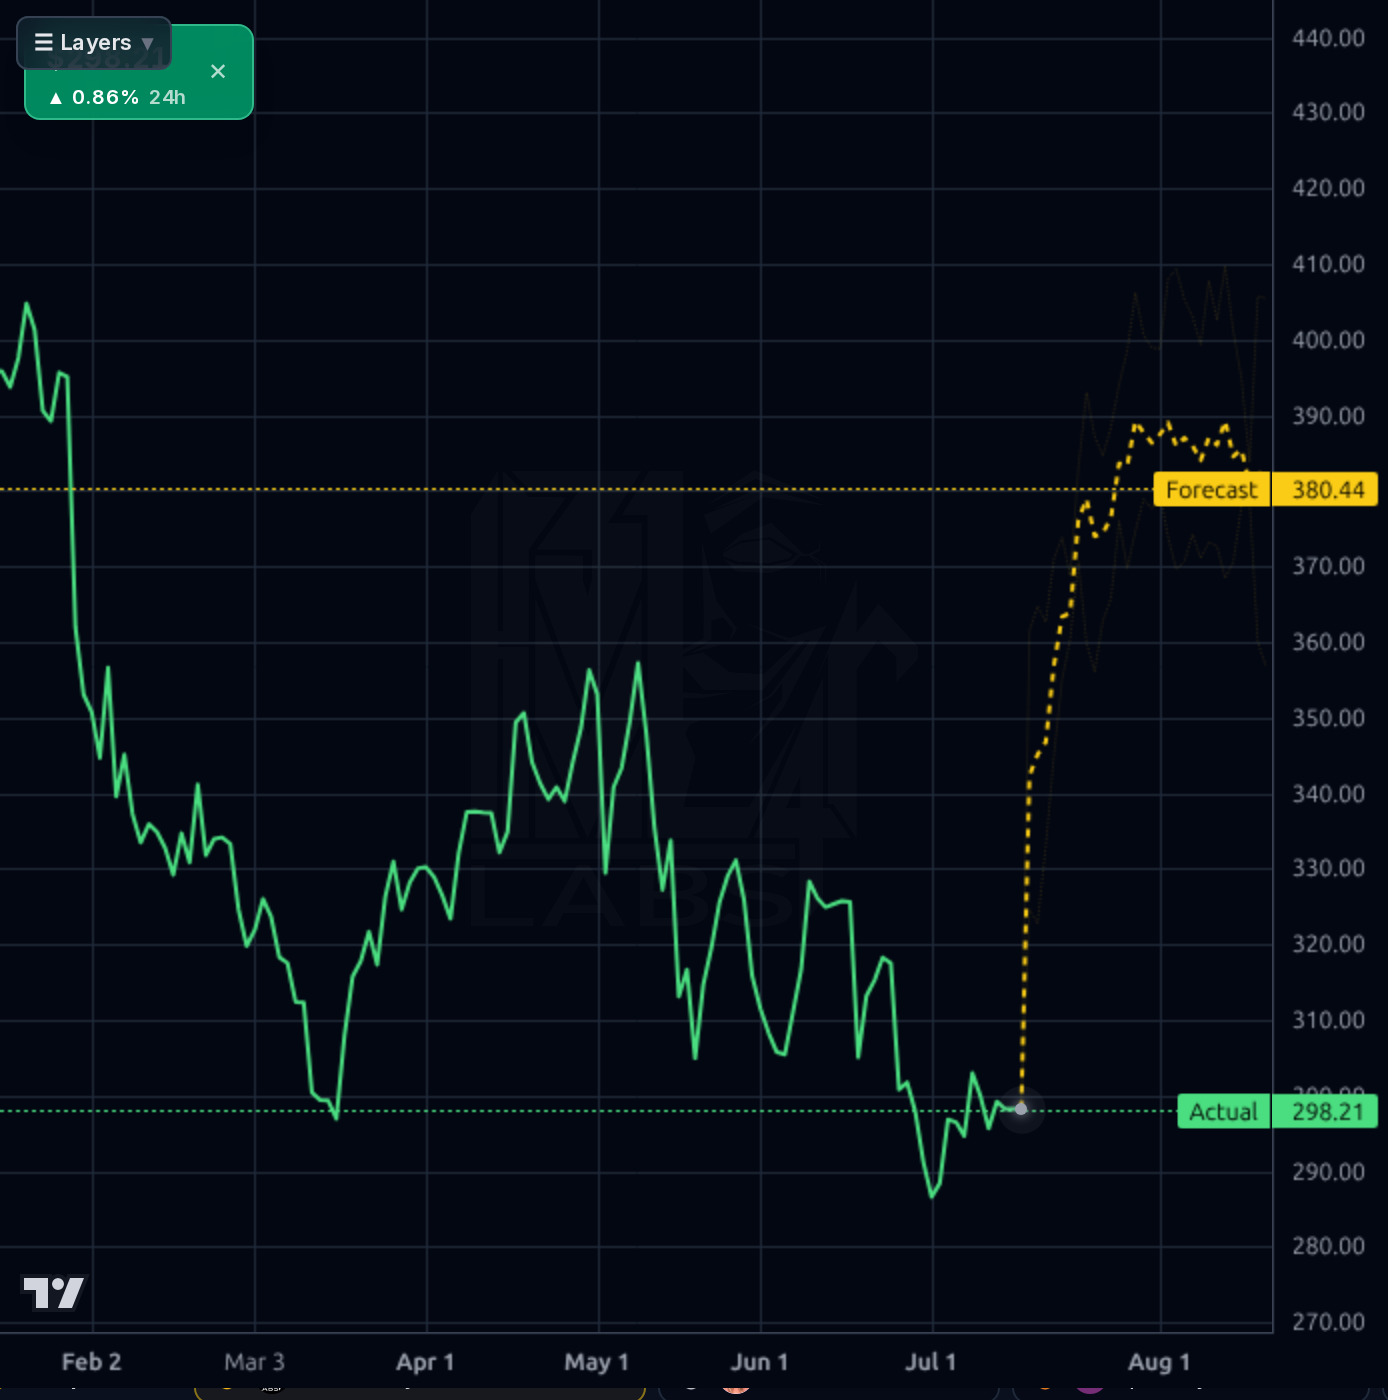
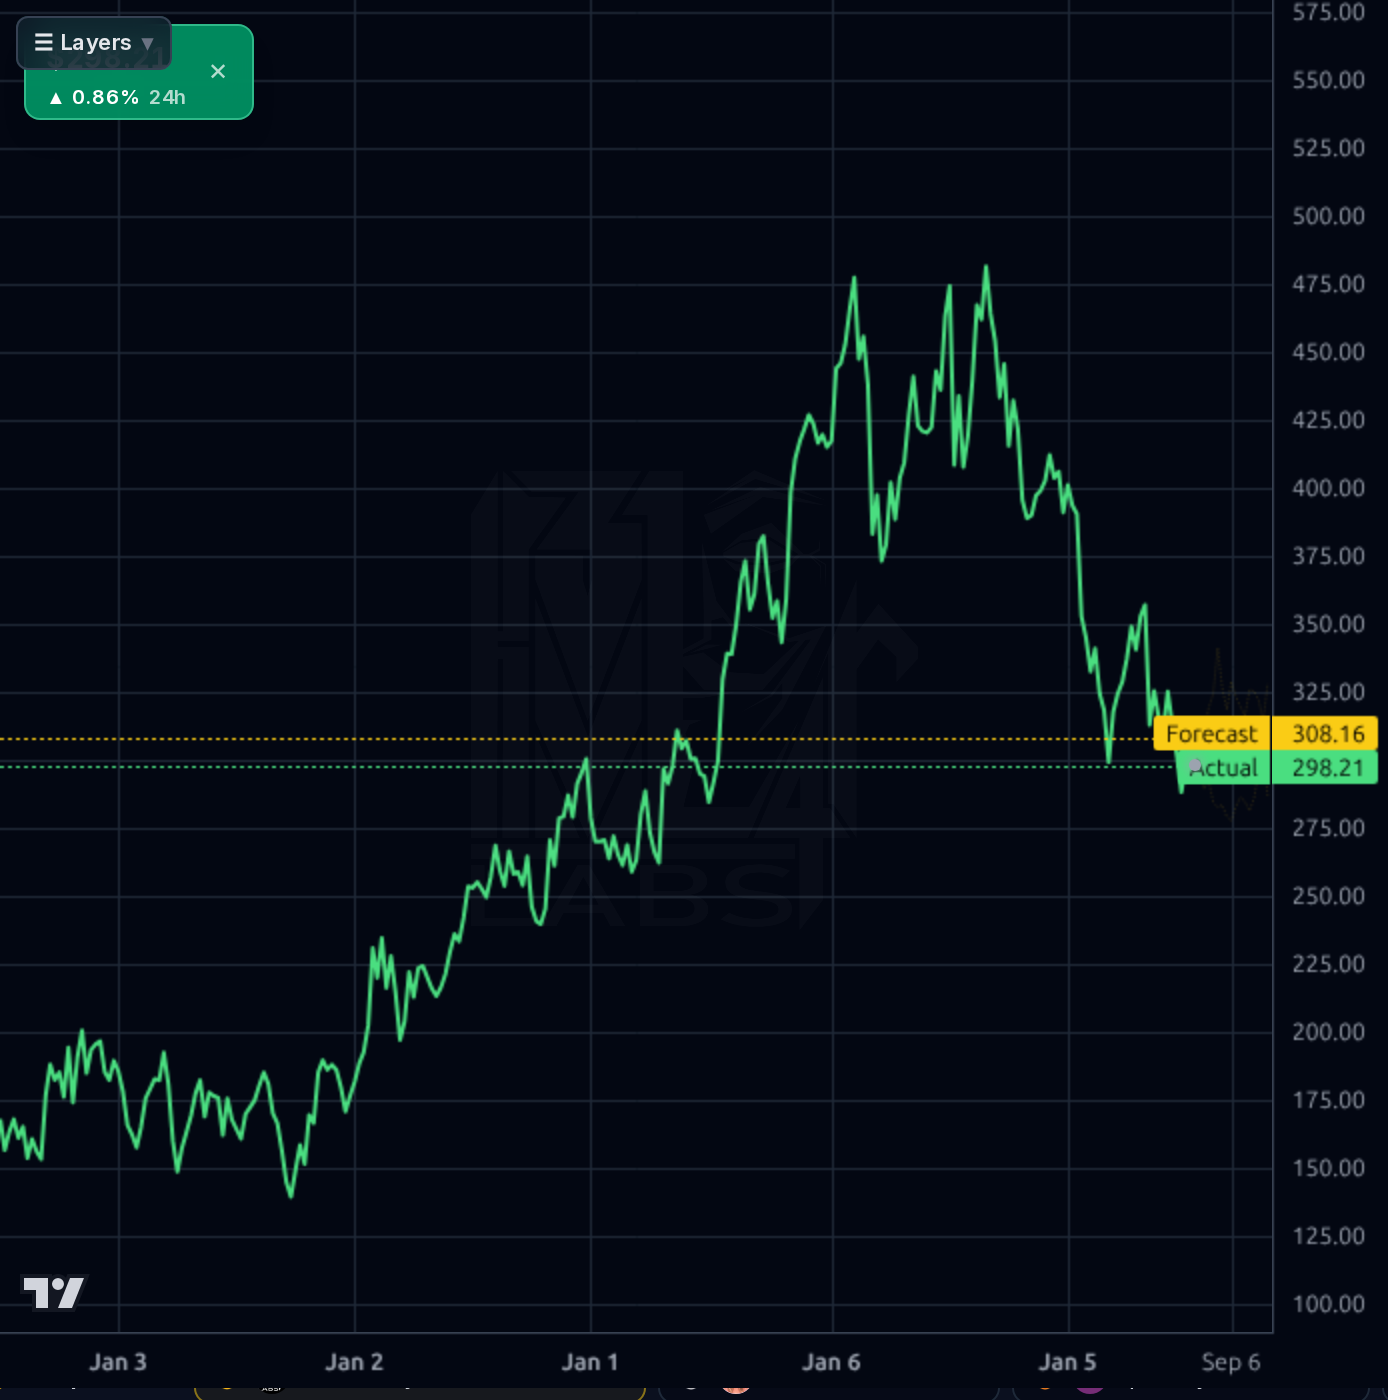
HOLD into the July 30 earnings print (~15 days). Do NOT initiate a new swing position ahead of a binary catalyst — IV is elevated and the tape has shown FCF sensitivity dominates. If already long, tight stop below $279 (52-wk low) is the invalidation. Upside cap pre-print at $312-315 resistance; the yellow forecast bands at $322-333 look optimistic given the calibration history of overshoot. Any short-dated bounce is a trim opportunity, not an add. Sentiment is 100% retail-bullish on 7 tags — modest contrarian caution.
1-6 month view is entirely gated on the July 30 print. Bull case: management shows credible FCF stabilization plan, Parts & Service revenue mix expands, and SG&A leverage from rebranding shows through — stock re-rates toward $360-380 (still below prior JPM target). Base case: numbers are mixed, guidance is cautious, stock oscillates $290-330 as market waits for Q3 data. Bear case: FCF misses again, working capital deteriorates further, guidance is cut, and stock breaks $279 toward $250. Expected 6-mo range $260-340, skewed slightly bearish given revision direction. Would flip constructive if Q2 FCF prints >$100M with credible full-year guide.
1-3 year terminal thesis rests on three pillars: (1) US vehicle fleet aging past 13 years drives durable Parts & Service demand (structural tailwind, real), (2) real estate portfolio provides downside protection and refinancing collateral, (3) auto dealer consolidation continues. If FCF normalizes to $500M+ annually and leverage descends to <1.5x D/E, fair value is $450-550. Biggest structural risk is the EV transition — EV service revenue is materially lower per vehicle than ICE, and this hits the Parts & Service pivot squarely if EV adoption accelerates in the US. Secondary risk: consumer credit stress in a recession pinches new/used volumes simultaneously with service margin.
Revenue is steady-to-soft at $22.47B TTM with Q1'26 revenue of $5.41B down 1.8% Q/Q and gross margin holding around 16.2%, but the profitability profile is thin: 1.46% net margin, 4.55% operating margin, and TTM EPS of $26.30 vs. forward $46.42 (analyst estimate stretches credulity given trend). The critical red flag is cash flow decay — operating cash flow fell from $251.6M in Q2'25 to $92.4M in Q1'26, and free cash flow collapsed from $179.9M to just $8.4M over the same period, while capex held near $84M. Balance sheet carries $5.61B total debt vs. $41.7M cash and $2.84B equity (D/E 1.98, LT D/E 1.08), with working capital turning negative to -$193.8M and quick ratio at 0.21 — genuine liquidity strain. ROE of 11.05% and ROA of 3.23% are mediocre for this stage of the auto cycle. What's working: gross margins are stable, revenue is growing 7.2% Y/Y TTM, and the Parts & Service pivot (per the SeekingAlpha piece) is a legitimate mix-shift story. What's broken: cash conversion, leverage headroom, and the trajectory of net income (Q1'26 $130.2M vs. Q2'25 $140.5M was actually flat, but Q3'25 collapsed to $12.9M — volatility is high).
Across timeframes the trend is clearly broken. On the 1D chart, GPI is down from ~$405 in Feb to $298, off 38% from the 52-week high of $488.39 and only ~7% above the 52-week low of $279.10. The stock sits -17.2% below SMA200, -5.7% below SMA50, and -1.5% below SMA20 — a stacked bearish MA structure. RSI at 44.6 is neutral-to-weak, not oversold enough to signal capitulation. The 1h and 4h forecasts project a sharp mean-reversion bounce to $322-333, but the 1d forecast band is even wider ($380) and prior calibration shows the 1d model beats naive (100% dir. accuracy at 1wk with 2% MAPE) while the short-horizon 1h model is worse than naive (29% vs 71%) — trust the 1d directional signal cautiously but discount the magnitudes. Key support: $279 (52-wk low, must hold). Resistance: $312 (recent bounce high), then $325 (prior consolidation), then $360-390 (heavier supply). The pattern is a downtrend attempting to base, not a confirmed reversal.
The signal is mixed but leans cautious. Sell-side is cutting targets across the board — JPM lowered to $380 (from $390, Overweight held), UBS to $330 (Neutral), and Evercore ISI to $440 (from $500, Outperform held). The consensus target of $416 remains far above spot, but the direction of revisions is down. Constructive items: the Parts & Service pivot thesis from SeekingAlpha frames the high-margin service business and real estate optionality as underappreciated, and the nationwide brand unification (Sterling McCall Hyundai → Group 1) is progressing, which could drive SG&A leverage. The negative signal: removal from major Russell growth indexes on 6/30, with acknowledged pressure from index-fund selling, coincided with the YTD -24% drawdown. Simply Wall St flagged the valuation as discounted but with weak momentum. Crypto/adjacent noise (Carvana ad spend) is not directly relevant. Net: fundamentals story remains intact per bulls, but the tape and revisions are aligned with the bearish read into earnings.
- Parts & Service segment mix expansion — highlighted in SeekingAlpha 7/9 coverage as the strategic pivot leveraging the 13-year average US vehicle age
- Nationwide Group 1 brand unification (Sterling McCall Hyundai transition per 6/23 PR) targeting SG&A leverage and cross-dealership marketing efficiency
- UK footprint providing geographic revenue diversification vs. domestic-only peers (11.64% 3Y sales growth)
- Real estate portfolio optionality — owned dealership footprint offers collateral value and sale-leaseback flexibility if leverage becomes acute
- Q2 earnings on July 30 as the near-term proof point for cash flow reversal after Q1's collapse to $8.4M FCF
- Free cash flow collapse from $180M (Q2'25) to $8.4M (Q1'26) with capex still elevated at $84M — unsustainable trajectory
- $5.61B total debt vs. $41.7M cash and 0.95 current ratio / 0.21 quick ratio — genuine near-term liquidity constraints
- Working capital turned negative to -$193.8M in Q1'26, a sharp deterioration from +$259.5M in Q4'25
- Index removal from Russell growth benchmarks creates ongoing passive selling pressure through 2026
- Sell-side target cuts accelerating (JPM, UBS, Evercore ISI all lowered PTs in July) — direction of revisions is bearish
- Secular EV transition risk to core Parts & Service thesis — EVs generate materially lower service revenue per vehicle
- Forward EPS estimate of $46.42 looks aggressive vs. TTM $26.14 — high risk of forward multiple expansion being illusory
- Binary earnings event 15 days away with elevated IV — asymmetric downside if FCF guide disappoints
Get AI analysis on any stock
This is one of hundreds of Kronos AI reports — scored fundamentals & technicals, bull/base/bear price targets, a multi-horizon plan, and continuously-updated forecasts across the market. Create a free account to explore them all.
Create your free account →Already a member? Sign in · Join our Discord