GPI — AI Stock Forecast & Price Targets
Published 7/14/2026 · A free sample of K3vl4r’s AI-powered analysis.
Kronos price forecasts, scored fundamentals & technicals, and a multi-horizon plan.
View the live GPI price forecast →
GPI trades at a headline-cheap 6.3x forward P/E and 0.76 PEG near its 52-week low, but the setup is dominated by the binary July 23 earnings print (~9 days away) with FCF having collapsed from $180M in Q2'25 to just $8.4M in Q1'26 against $5.6B of debt. Analyst target of $419 and 1.60 recom sit far above realized action; near-term I hold into the print with technicals oversold but the model's short-horizon bullish forecast unreliable (27% directional accuracy vs 73% naive).
HOLD into the July 23 print, do NOT establish new swing positions. Earnings is a binary IV-crush event 9 days out; sizing a directional bet here is gambling not investing. If forced to lean, the risk/reward is asymmetric to the upside only if you already own it near $290 with a stop below $279 (52w low invalidation). Any tactical trade should be sized ≤1/3 normal position. Model forecasts calling for $323+ within days should be discounted given 27% directional accuracy on this name. Watch for pre-announcement leaks in volume/OI.
1-6 month view depends entirely on July 23. Bull case: FCF stabilization guidance + explicit deleveraging commentary reprices to 8-9x forward EPS ($46.85) = $370-420 range, aligning with sell-side. Bear case: continued FCF bleed + working capital deterioration triggers covenant/liquidity fears and takes shares to $250-270. Base case: mixed print, stock ranges $290-330 as market waits for Q3 confirmation of the rebranding/parts-service pivot. What changes my mind: two consecutive quarters of FCF >$100M and quick ratio recovering above 0.30.
1-3 year terminal thesis is a cyclical recovery play in a consolidating industry. The 13-year average vehicle age creates a durable replacement cycle tailwind, and the Parts & Service pivot is the highest-margin part of the P&L. If management executes deleveraging (bringing debt/equity below 1.4x) and the rebranding delivers 100-200bps of SG&A leverage, mid-cycle EPS of $50-55 supports $500+ shares. Biggest structural risk: EV transition compresses dealer economics (lower service revenue per unit, direct-sales OEM models like Tesla), which is a slow-moving but existential secular headwind.
Revenue is stable at $22.5B TTM with 7.2% YoY growth, but the quarterly income statement shows sequential decay: revenue rolled from $5.78B (Q3'25) to $5.58B (Q4'25) to $5.41B (Q1'26), while net income has whipsawed from $140.5M (Q2'25) to $12.9M (Q3'25) to $43.6M (Q4'25) back to $130.2M (Q1'26) — inconsistent, though Q1'26 EBITDA of $274M is a real rebound. Gross margin at 16.2% and operating margin 4.6% are typical for auto retail. The balance sheet is the sore spot: $5.61B total debt vs $41.7M cash, debt/equity 1.98x, current ratio 0.95, quick ratio 0.21, negative working capital of -$194M in Q1'26 (deteriorated from +$260M in Q4'25). Free cash flow trajectory is the most alarming datapoint — $179.9M → $86.7M → $51.4M → $8.4M over the last four quarters, a clean sequential collapse driven by capex holding at $70-84M while OCF fell from $252M to $92M. ROE 11%, ROIC 5.5%, and P/B 1.24 suggest quality is decent but not compelling given the leverage. Dividend payout ratio at 8% is safe; capital allocation appears tilted toward acquisitions and rebranding rather than deleveraging, which is a concern at this point in the cycle.
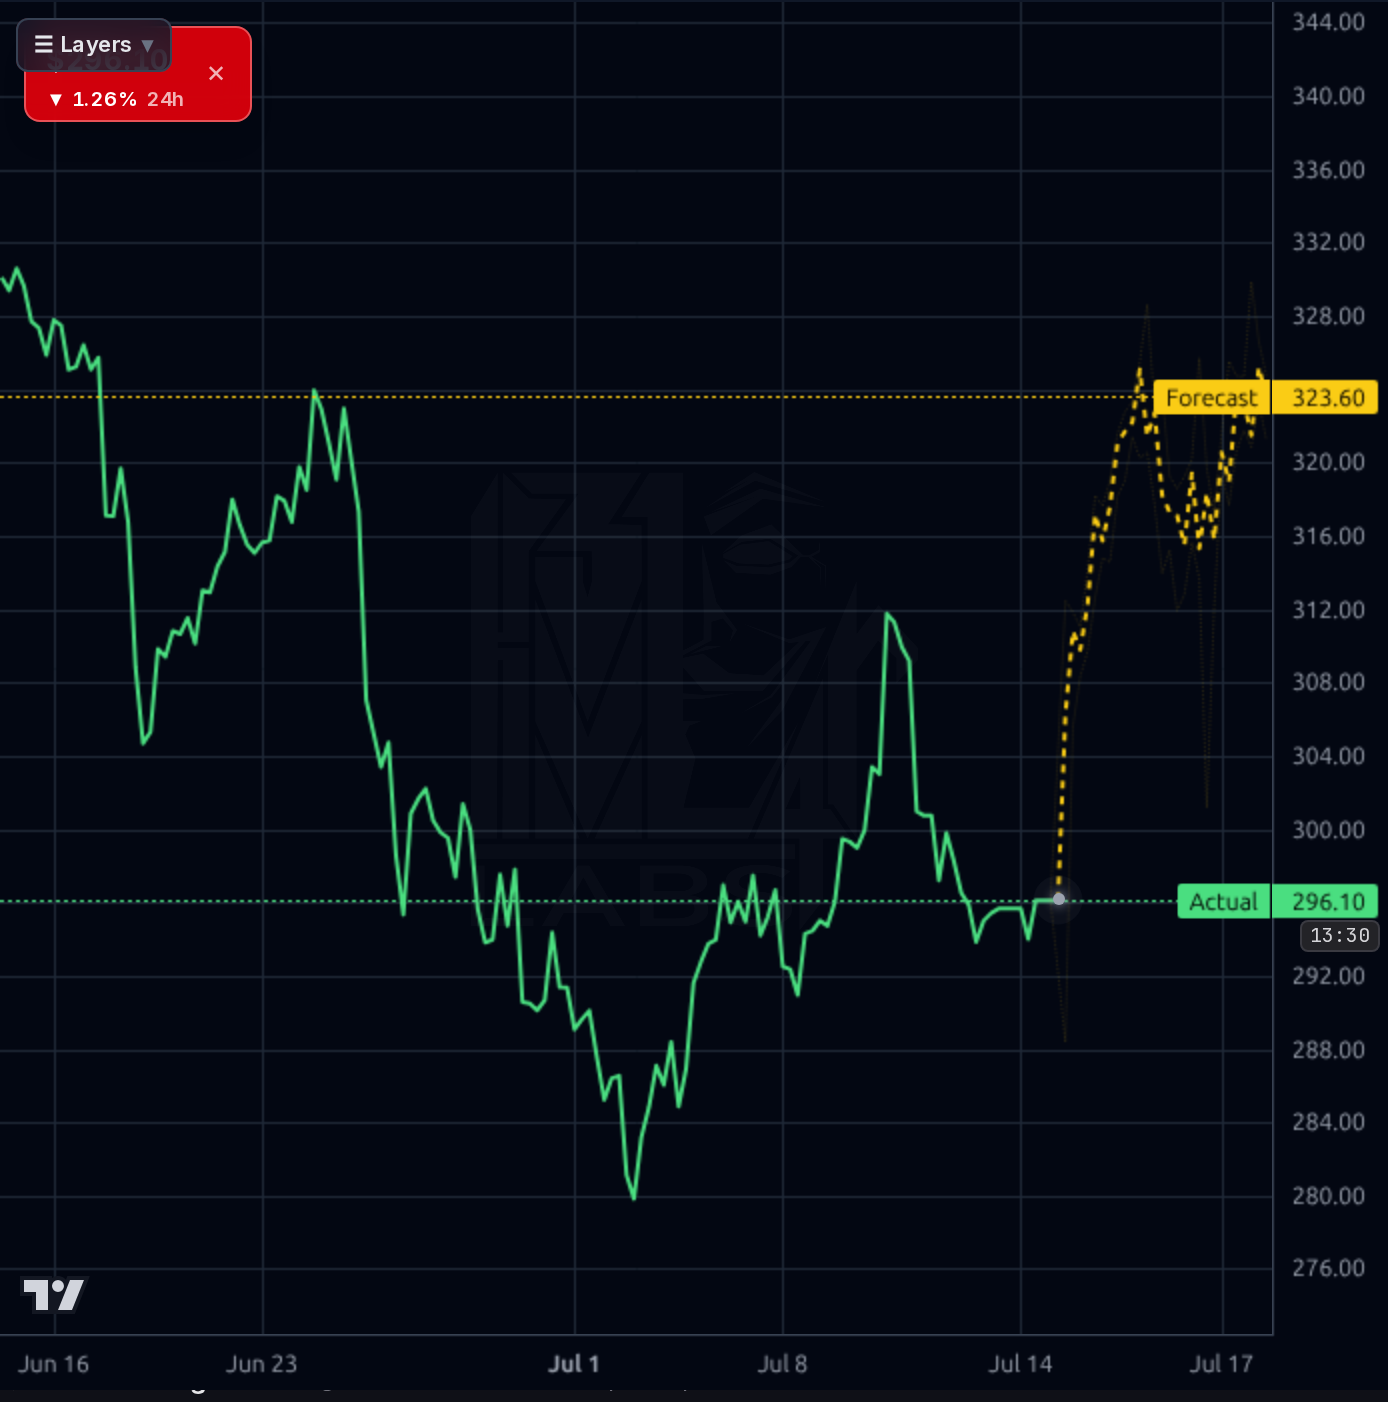
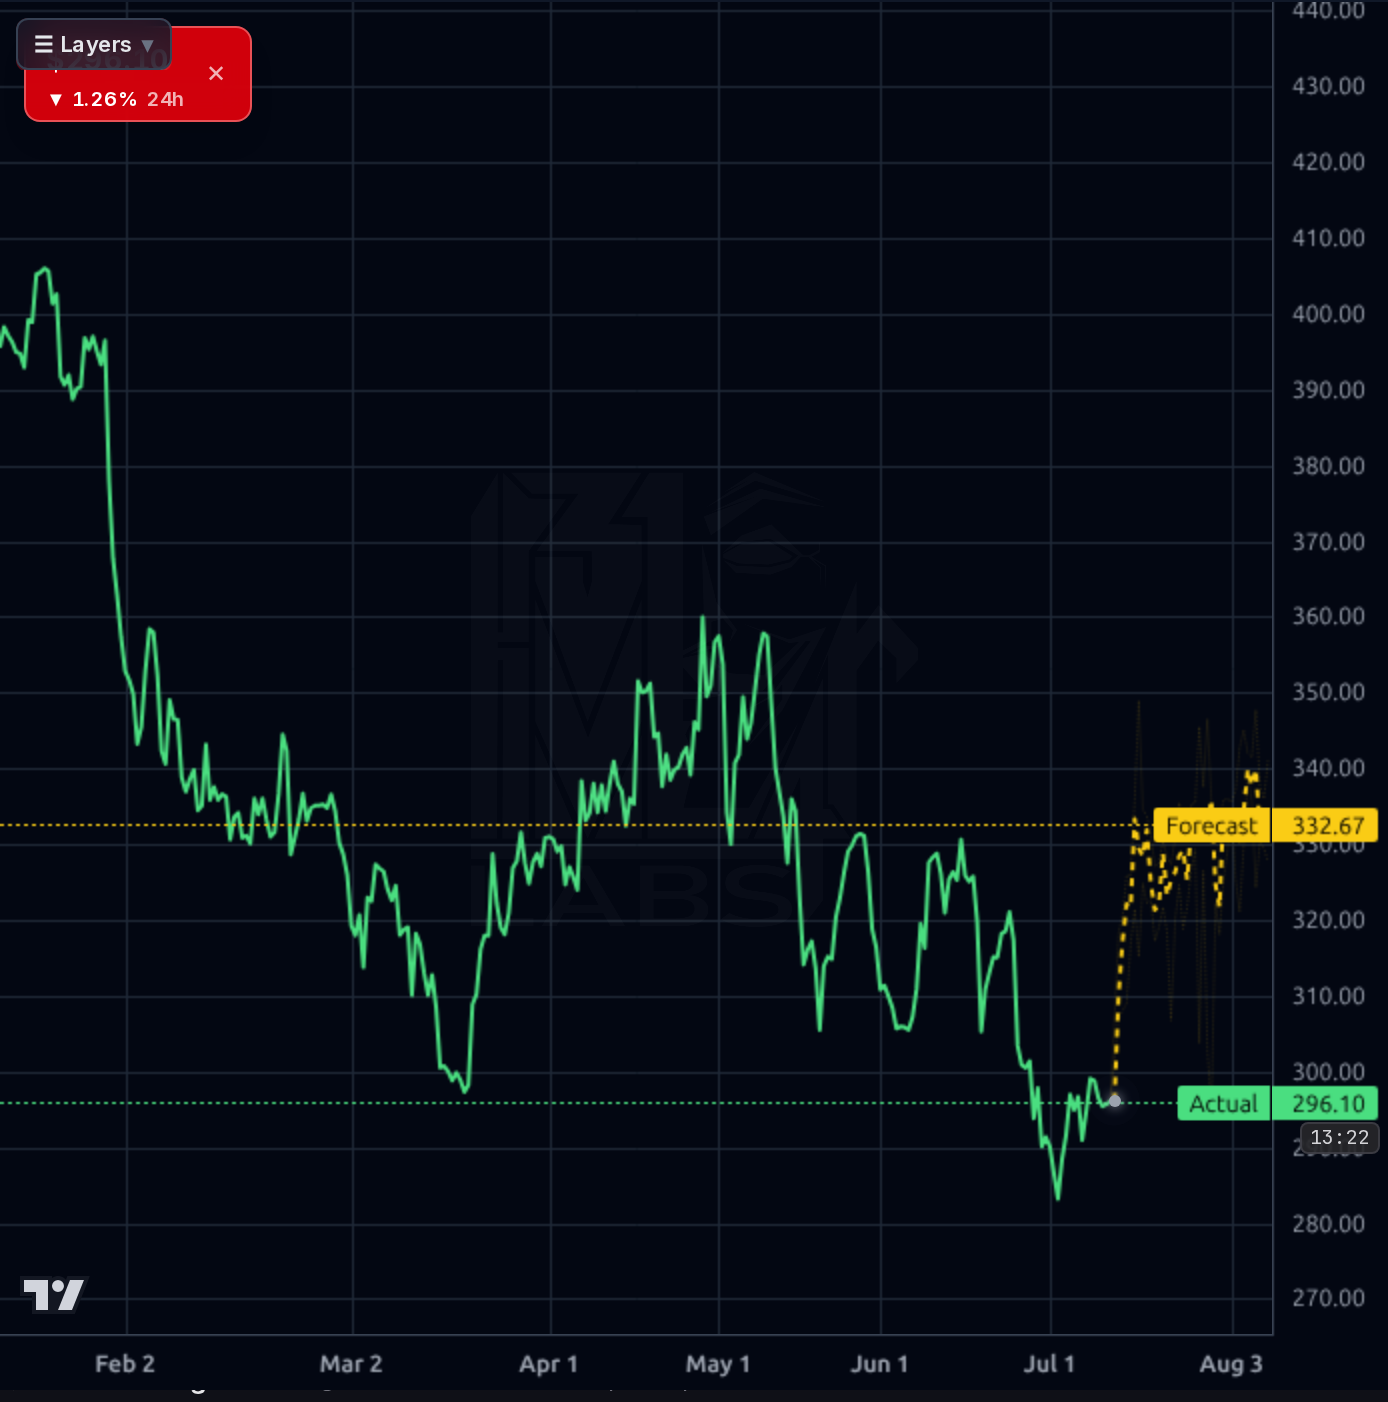
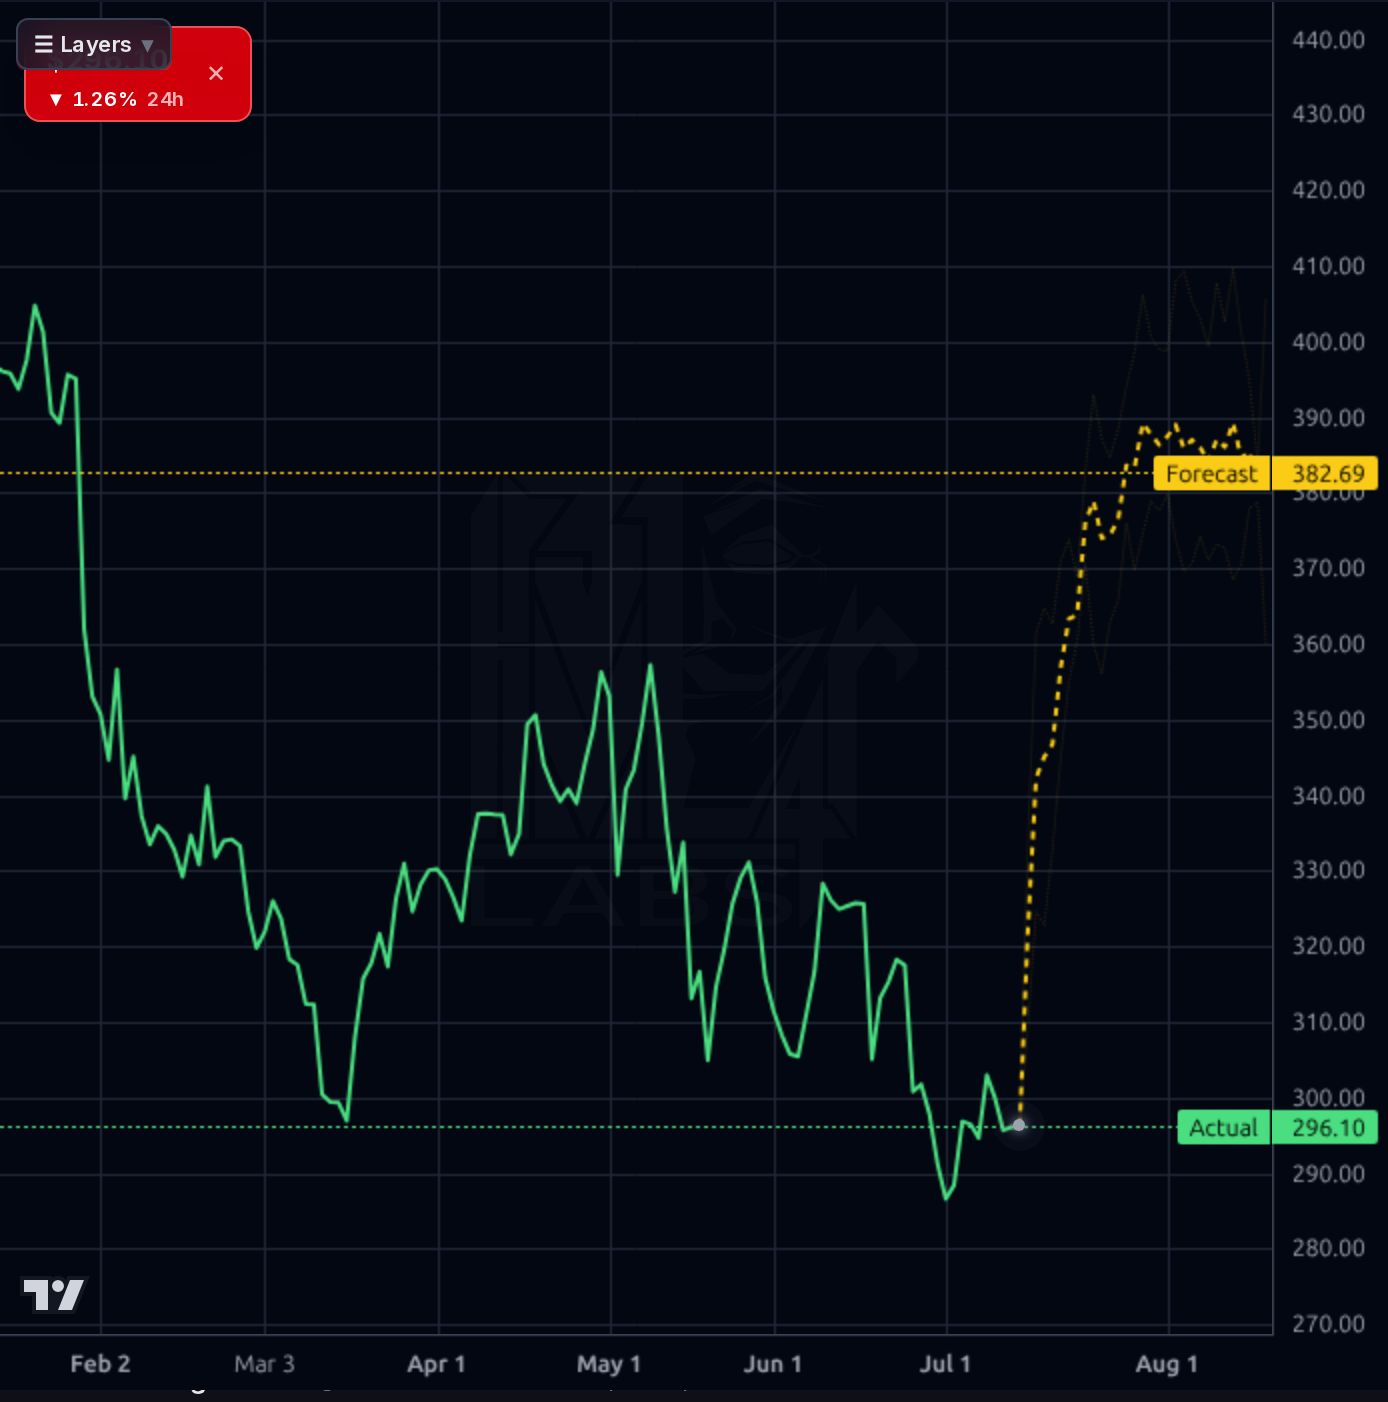
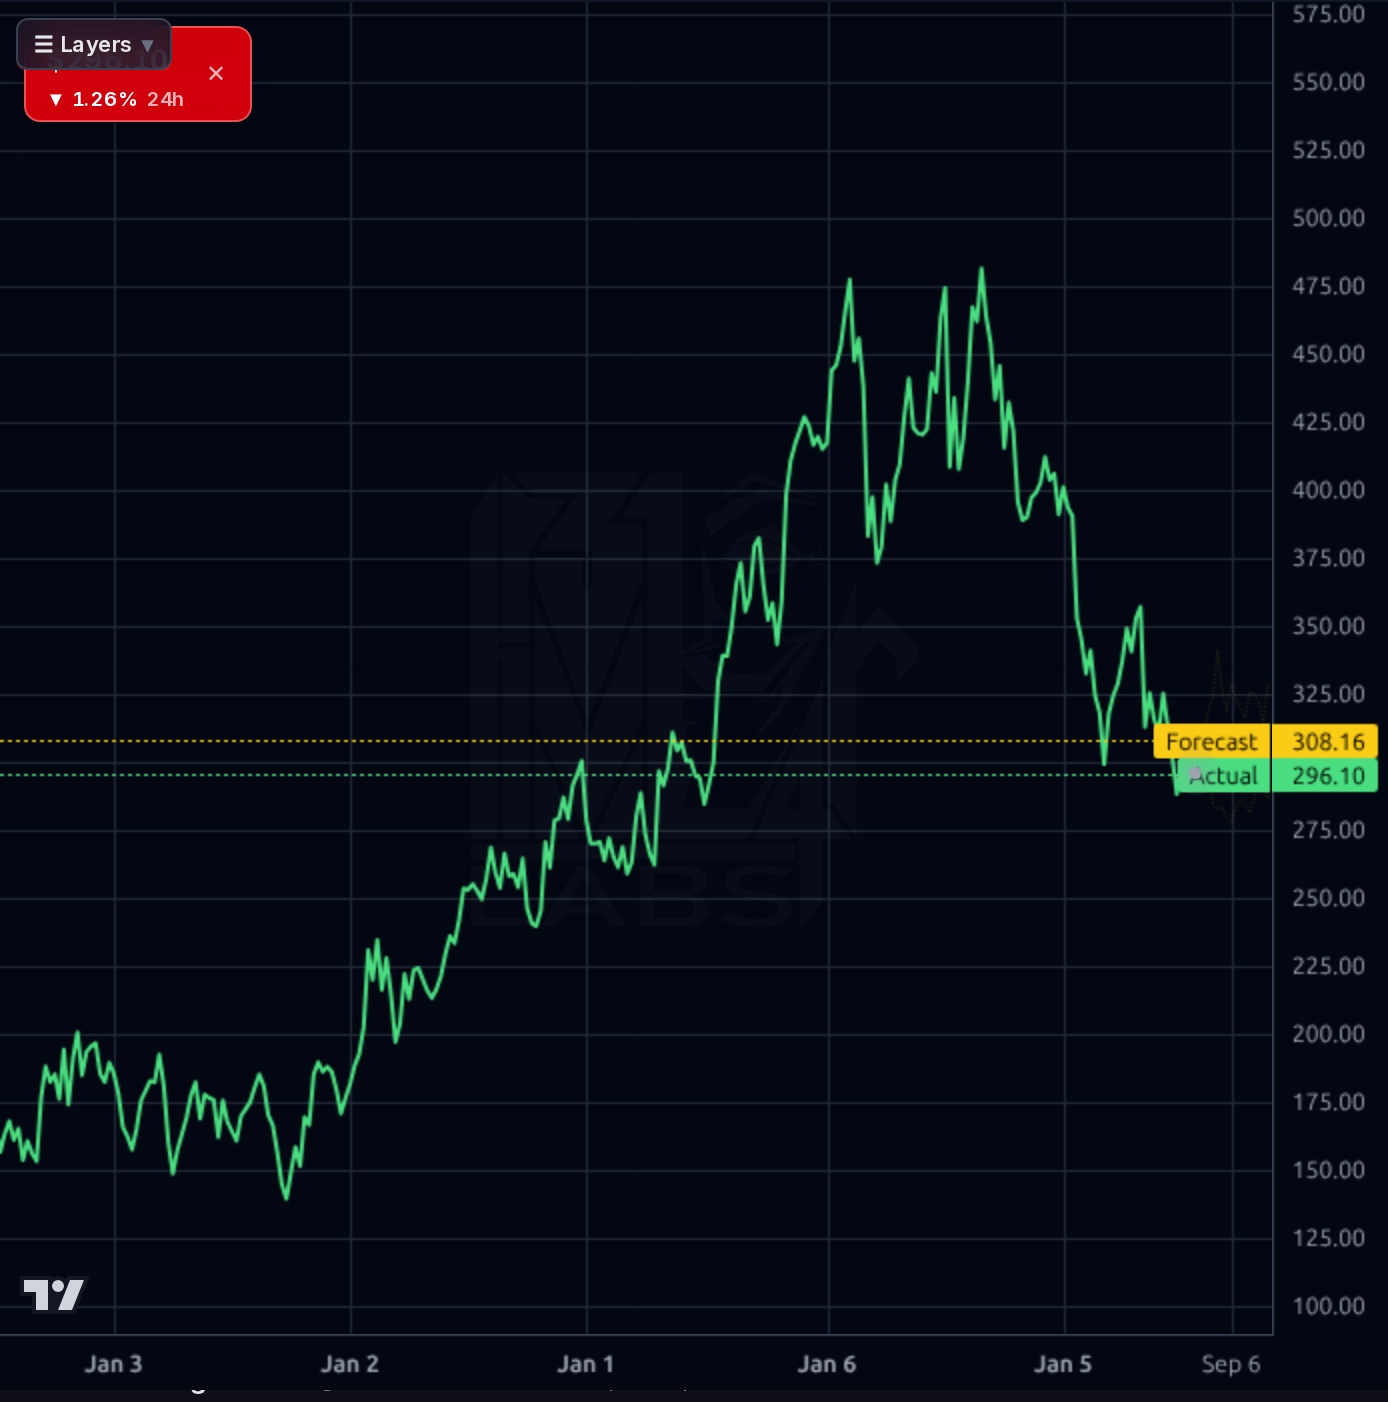
All four timeframes tell a consistent story of a wounded but stabilizing chart. On the weekly, GPI is down from a $488 high to $296, a 39% drawdown — a genuine bear leg. Daily/4h show the stock made a low near $280 in early July and has since based between $290-300 with a modest bounce; RSI 41.5, SMA20 -3%, SMA50 -7%, SMA200 -18% all confirm downtrend with mean-reversion room. The 1h chart shows sideways consolidation just above $296 support. The forecast bands lean aggressively bullish across all timeframes ($323 on 1h, $333 on 4h, $383 on 1d, $308 on 1wk), but the 1d realized accuracy is 27% vs 73% naive — the model has been systematically over-optimistic on this name, so those upside projections should be heavily discounted. Key support: $279 (52w low), $288-290 (recent basing). Key resistance: $308-315 (SMA20/50 confluence), then $330-340. Short interest 8.5% and short ratio 5.4 add squeeze potential on a positive earnings surprise, but also crowding risk if the print disappoints.
The signal in recent news is mixed-to-negative on sentiment but the operational story is coherent. UBS cut PT to $330 (Neutral) and Evercore cut PT to $440 (Outperform) — sell-side is trimming numbers but staying constructive; consensus target of $419 remains ~42% above spot. A SeekingAlpha piece frames the bull case cleanly: pivot to higher-margin Parts & Service, real estate moat, cost cuts. The nationwide Group 1 rebranding (Sterling McCall Hyundai transition) is the tangible execution item to watch for SG&A leverage. The negatives are structural: removal from major Russell growth indexes creates passive selling pressure, and YTD -25%, -38% over 12 months reflects the market's skepticism. Broader market noise (geopolitics, crypto) is irrelevant. The overwhelming signal is that the July 23 earnings print is the fulcrum — everything else is positioning around it.
- Nationwide Group 1 brand unification (Sterling McCall Hyundai just converted) — targeting SG&A leverage from consolidated marketing/ops
- Strategic pivot to Parts & Service as flagship high-margin business (per July 9 SeekingAlpha thesis) capitalizing on 13-year average US vehicle age
- UK expansion continues to contribute to 7.2% TTM revenue growth versus stagnant US auto retail peers
- Pre-owned vehicle operations elevation — replacement cycle demand from aging fleet
- Real estate moat from owned dealership footprint provides optionality and collateral value
- FCF collapse sequence: $180M → $87M → $51M → $8.4M over four quarters signals real deterioration, not noise
- Balance sheet stress: $5.6B debt vs $42M cash, quick ratio 0.21, negative working capital -$194M
- July 23 earnings is a binary event with high IV; guidance miss could trigger 15-20% gap down
- Removal from Russell growth indexes creates passive selling pressure independent of fundamentals
- Sell-side target cuts (UBS $338→$330, Evercore $500→$440) show numbers still coming down
- EV transition secular risk to dealer service revenue model over 3-5 year horizon
- Consumer credit tightening + rate environment pressures new vehicle affordability
- Short interest 8.5% is elevated — crowded short but also a warning signal
Get AI analysis on any stock
This is one of hundreds of Kronos AI reports — scored fundamentals & technicals, bull/base/bear price targets, a multi-horizon plan, and continuously-updated forecasts across the market. Create a free account to explore them all.
Create your free account →Already a member? Sign in · Join our Discord