HCA — AI Stock Forecast & Price Targets
Published 9/9/2026 · A free sample of K3vl4r’s AI-powered analysis.
Kronos price forecasts, scored fundamentals & technicals, and a multi-horizon plan.
View the live HCA price forecast →
HCA is a cash-generative, scale-advantaged hospital operator now trading at ~13x trailing / 12.5x forward earnings after a ~28% drawdown from the $556 52-week high, reflecting a 2026 guidance cut tied to payer-mix deterioration post-ACA subsidy expiration. The setup is a value/mean-reversion candidate near $400 support with a $453 sell-side target, but structural leverage ($51.6B debt, negative equity of -$6.6B) and an active securities-fraud probe cap conviction ahead of the Oct 23 print.
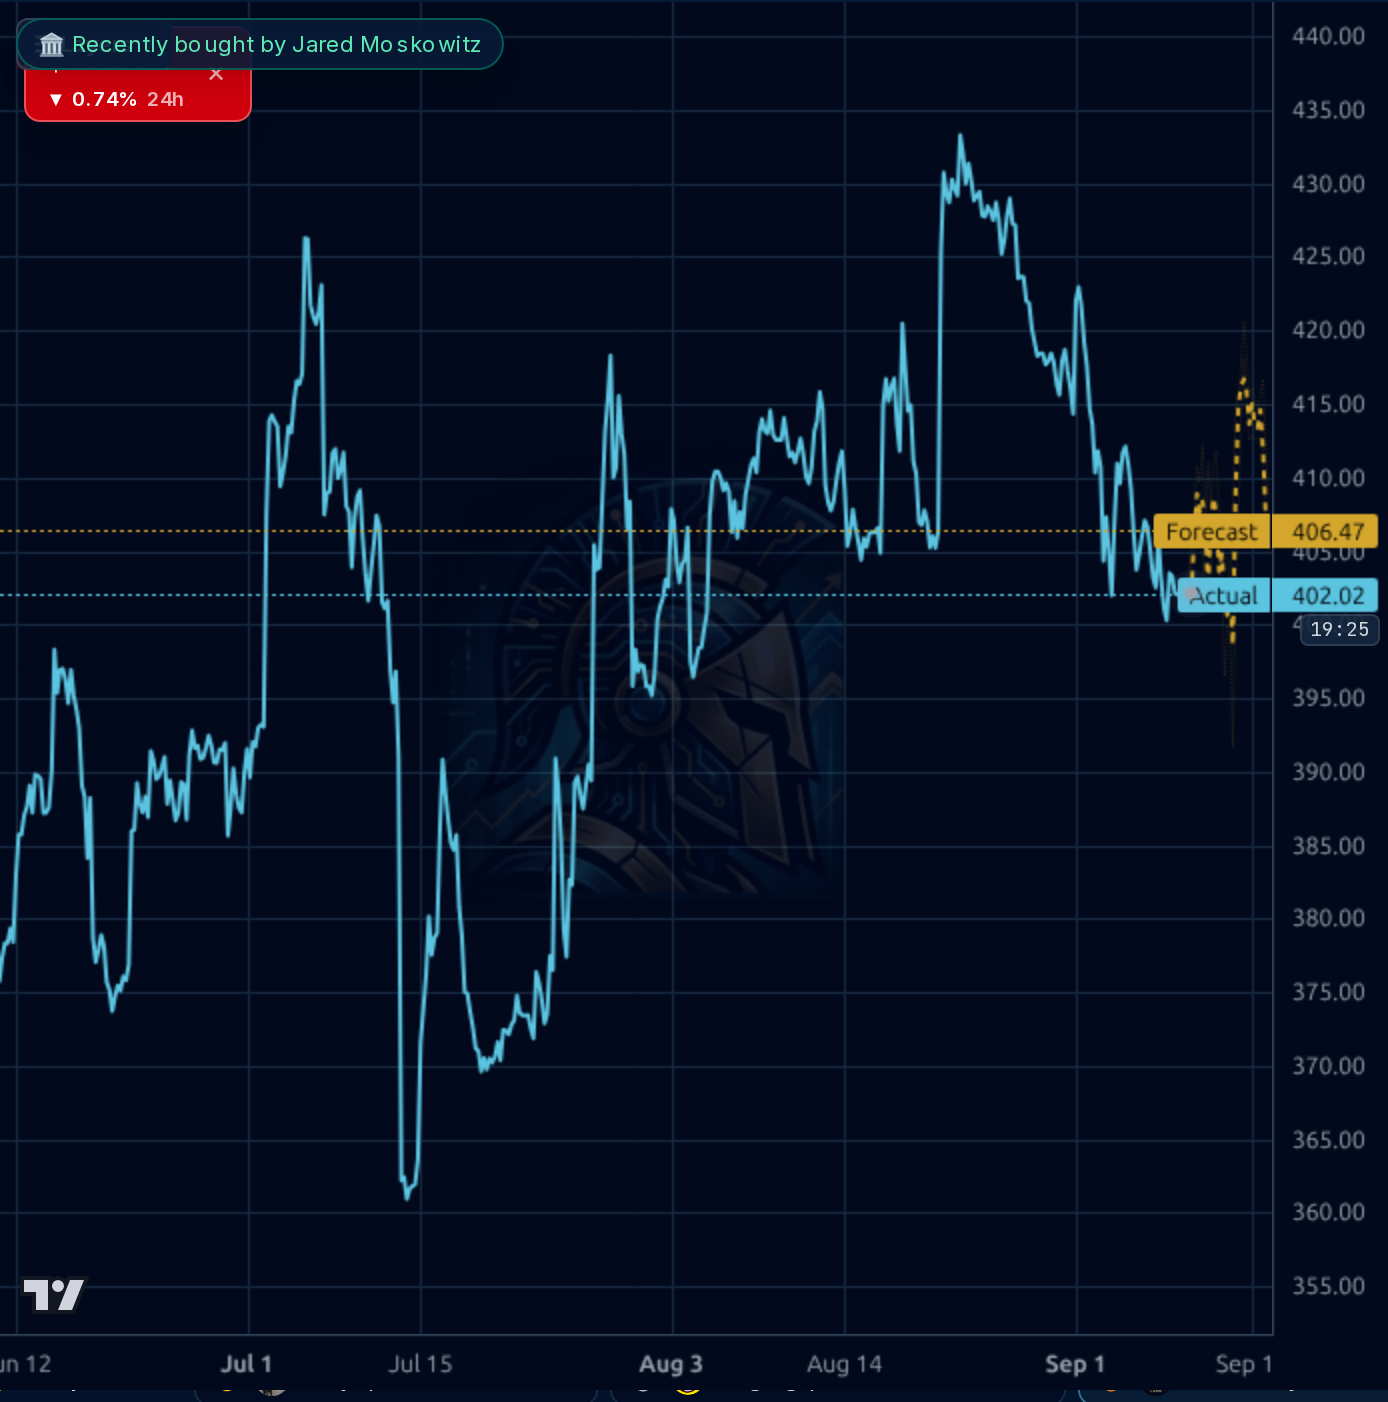
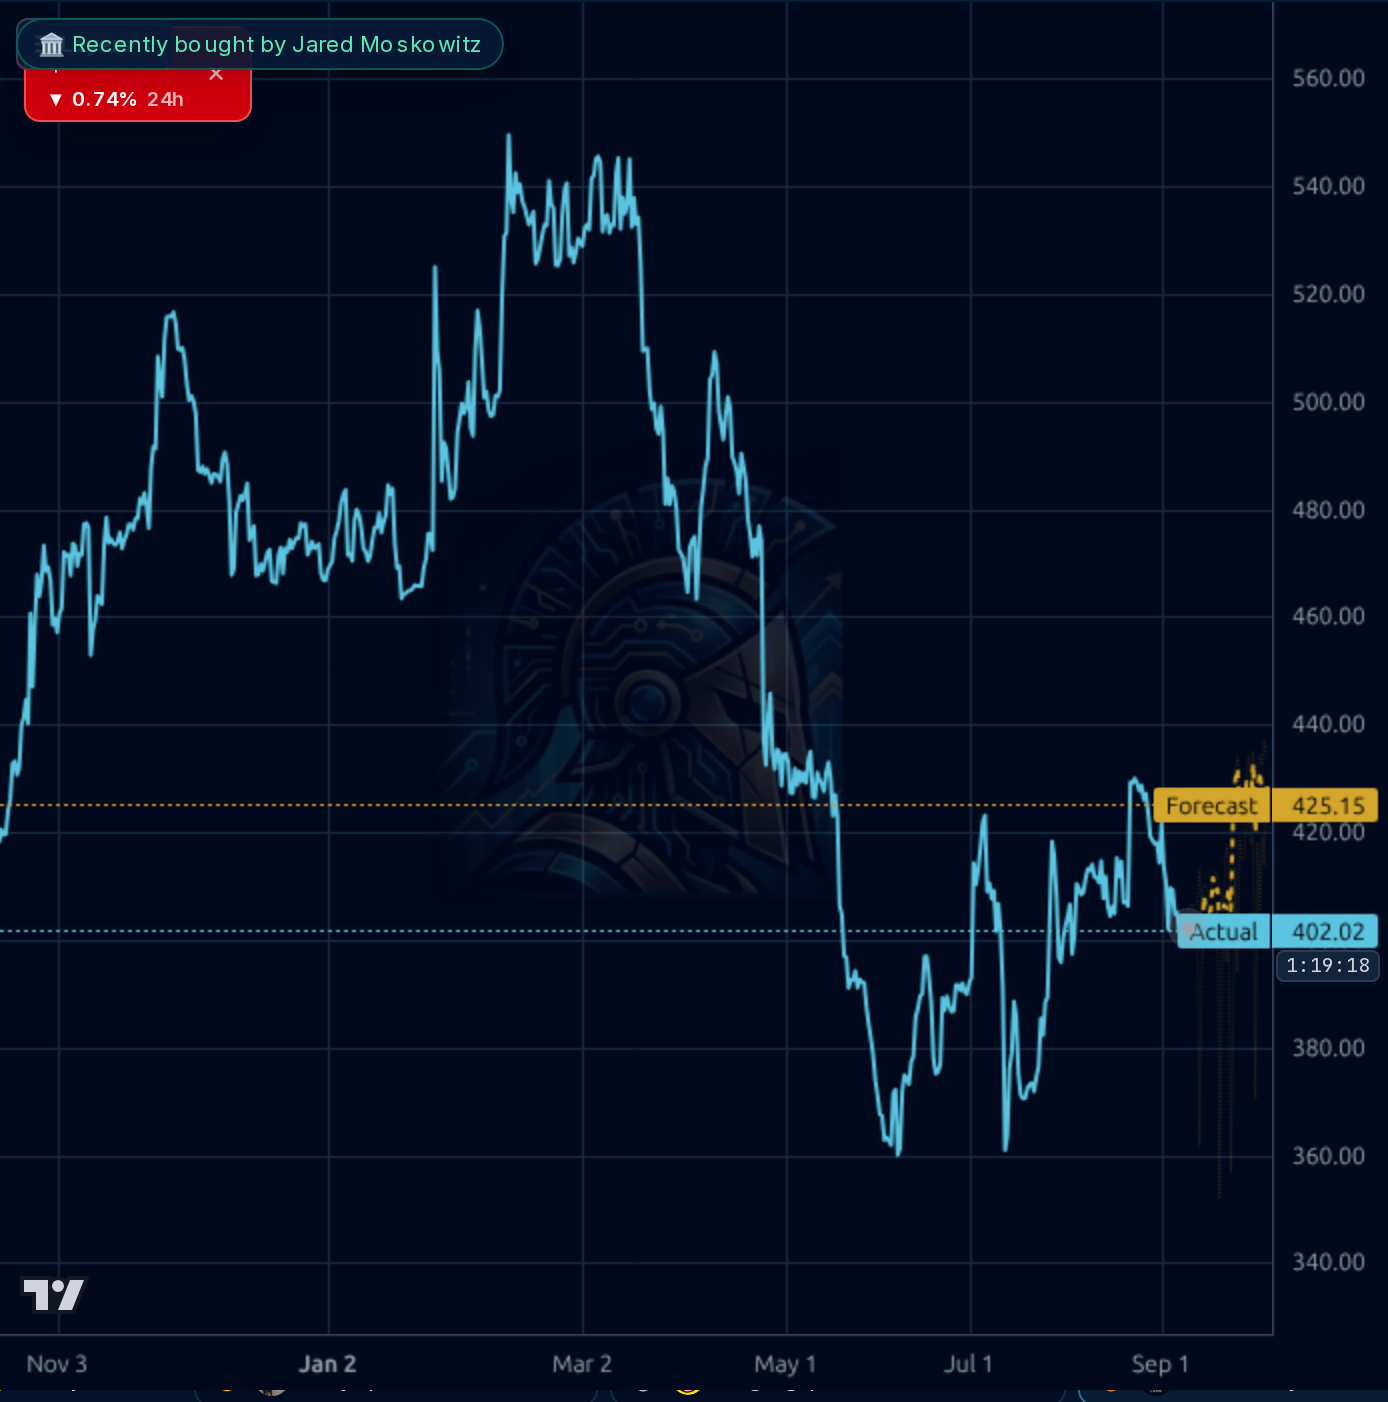
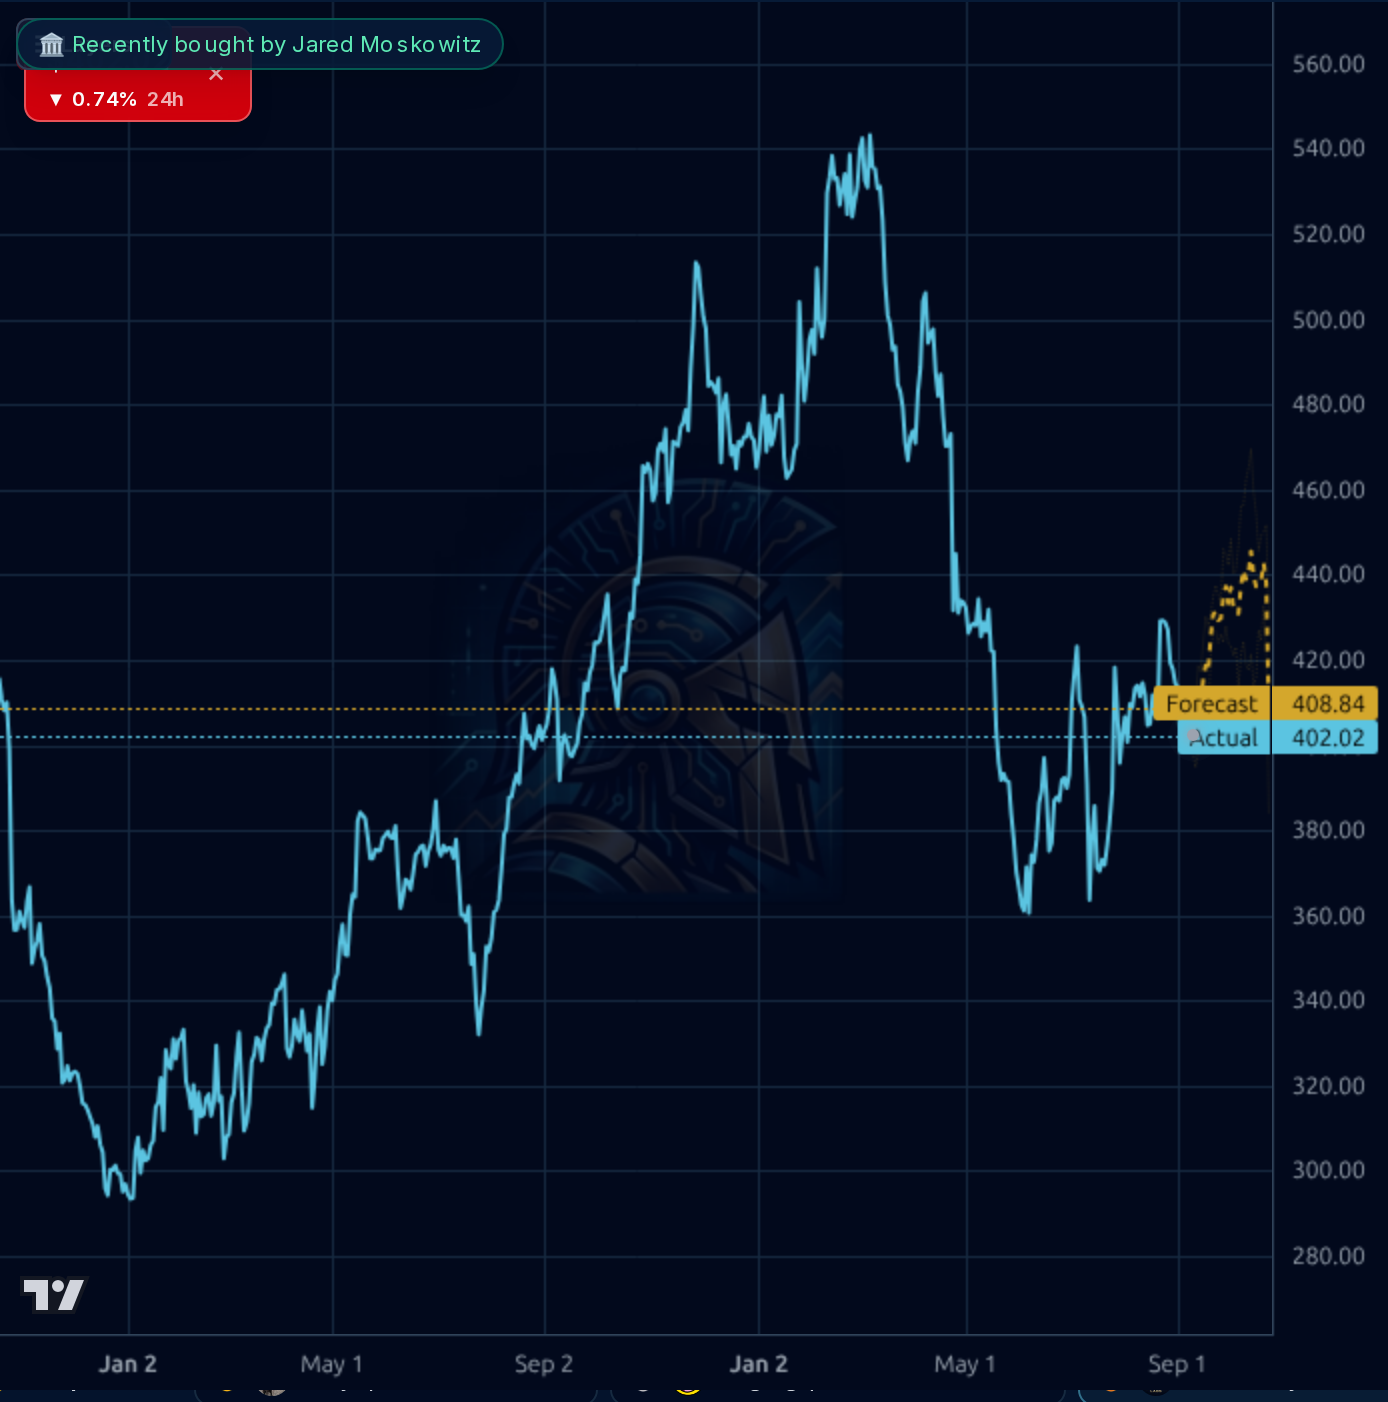
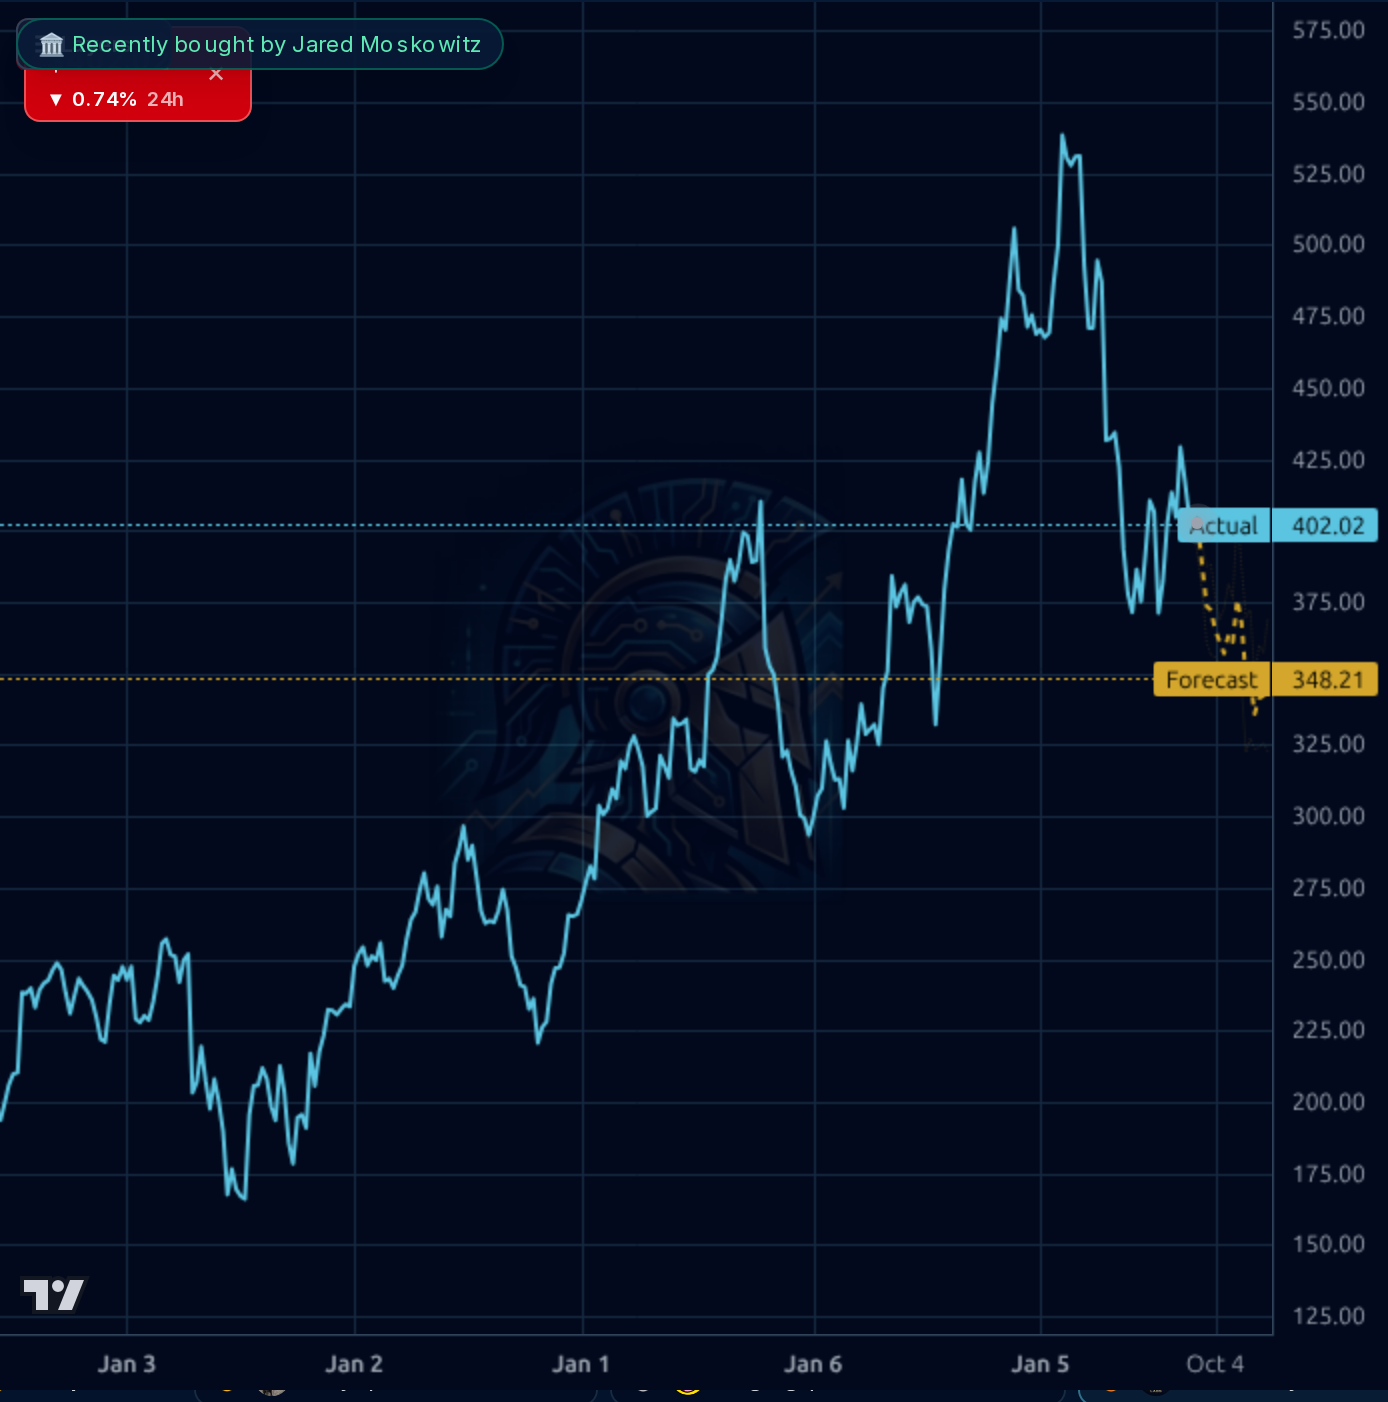
1-4 week view: Tactical mean-reversion long is defensible at $400-402 with tight risk. The stock has held the $395-400 shelf multiple times, RSI is oversold-neutral at 44.5, and the near-term model target sits at $406-408. Entry $398-403, stop below $392 (loss ~2.5%), first target $415-418 (prior resistance/gap fill), stretch $425. Size SMALL — this is pre-earnings, and Oct 23 is a binary risk you cannot swing through. Exit or hedge fully by Oct 20. Invalidation: daily close below $392 or any material negative headline on the securities probe.
1-6 month view: HOLD/ACCUMULATE bias. At 12.5x forward EPS on a business generating $11B+ operating cash flow and buying back stock aggressively, the risk/reward tilts positive IF Q3 confirms the H2 cadence and payer-mix headwind is contained at the guided ~$400M/quarter run-rate. Expected 6-month return range: -10% to +15%. Base case $435 (RBC PT, ~8% upside) as payer mix stabilizes and buybacks compound; bear case $360-375 on a second guide cut or adverse probe development; bull case $470-490 if 2027 EPS resets higher and multiple re-rates to 14x. Change my mind: (a) Q3 misses or guides down again → cut, (b) securities probe escalates to formal charges → exit, (c) another $200M+ payer-mix revision → reset lower.
1-3 year view: HCA remains the dominant scale operator in a fragmented but consolidating US hospital market, with proven ability to compound FCF and return capital (10Y perf +416%). Terminal thesis rests on: (1) demographic tailwind from aging population driving inpatient/surgical demand, (2) pricing power from local-market density, (3) continued share repurchases at reasonable multiples shrinking the float. The structural risk that could break this is a durable reimbursement policy shift — expanded government-payer share (Medicare-for-All-lite outcomes, permanent ACA subsidy loss, site-neutral payment legislation) would compress the margin profile that justifies the $52B debt load. Negative equity is not a solvency issue while $11B OCF services $51.6B debt comfortably (~4.6x EBITDA leverage), but it removes any margin of safety in a stress scenario. Fair value in a stable-policy world: $500-550.
Revenue growth remains solid: Q2 2026 revenue of $20.23B was up 8.7% YoY and beat consensus by ~2.5%, with TTM revenue at $78.0B. Operating margin held at 15.2% and gross margin expanded to 44.8% in Q2, indicating pricing/mix stability at the operating line despite payer-mix headwinds; net margin (8.4%) has compressed vs. Q4 2025 (9.6%). Cash generation is the real story — TTM operating cash flow of $11.1B and FCF of $3.7B support the aggressive $2.06B Q2 buyback and the $0.78 dividend. The balance sheet remains the persistent overhang: $51.6B total debt, only $1.0B cash, working capital of -$122M, current ratio 0.99, and stockholders' equity of -$6.6B (accounting artifact of years of buybacks, but real from a covenant/flexibility standpoint). EV/EBITDA of ~9x on $15.7B EBITDA is undemanding for a scale operator, and ROIC of 17.7% confirms capital productivity — but the guidance cut driven by an estimated $400M/quarter payer-mix revenue hit means forward EPS estimates ($32.07 fwd) may still have downside risk.
Multi-timeframe picture is decidedly weak. The weekly chart shows a clear break of the March 2026 uptrend from the $540s peak, with price now at $402 sitting -27.8% from the 52-week high and only +13.6% off the $354 52-week low. The daily is in a lower-highs/lower-lows structure; the 4h shows an August rally to $430 that failed and rolled over into the current $400 zone. On the 1h, price is pinned at the lower band with the model's forecast ($406.47) just above spot ($402.02) — a modest mean-reversion setup. RSI 44.5 is neutral-weak; SMA20 -2.8%, SMA50 -0.3%, SMA200 -10.98% confirms an intermediate downtrend with price hugging the 50-day. Key support is $395-400 (multi-month floor visible on daily); a clean break opens $375 and then $354. Resistance stacks at $418-425 (recent lower high) and $435. Notably, the forecast model's longer-horizon (16-19d) directional accuracy is 0% vs. 100% naive baseline — its slightly bullish 1d reading should be heavily discounted, and the 1wk model reads bearish.
The dominant signal is the 2026 guidance cut driven by ACA subsidy expiration worsening payer mix (~$400M/quarter revenue impact), soft elective surgery volumes, and rising costs — this triggered corporate/support-function layoffs, at least one hospital divestiture, and controversial offshoring of IT/back-office roles to Hyderabad. RBC reiterated Outperform with a $435 PT on Sept 8, citing consistent H2 cadence messaging from management, which is a modest counterweight. The more concerning item is the Pomerantz securities-fraud investigation into potential misleading disclosures — early-stage and speculative, but a real overhang until it resolves. Noise to filter: retail sentiment on the India offshoring is emotional but not investable, and the Congressional trade (dependent, $1-15k, three months ago) is too small to weight. Ex-div Sept 16 ($0.78) is trivial. The binary catalyst is Q3 earnings on Oct 23 — management will need to prove the H2 cadence guide is intact.
- Aggressive capital return: $2.06B in Q2 2026 buybacks (4.75M shares) is ~2.4% of market cap in a single quarter, meaningfully compounding per-share metrics
- Q3 2026 print Oct 23 — the near-term catalyst that could re-anchor 2026/2027 estimates and reset the multiple
- Cost-out program: confirmed layoffs and offshoring of IT/back-office to Hyderabad should partially offset the payer-mix margin drag by 2027
- 8.7% YoY Q2 revenue growth demonstrates same-store volume and pricing durability despite mix headwinds
- Portfolio optimization via at least one hospital divestiture signals discipline on underperforming assets
- Demographic tailwind: aging U.S. population supports multi-year inpatient and surgical demand growth
- Pomerantz securities-fraud investigation — early-stage but a real overhang on multiple until resolved
- Payer-mix deterioration post-ACA subsidy expiration already costing ~$400M/quarter in revenue; risk of further deterioration
- Negative stockholders' equity (-$6.6B) and $51.6B debt leave zero margin for error in a rate-shock or reimbursement-shock scenario
- Q3 earnings Oct 23 is a binary event — second consecutive guide cut would break the $395 support and reset the range
- Forecast model directional accuracy (46%) trails the naive baseline (57%) — this specific name is hard to model short-term
- Reputational/execution risk from offshoring critical IT functions during a period of cost pressure
- Policy risk from any further healthcare reimbursement legislation (site-neutral payments, Medicaid rate changes)
- Broader market late-markup/distribution regime with deteriorating breadth adds beta risk (1.11) to any long
Get AI analysis on any stock
This is one of hundreds of Kronos AI reports — scored fundamentals & technicals, bull/base/bear price targets, a multi-horizon plan, and continuously-updated forecasts across the market. Create a free account to explore them all.
Create your free account →Already a member? Sign in · Join our Discord