HIW — AI Stock Forecast & Price Targets
Published 7/31/2026 · A free sample of K3vl4r’s AI-powered analysis.
Kronos price forecasts, scored fundamentals & technicals, and a multi-horizon plan.
View the live HIW price forecast →
Highwoods Properties (HIW) shows strong recent earnings beat and guidance upgrade, but technicals suggest overextension with price near 52-week high. Valuation remains elevated versus growth prospects, though dividend yield offers income appeal. Momentum is mixed with short-term upside capped by forecast bands.
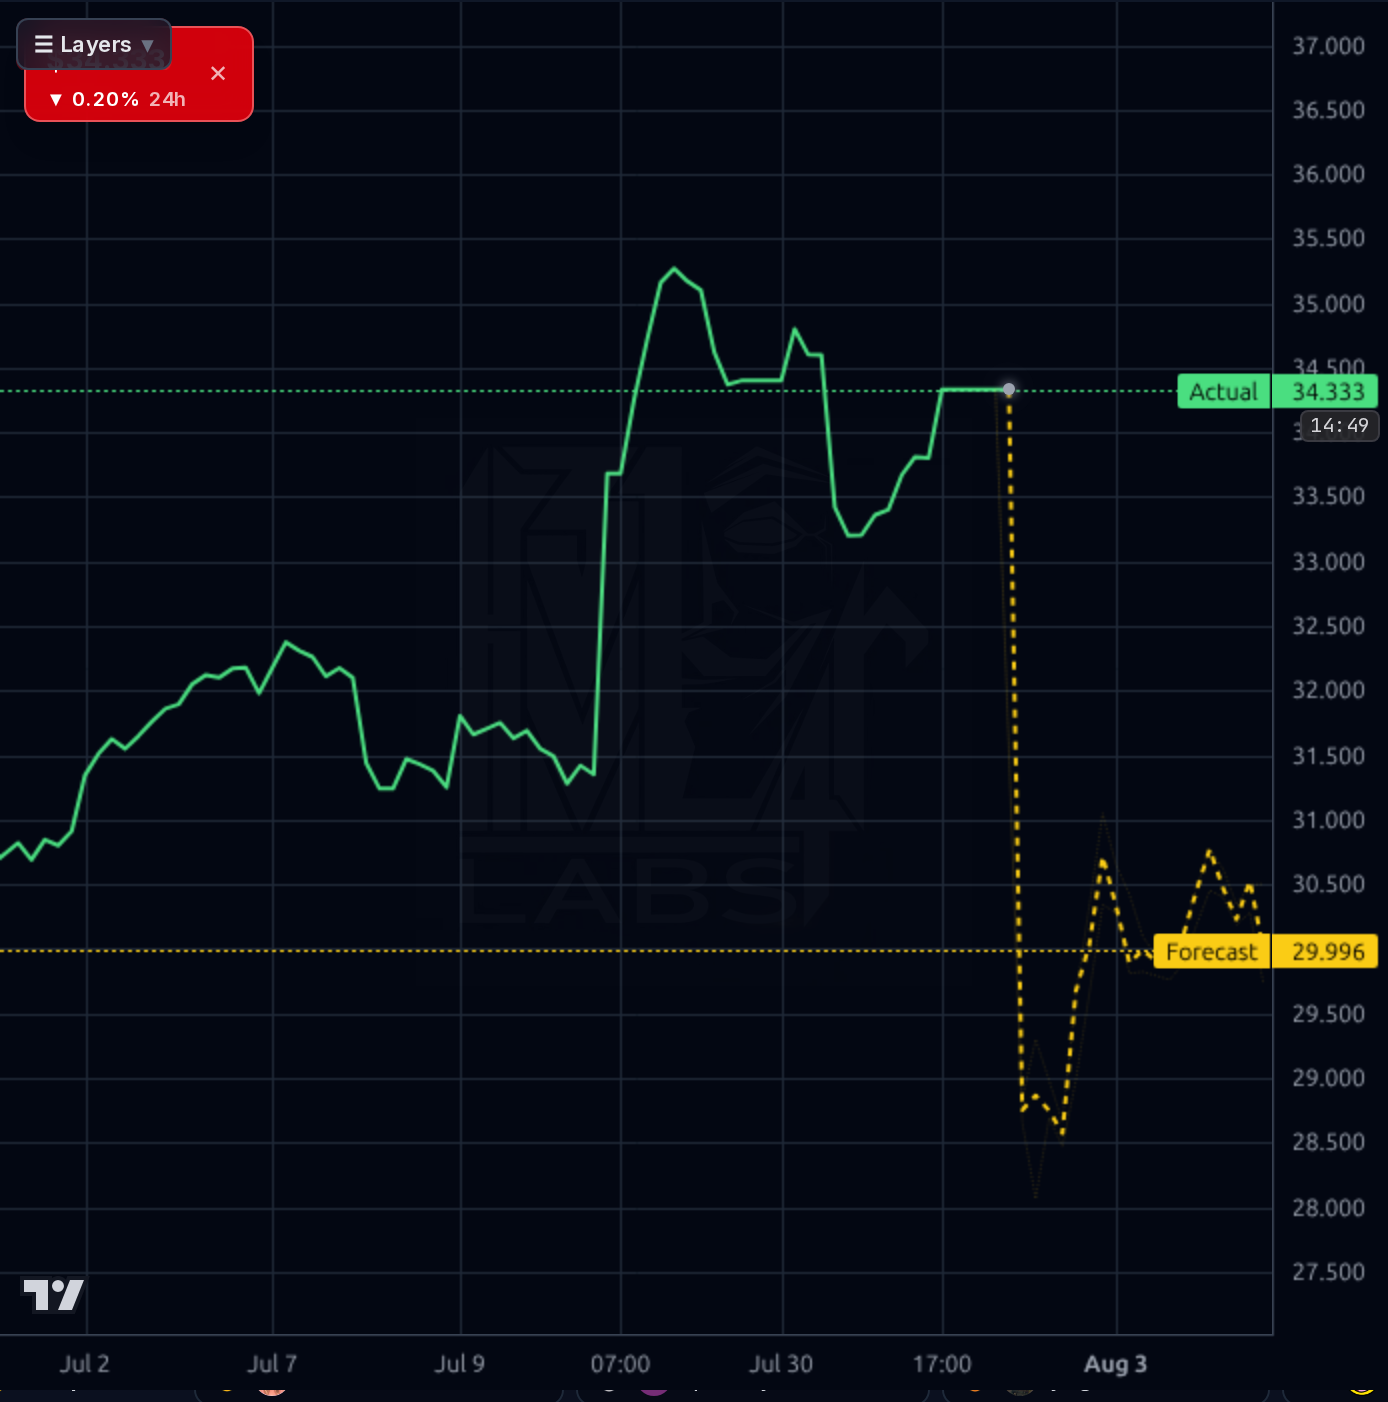
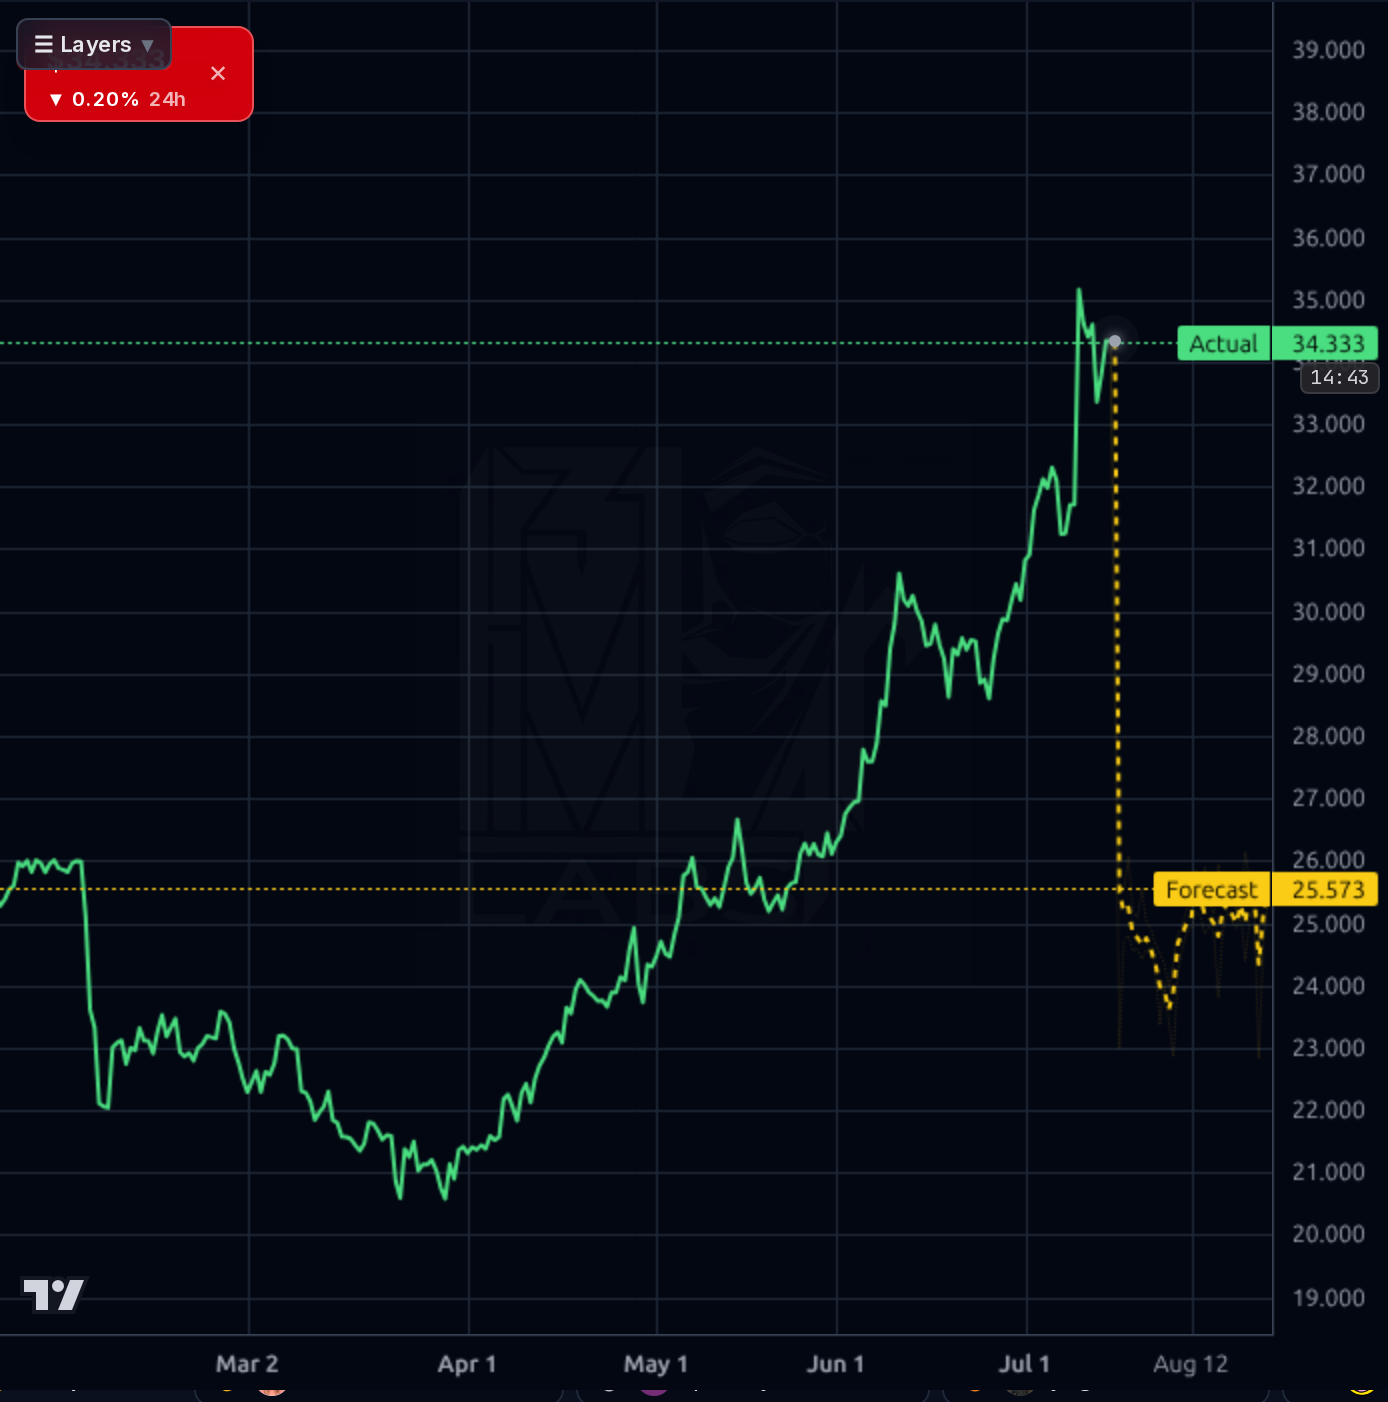
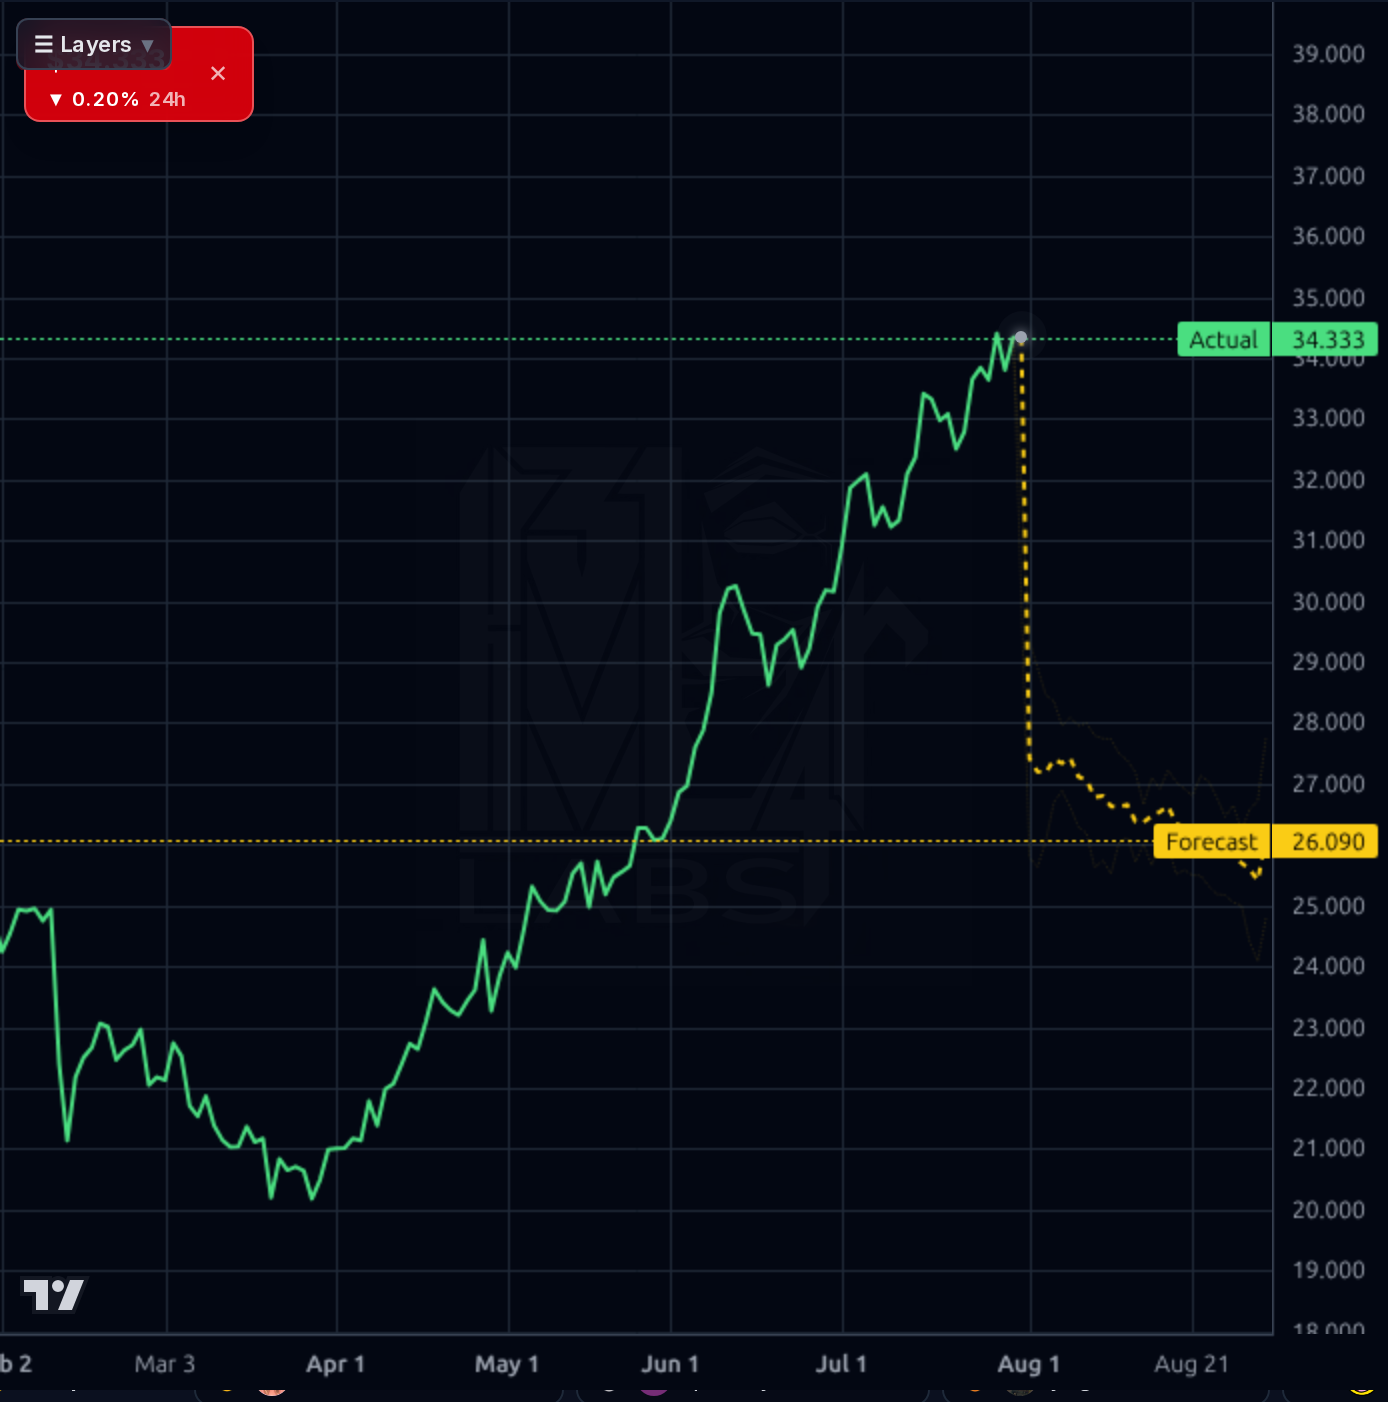
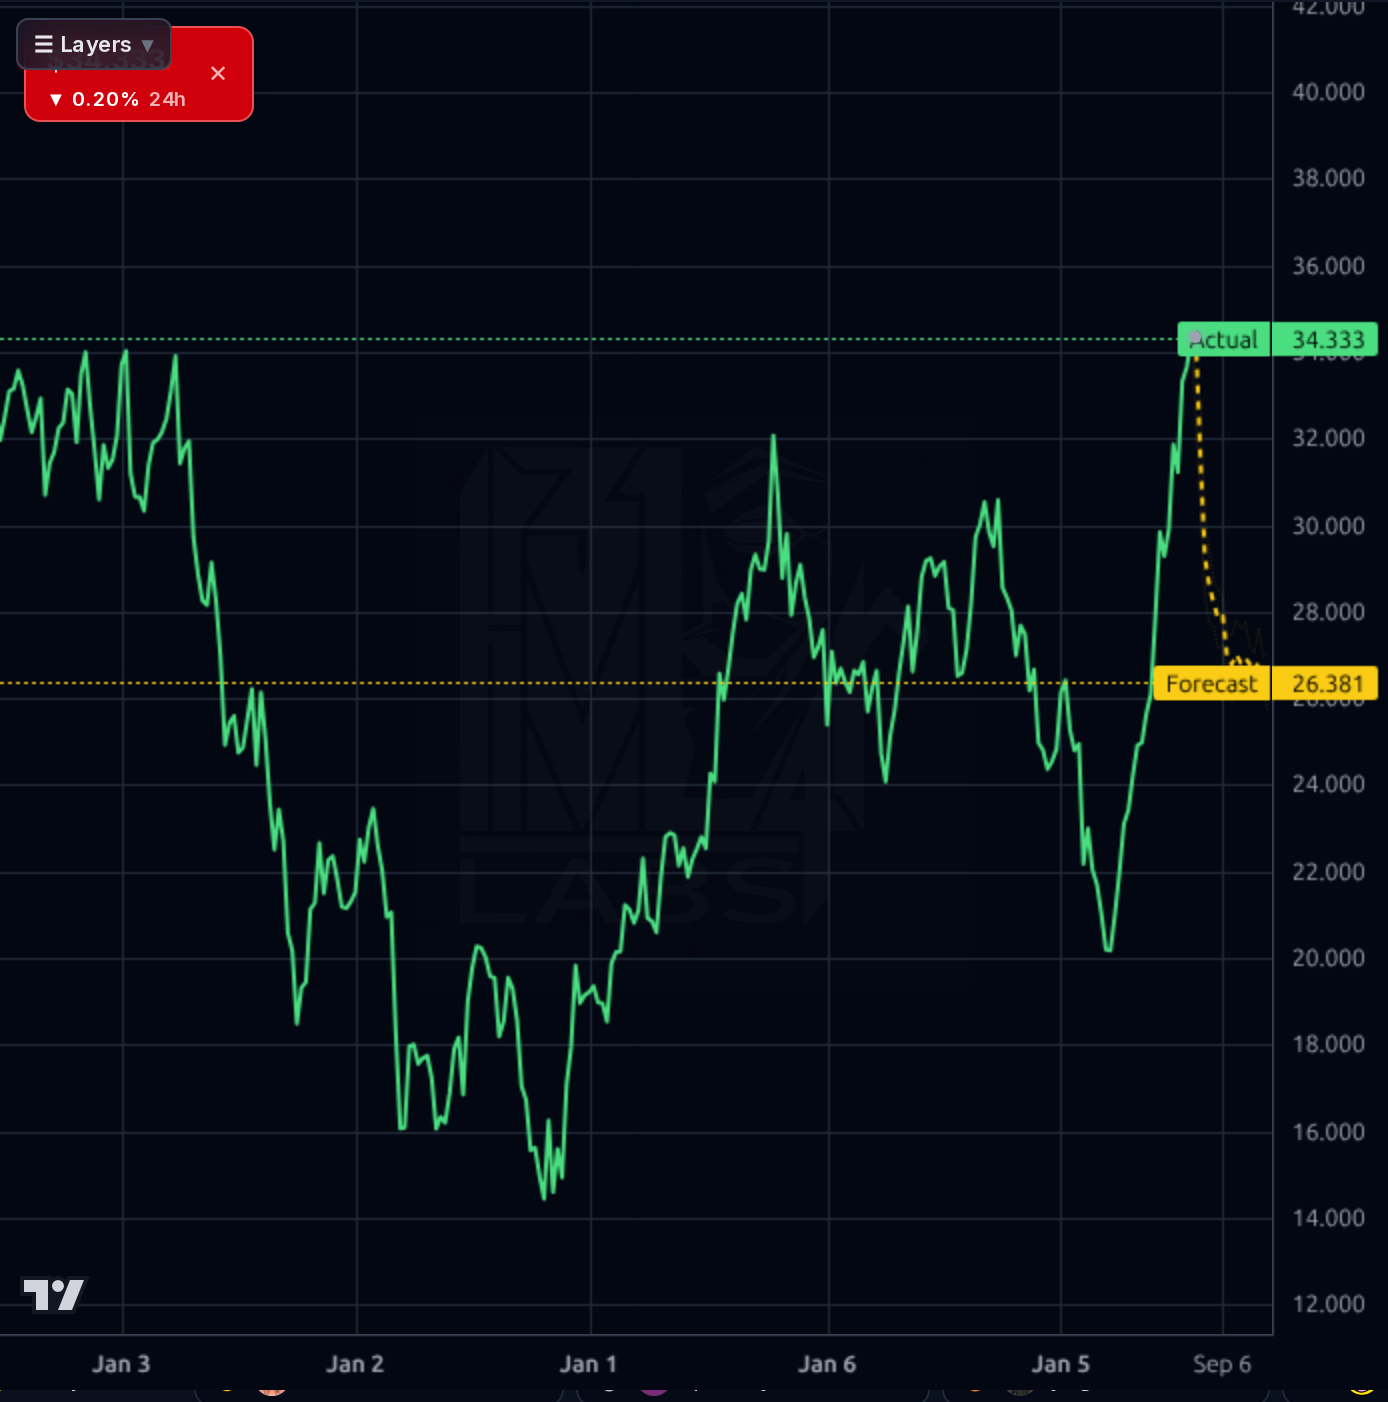
Hold until price breaks below $30.00 (invalidation level). Monitor for earnings call on Oct 27; if price holds above $33.50, consider trimming to reduce exposure. Short-term catalyst: ex-dividend date Aug 17 with $0.50 dividend.
Target $35.00 by Q4 2026 based on Morgan Stanley's PT. Catalysts include continued leasing growth and potential FFO beat in Q3. Invalidation if price falls below $28.00 or fails to break above $34.00.
Terminal value driven by stable office REIT fundamentals, but secular risk from remote work adoption could limit upside. Long-term catalysts include improved occupancy rates and capital recycling into future investments. Structural risk: interest rate sensitivity and competition from tech-driven co-working spaces.
Revenue grew 7.9% QoQ to $216.38M, with gross margins at 67.3%, operating margins at 26.5%. The company raised FY2026 FFO guidance from $3.40-$3.68 to $3.46-$3.70 vs $3.53 estimate, and beat Q2 EPS by 4.65% ($0.90 vs $0.86). However, forward P/E of 48.29x is elevated versus historical norms, with a high debt-to-equity ratio (132.65) and low ROE (6.82%). Dividend yield of 5.81% provides income but may be vulnerable to rate hikes.
Price has broken above $34.00 on the daily chart, with actual price at $33.80 near the 52-week high ($35.44). The forecast band shows a tight range between $26.09 and $26.38 (yellow), suggesting potential downside pressure. Support is at $26.09 (forecast low) with resistance at $35.44 (52-week high). RSI of 65.78 indicates overbought conditions, while the SMA20 (3.50%) and SMA50 (12.75%) show positive momentum but are below the price.
Recent earnings beat with strong leasing and occupancy growth validates the breakout. Morgan Stanley raised PT to $35 from $23, while Mizuho raised to $30 from $25. However, forward P/E of 48.29x is elevated versus historical norms, and short interest at 9.41% suggests some bearish positioning. The forecast band's tight range indicates potential near-term volatility.
- Q2 FFO beat of $0.90 vs $0.86 estimate with strong leasing progress
- Raised FY2026 FFO guidance to $3.46-$3.70 vs $3.53 estimate
- Elevated forward P/E (48.29x) versus historical norms
- Short interest at 9.41% indicating potential downside pressure
- Secular risk from remote work adoption reducing office demand
Get AI analysis on any stock
This is one of hundreds of Kronos AI reports — scored fundamentals & technicals, bull/base/bear price targets, a multi-horizon plan, and continuously-updated forecasts across the market. Create a free account to explore them all.
Create your free account →Already a member? Sign in · Join our Discord