HLLY — AI Stock Forecast & Price Targets
Published 8/14/2026 · A free sample of K3vl4r’s AI-powered analysis.
Kronos price forecasts, scored fundamentals & technicals, and a multi-horizon plan.
View the live HLLY price forecast →
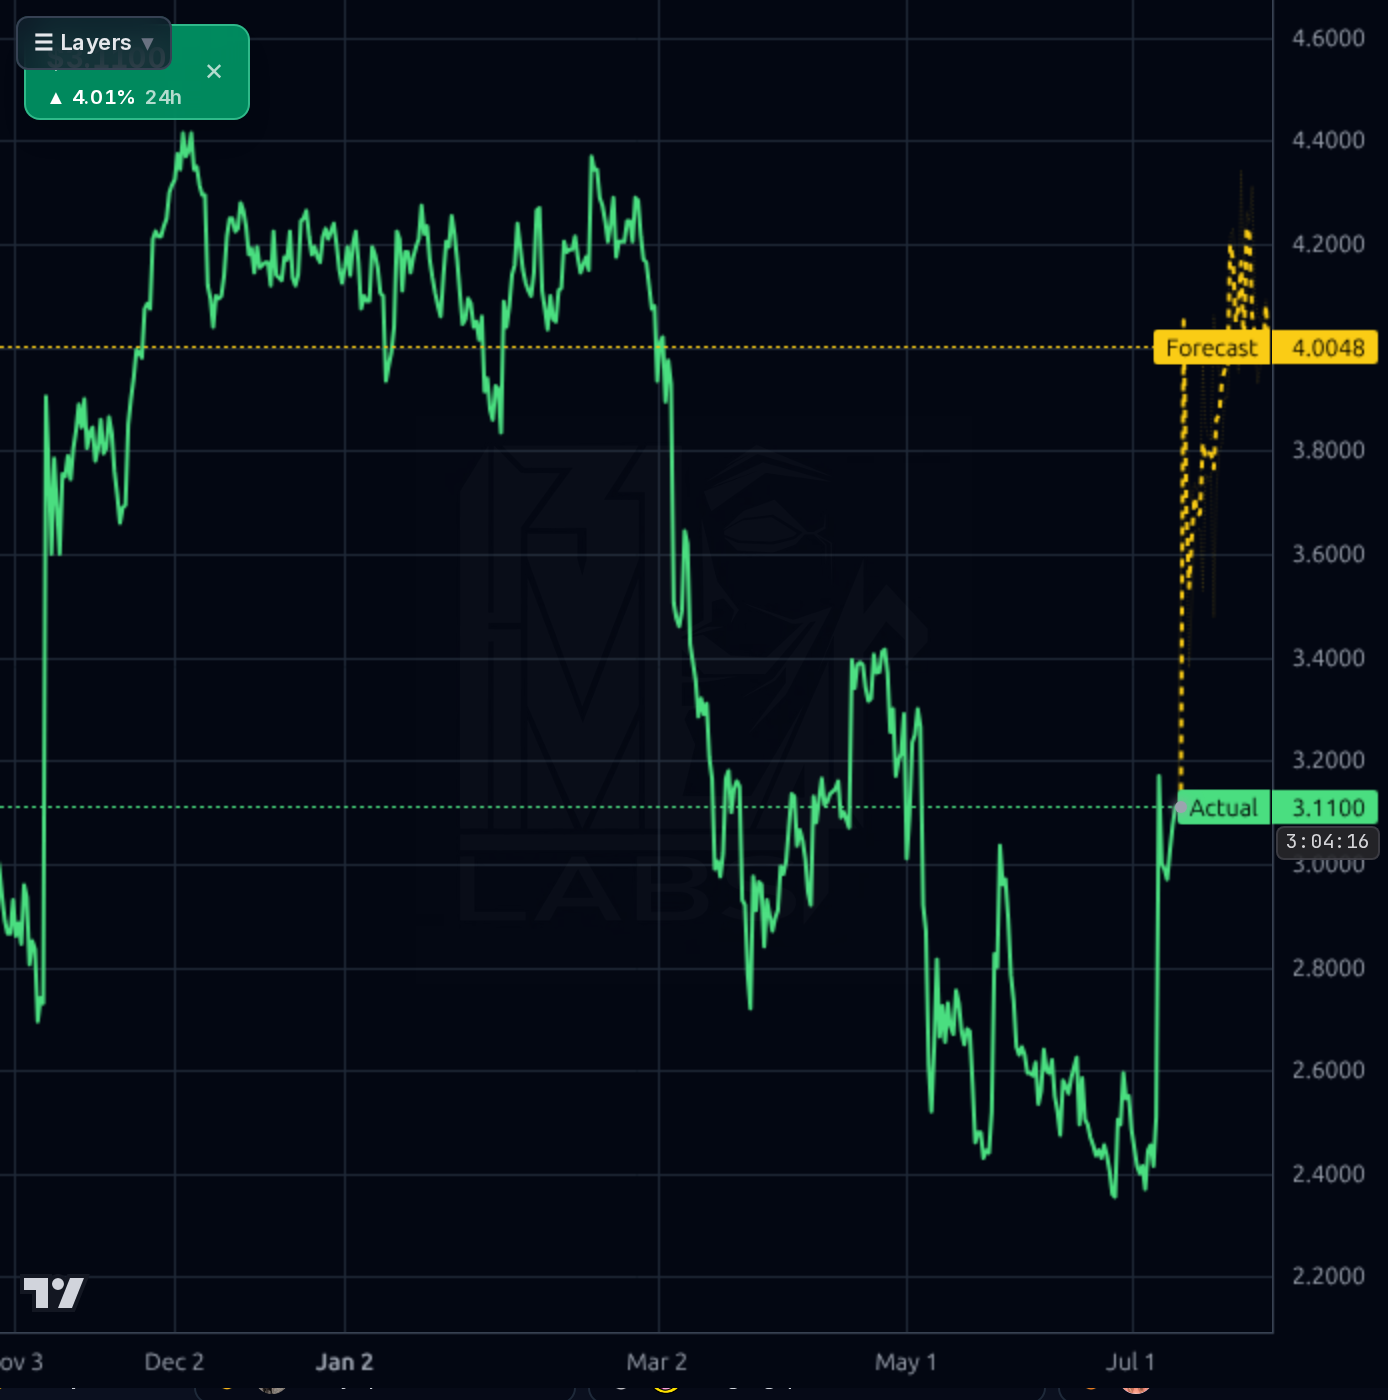
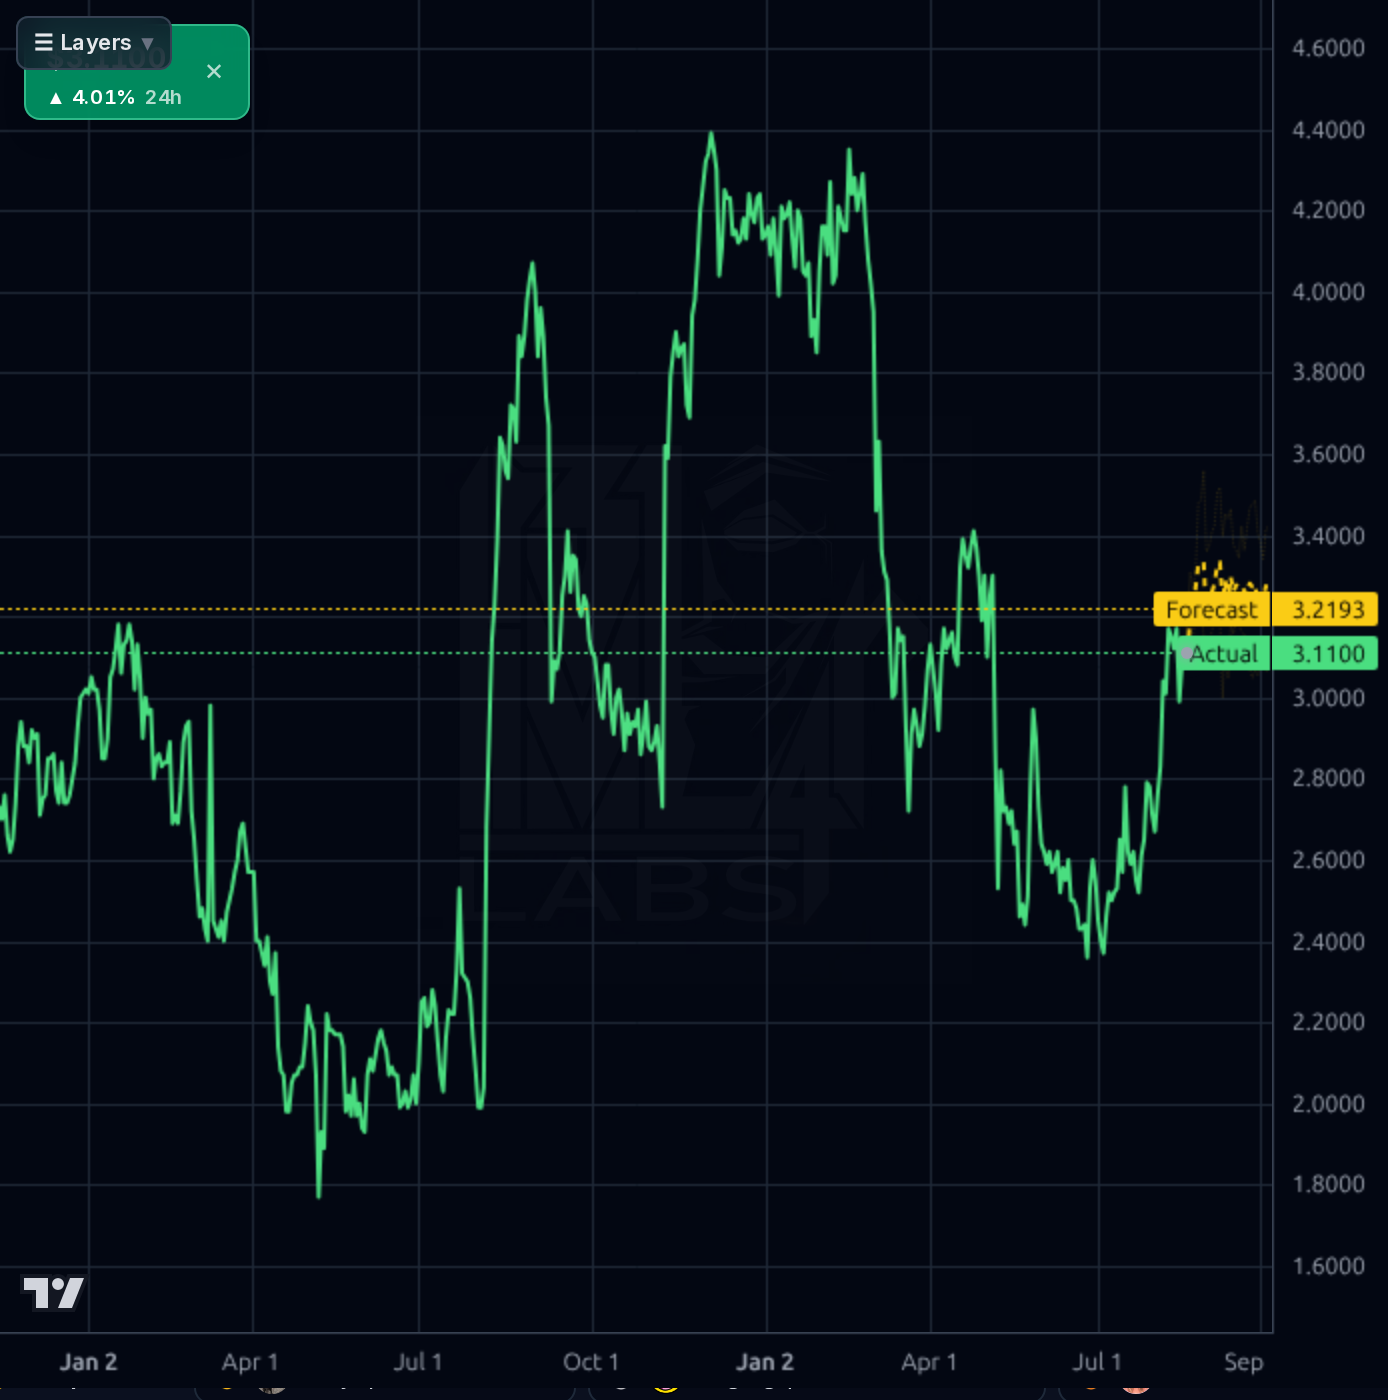
Holley's recent earnings recovery and strong margin retention provide a foundation for upside potential, but elevated short interest and execution risks temper enthusiasm. The forecast band from Kronos AI suggests continued upward momentum, though valuation metrics remain attractive at forward P/E of 8.05x. Key catalysts include Q3 revenue growth exceeding expectations and confirmation of channel recovery.
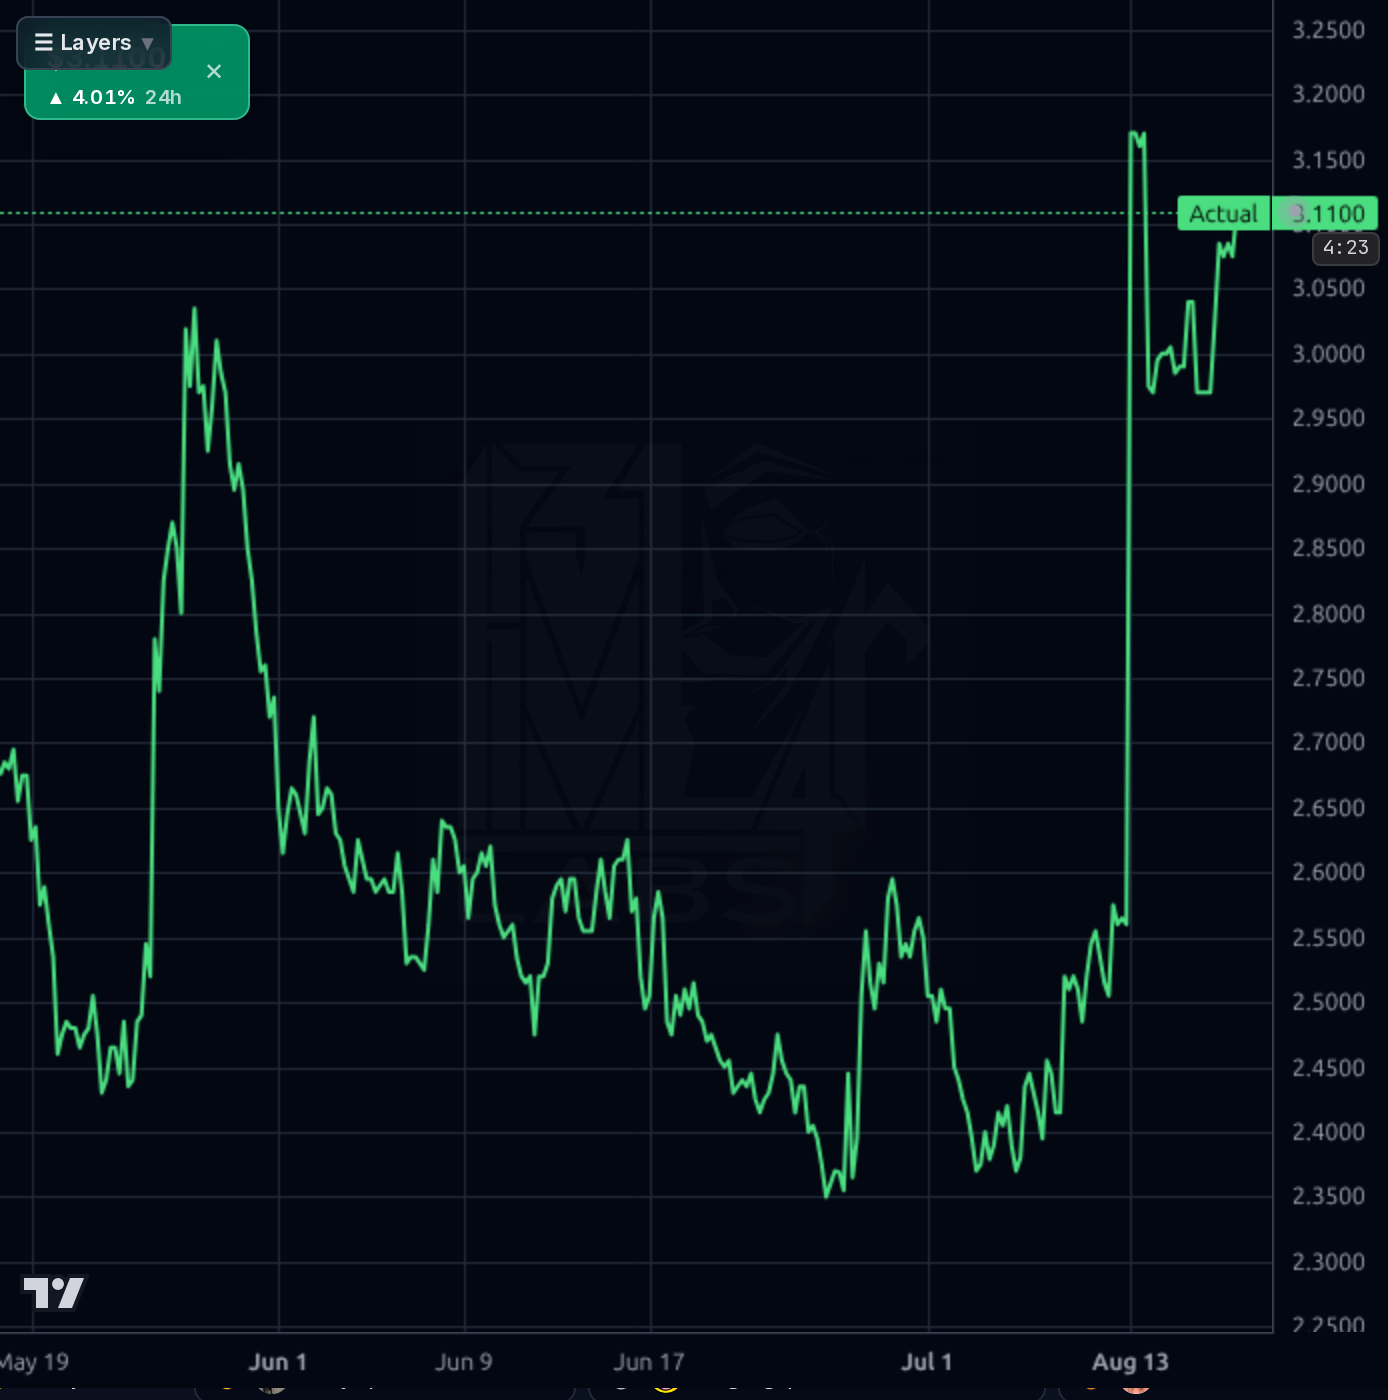
Hold above $3.00; invalidation below $2.80. Monitor for confirmation of Q3 revenue growth exceeding 3.2% YoY and break above SMA20 ($3.11).
Accumulate if price holds above $3.11 with positive earnings momentum. Target $4.58 (current analyst target) by late 2026, driven by channel recovery and buyback activity.
Terminal thesis: Holley's strong gross margins and low debt position it for sustainable growth in the automotive aftermarket. Structural risk is cyclical demand shifts; however, the company's focus on retail placements and product launches provides a buffer against secular risks.
Revenue grew 3.2% YoY in Q2, with three divisions posting double-digit growth, but net income was negative (-$0.02) due to margin headwinds. Gross margins held at 41%, indicating pricing power or cost control, while operating margins improved to 18.5%. Balance sheet shows strong liquidity (current ratio 3.06x), low debt-to-equity (1.27), and healthy cash flow ($24.8M FCF). Capital allocation includes $25M buyback authorization, signaling management confidence. However, negative net income in Q2 and weak EPS growth (-122% YoY) remain concerns.
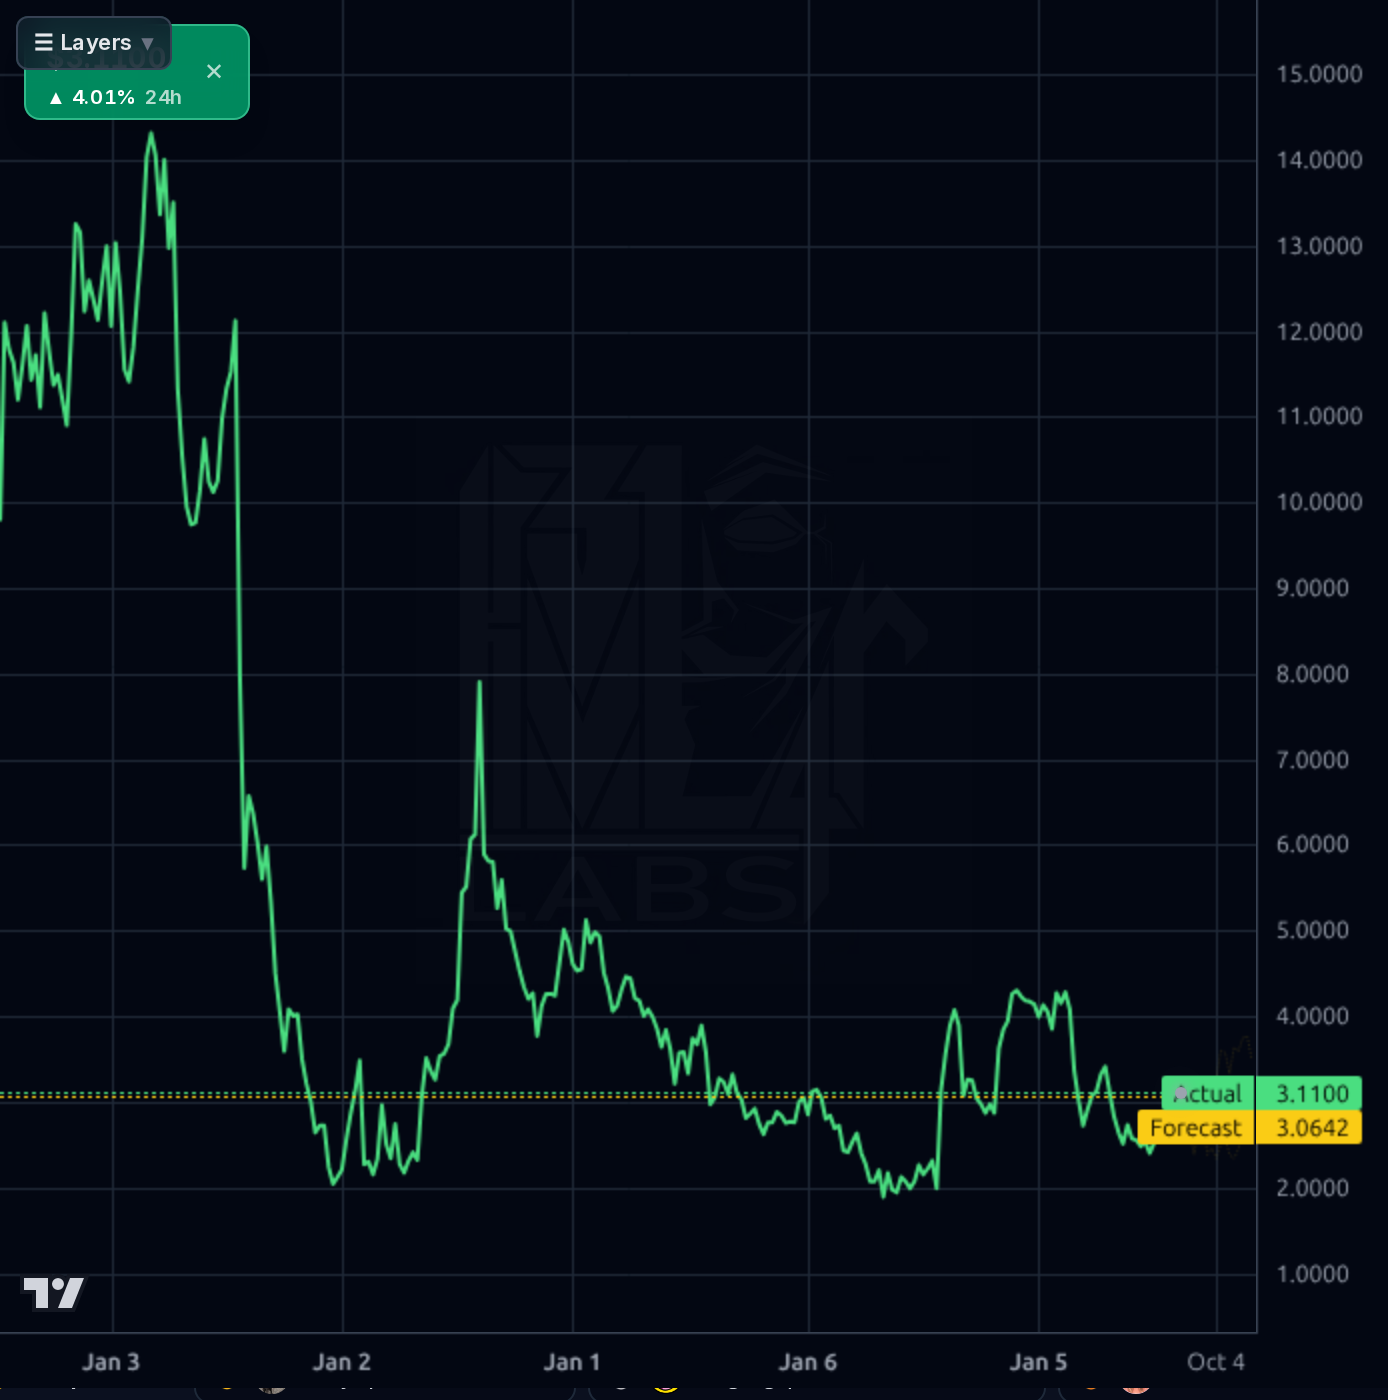
The chart shows a strong uptrend with price breaking above key moving averages (SMA20 at 9.43%, SMA50 at 17.20%). The forecast band from Kronos AI suggests continued upward momentum, with the actual price trading above the forecast line ($3.11 vs $3.06). Support levels near $2.50 are critical; breaking above $3.11 could validate bullish momentum. RSI at 62.32 indicates moderate overbought conditions but not extreme, aligning with recent positive news flow.
Recent earnings call highlights strong growth in three divisions and reduced leverage to a four-year low, while the market is pricing in improved channel dynamics post-winter. However, negative net income in Q2 and elevated short interest (4.24%) create near-term volatility. The $12.75M settlement related to investor claims adds noise but does not materially impact fundamentals.
- Three divisions posted double-digit core sales gains in Q2 (per earnings call)
- $12.75M settlement related to investor claims (non-material impact)
- Elevated short interest (4.24%) could trigger sharp downside if sentiment shifts
- Negative net income in Q2 despite revenue growth indicates margin pressure
- Execution risk remains high with recent earnings miss and weak EPS growth (-122% YoY)
- Sustained weakness in top-line revenue growth could pressure margins further
Get AI analysis on any stock
This is one of hundreds of Kronos AI reports — scored fundamentals & technicals, bull/base/bear price targets, a multi-horizon plan, and continuously-updated forecasts across the market. Create a free account to explore them all.
Create your free account →Already a member? Sign in · Join our Discord