HLMN — AI Stock Forecast & Price Targets
Published 8/14/2026 · A free sample of K3vl4r’s AI-powered analysis.
Kronos price forecasts, scored fundamentals & technicals, and a multi-horizon plan.
View the live HLMN price forecast →
Hillman Solutions (HLMN) shows strong momentum driven by recent acquisitions and positive earnings, but persistent margin pressure and high leverage create uncertainty. The stock is trading near its 52-week high with aggressive analyst targets, though execution risk on new initiatives remains a key concern.
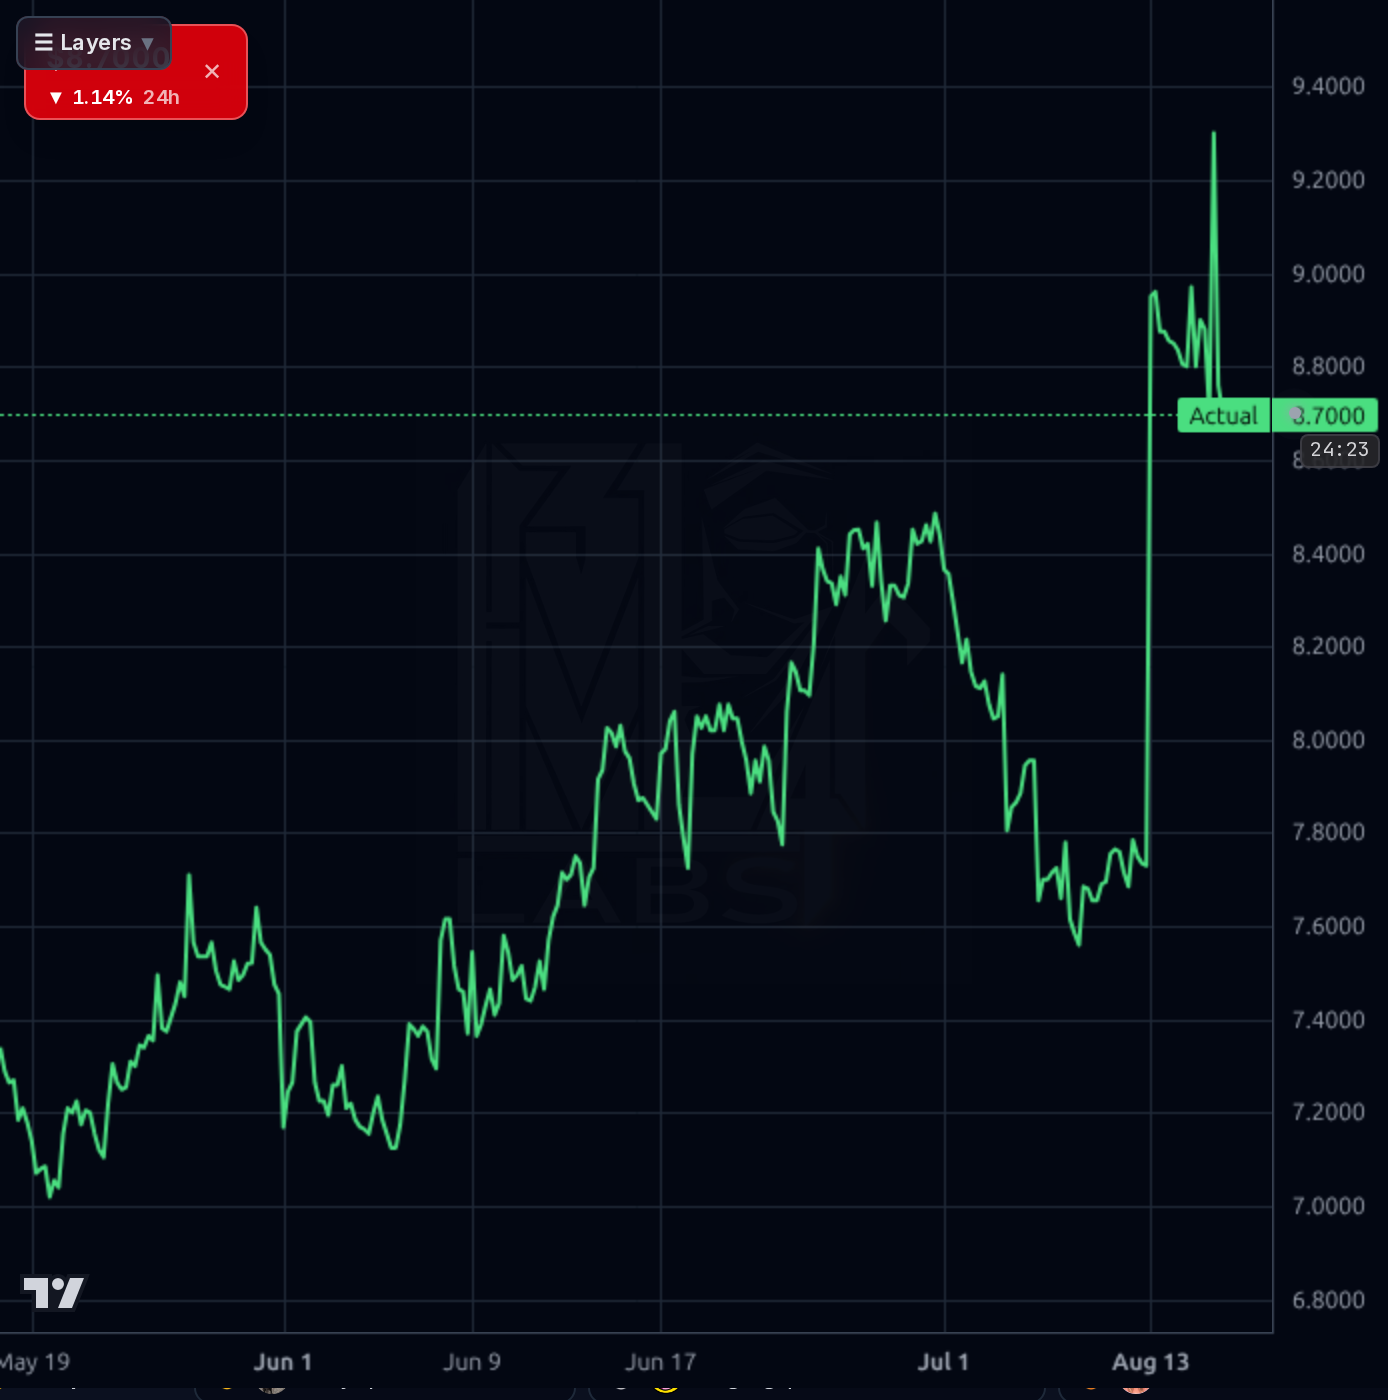
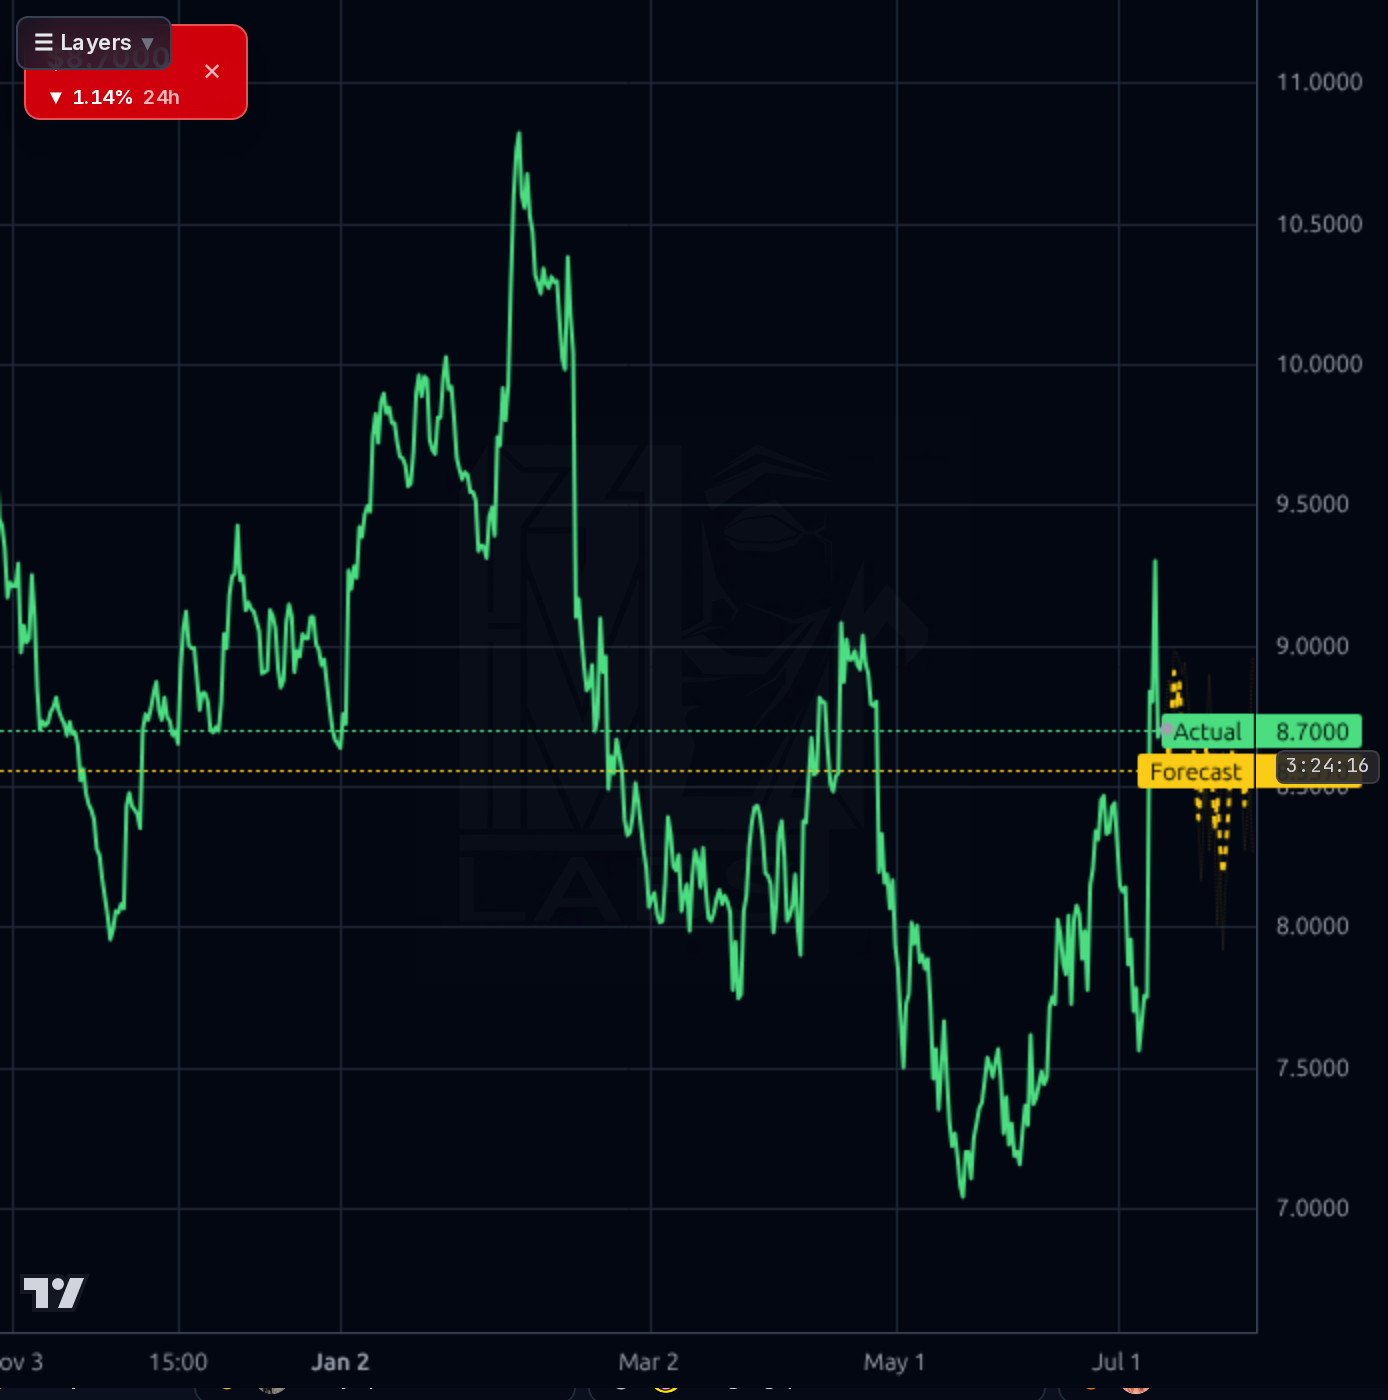
Hold near $8.70 with tight stop-loss at $8.40; invalidation if price drops below $8.20 (current short ratio is low, so volatility may be limited).
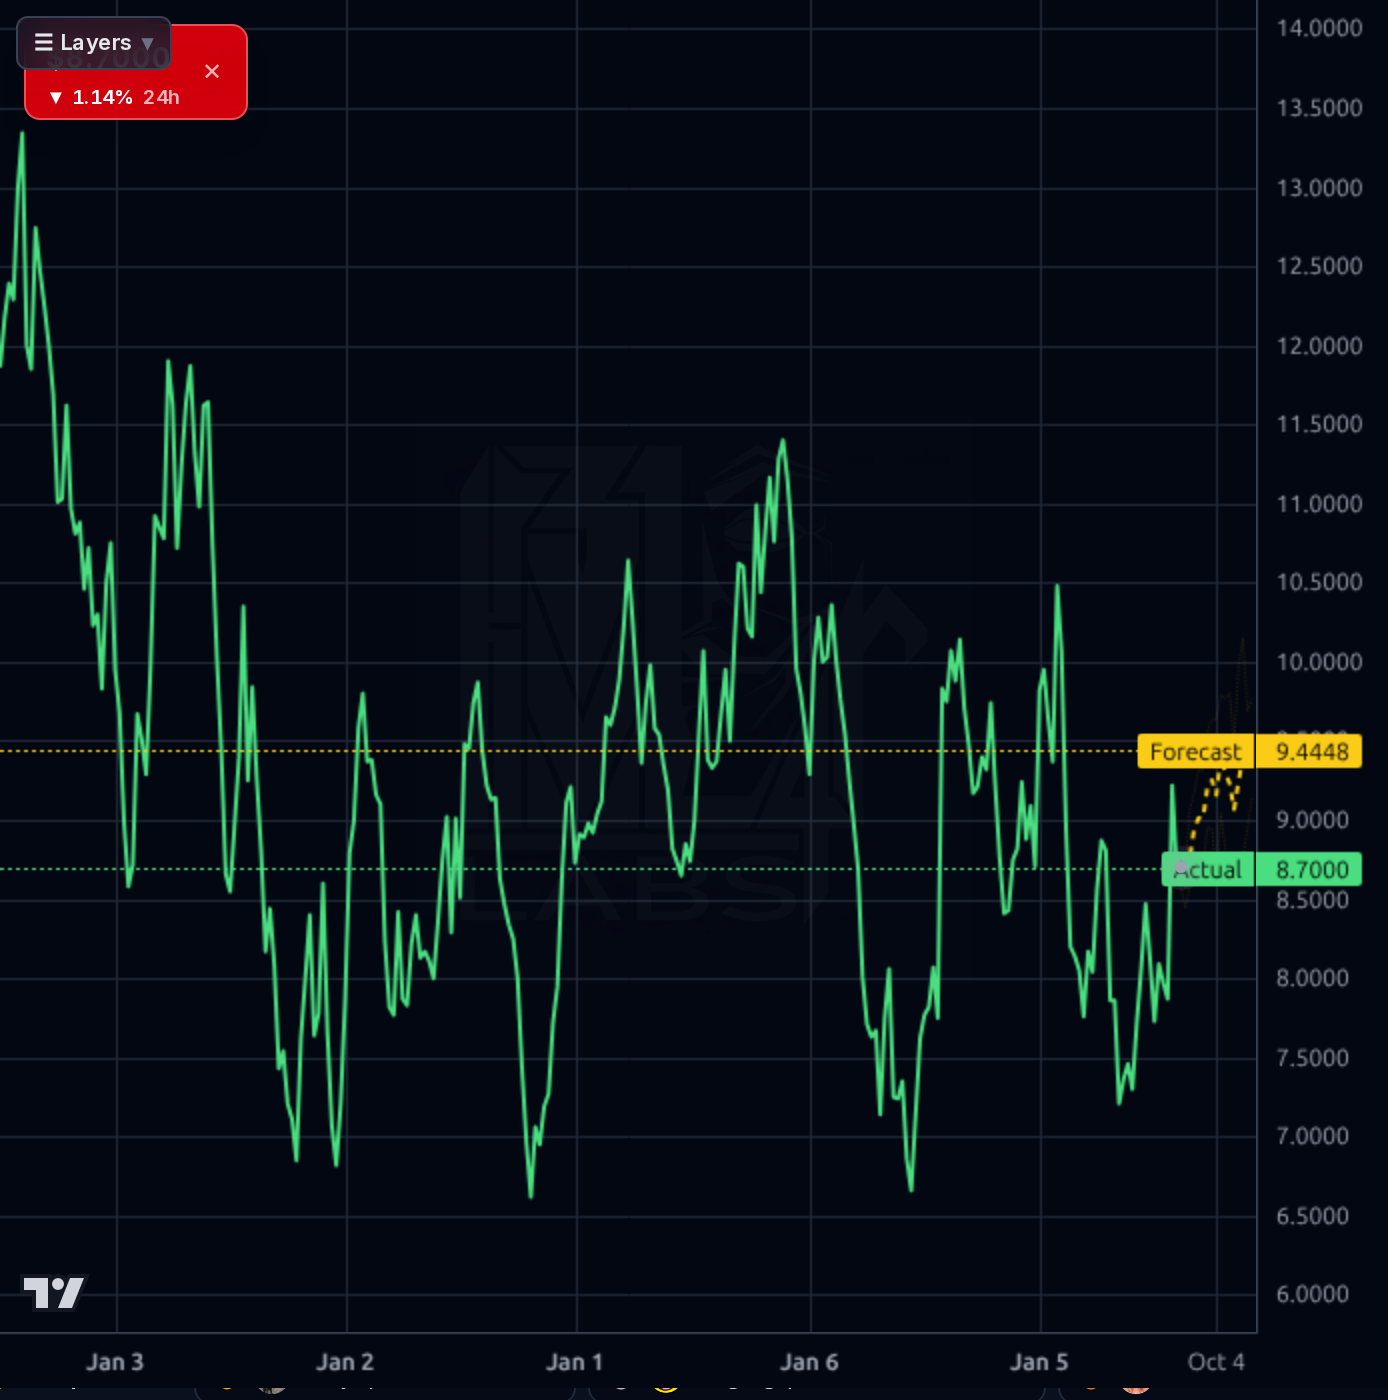
Accumulate as the stock approaches $9.50 — catalysts include successful integration of Kanebridge and margin recovery. Target 15-20% upside over 6 months based on forward P/E and acquisition synergies.
Long-term thesis hinges on operational restructuring (Ohio hub) unlocking efficiency gains; terminal value could reach $12+ if margins stabilize at 8%. Biggest risk is persistent demand weakness or integration challenges delaying profitability.
Revenue growth accelerated to 10% in Q2 (vs. prior year), driven by acquisitions and new contracts, but net margins remain compressed at 2.57%. The balance sheet shows strong liquidity with $361M cash and a current ratio of 2.71, though debt-to-equity is high at 65.38% and interest expense could pressure profitability. Free cash flow improved to $60M in Q2, supporting capital allocation for acquisitions like Kanebridge ($315M deal), but margin recovery remains uncertain as operating margins are only 8.32%. Analysts raise targets (Barclays to $11) reflecting optimism on growth potential, yet the forward P/E of 12.79 suggests value, though valuation metrics may not materialize until operational improvements are proven over multiple quarters.
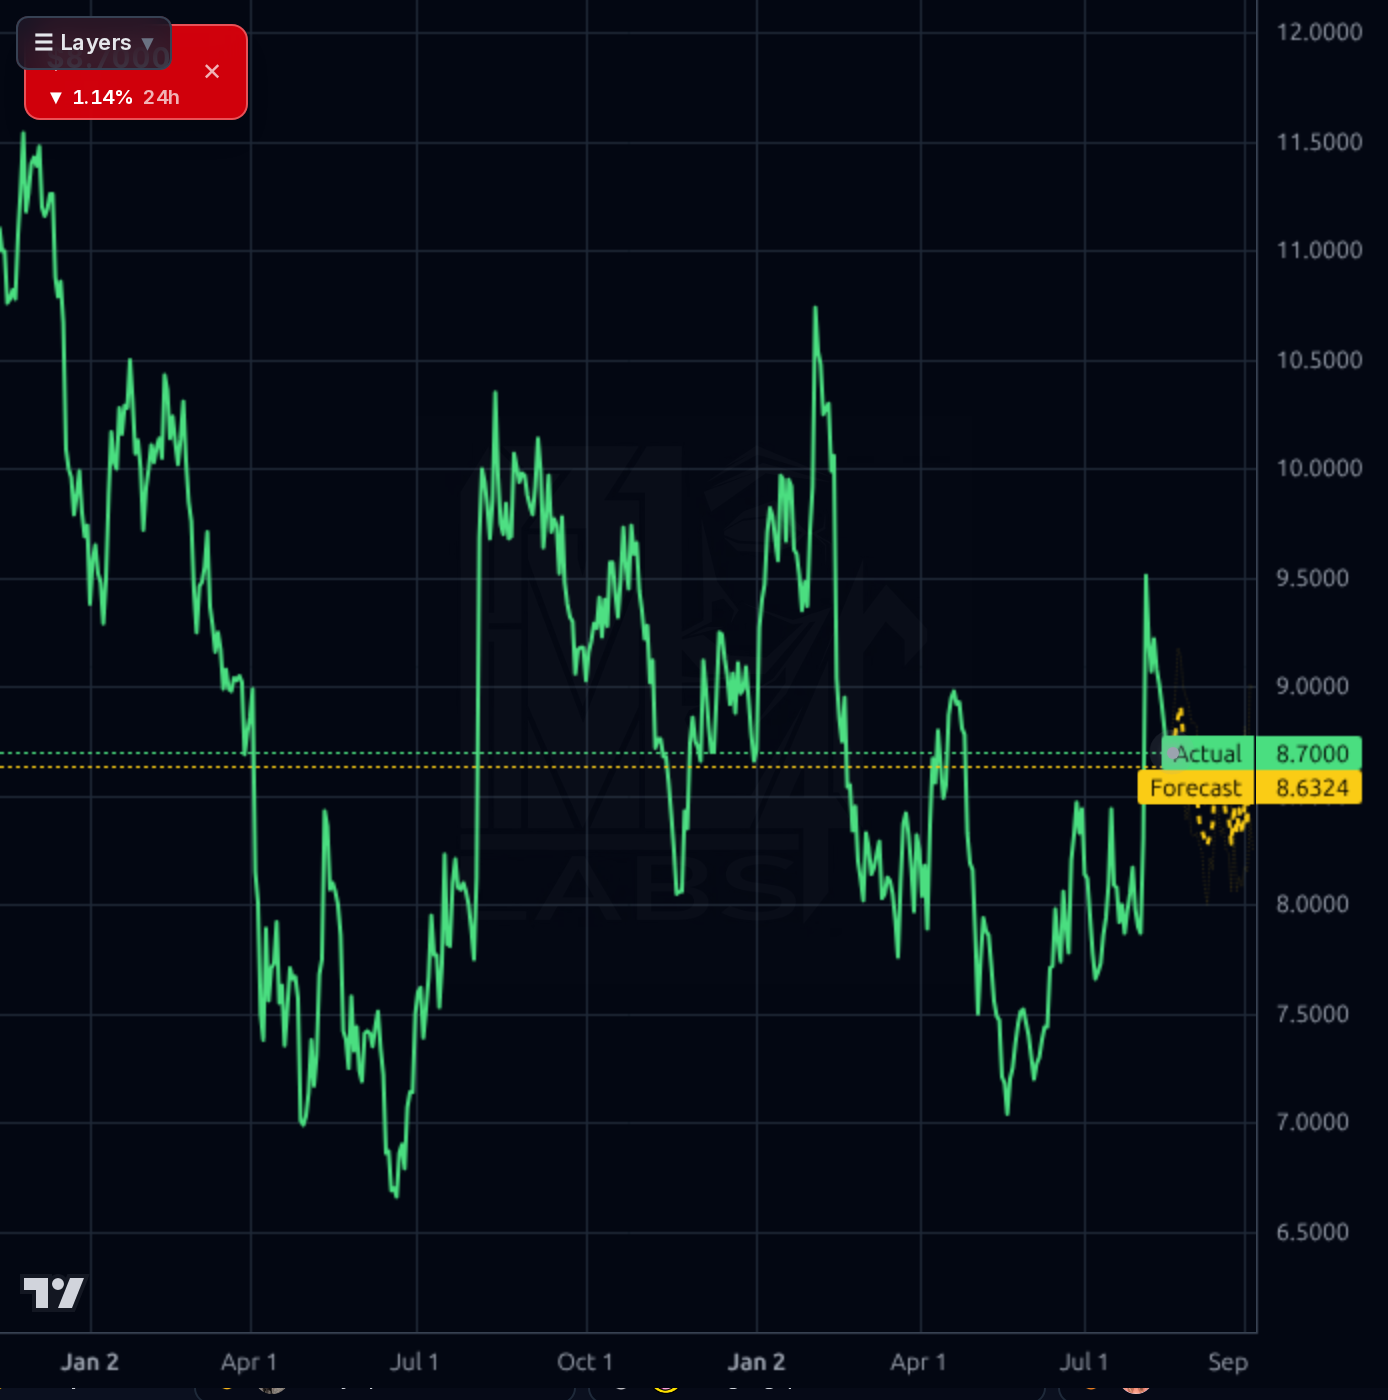
The chart shows a strong uptrend with recent price action near the 52-week high ($10.85), but the current price is at $8.70 — below the forecast band (yellow) which ranges from $8.63 to $9.40. The stock has broken above key resistance levels, including the SMA-50 ($8.70), and shows bullish momentum with a 16.47% quarterly gain. However, the short ratio of 2.81% indicates some bearish positioning, though it's low compared to sector averages. The forecast band suggests continued upside potential, but the model's directional accuracy for 1d is only 59%, indicating near-term volatility.
Recent news highlights Hillman's strong Q2 performance with 10% sales growth and a $315M acquisition of Kanebridge, which could accelerate growth. Barclays raised its price target to $11, reflecting optimism on the company's expansion strategy. However, some analysts note persistent margin pressure due to soft demand, and the stock has faced short-term volatility from macroeconomic headwinds. The 7-day return of 17.15% shows strong momentum, but execution risk on new initiatives remains a key concern.
- $315M acquisition of Kanebridge Corporation to double industrial business
- Ohio hub consolidation expected to improve operational efficiencies and reduce costs
- Persistent margin pressure due to soft underlying demand
- High leverage profile increases vulnerability to rising interest rates
- Execution risk associated with integrating new, large-scale operational initiatives
Get AI analysis on any stock
This is one of hundreds of Kronos AI reports — scored fundamentals & technicals, bull/base/bear price targets, a multi-horizon plan, and continuously-updated forecasts across the market. Create a free account to explore them all.
Create your free account →Already a member? Sign in · Join our Discord