HNRG — AI Stock Forecast & Price Targets
Published 8/14/2026 · A free sample of K3vl4r’s AI-powered analysis.
Kronos price forecasts, scored fundamentals & technicals, and a multi-horizon plan.
View the live HNRG price forecast →
Hallador Energy's recent Q2 results show operational challenges with a net loss and revenue miss, but strategic progress on gas projects and capacity agreements offers potential upside. The stock trades at high valuation (forward P/E 15.54) amid cyclical risks, while technicals suggest near-term volatility with support at $13.65 and resistance at $18.00. Current momentum is mixed with strong insider buying but weak earnings momentum.
Hold below $18.00; if price breaks above $18.00 with volume, consider a small position at 5-7% of portfolio. Invalidation: close position if price falls below $13.65 (52-week low) or fails to hold $18.00 resistance for 3 days.
Wait for earnings guidance confirmation in Q4; target $27.75 requires sustained operational improvement and margin expansion. Catalysts include Turtle Creek project completion and capacity agreement execution. Change of mind: if net income turns positive within 6 months or forward P/E drops below 10x.
Long-term viability depends on successful transition to natural gas generation (Turtle Creek project) and regulatory shifts favoring coal. Structural risk remains high due to environmental policies targeting coal, but the company's strong cash flow ($20.49M Q2) provides operational resilience if it can de-risk its balance sheet.
Revenue declined (Q2 revenue $101.5M vs prior period data) with a net loss of $(0.32)/share (-268.42% YoY) due to maintenance outages at Merom plant. Gross margins improved slightly (7.63%) but operating margins remain negative (-0.20%). Balance sheet shows high debt-to-equity (25.07x), and low cash ($0.74/sh). The $16.16 price trades at a trailing P/E of 780.68 and forward P/E of 15.54, indicating valuation disconnect given negative EPS growth (-81.18% YTD). Insider buying provides some confidence amid high short interest (8.56%).
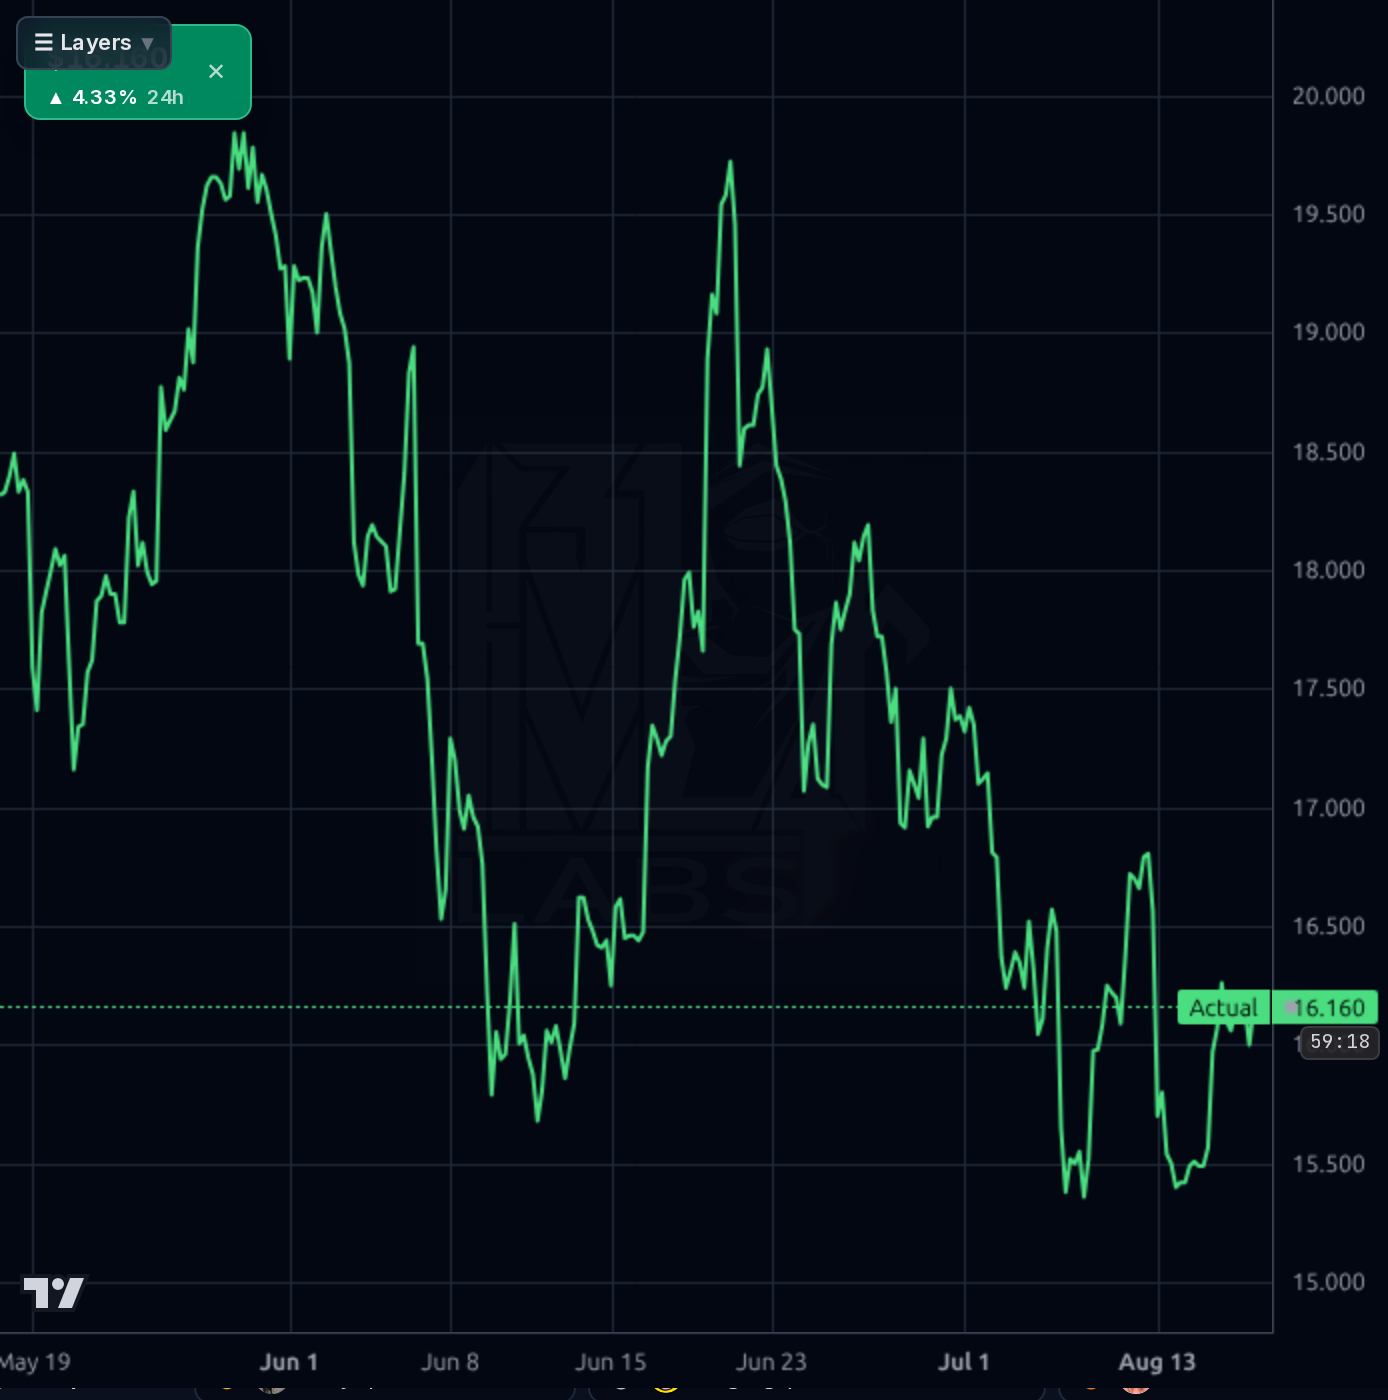
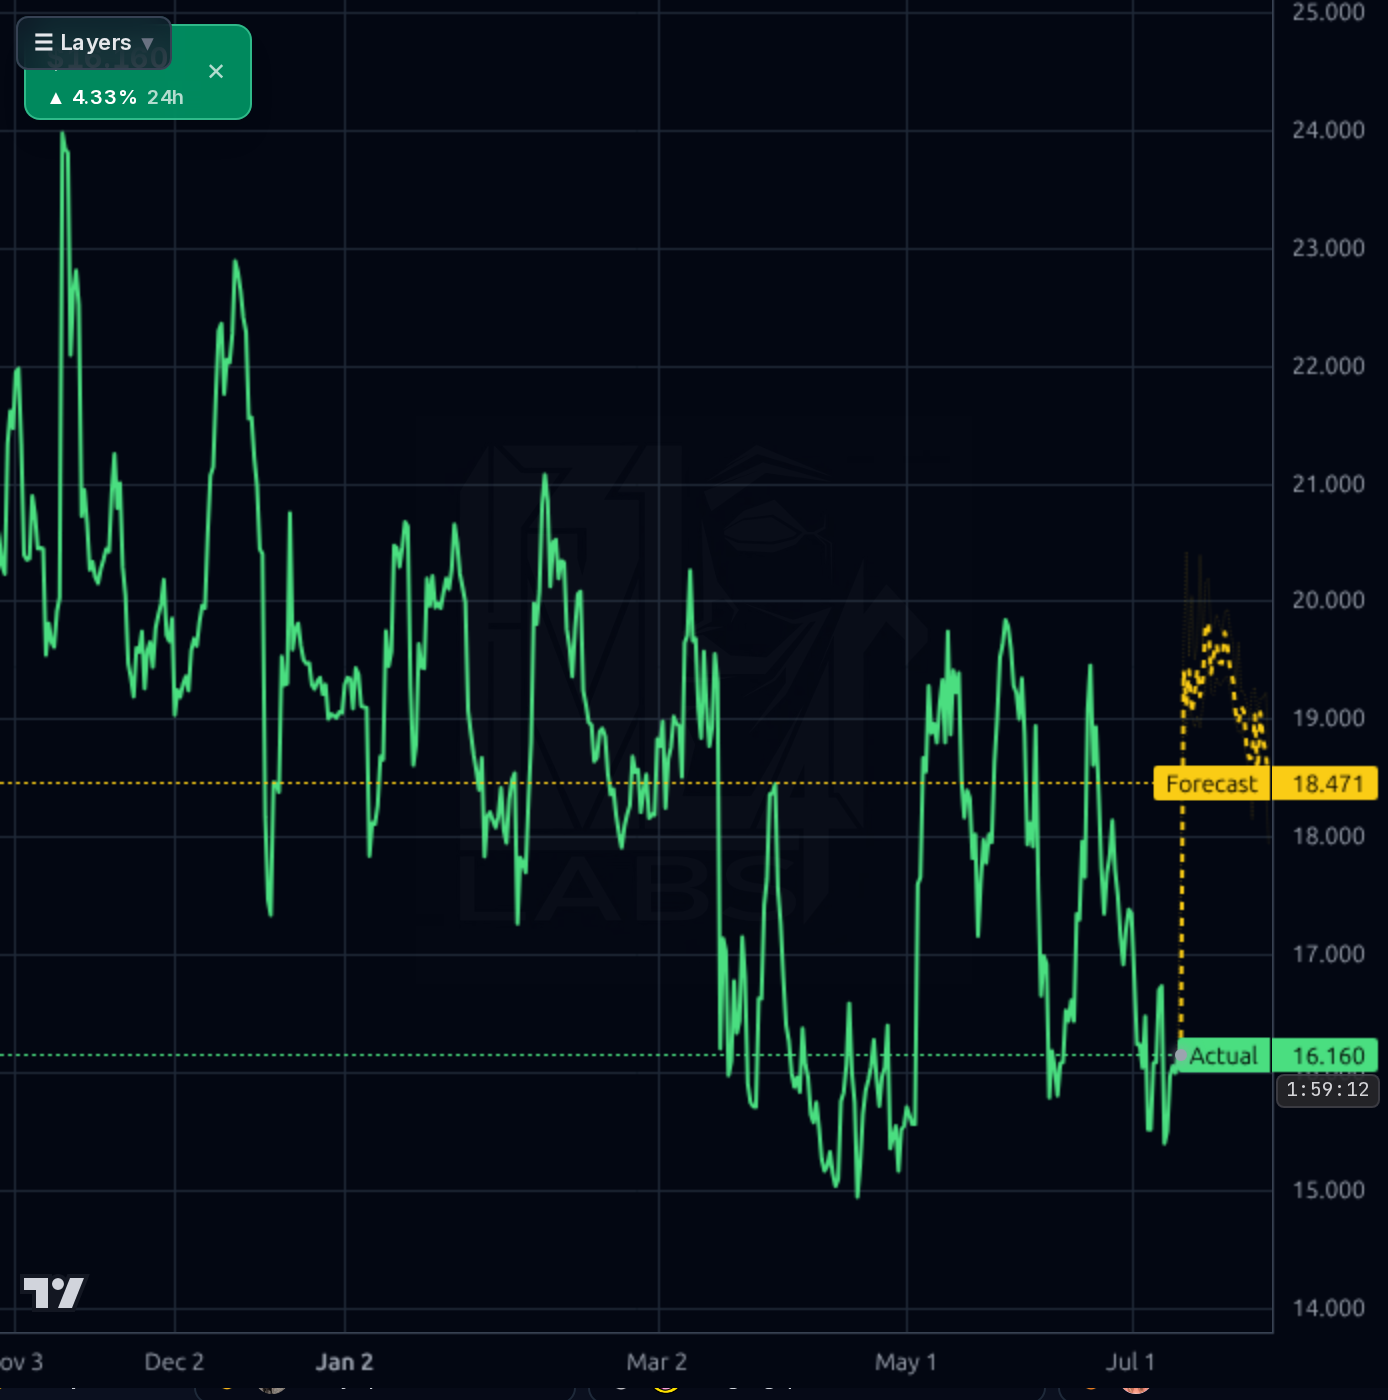
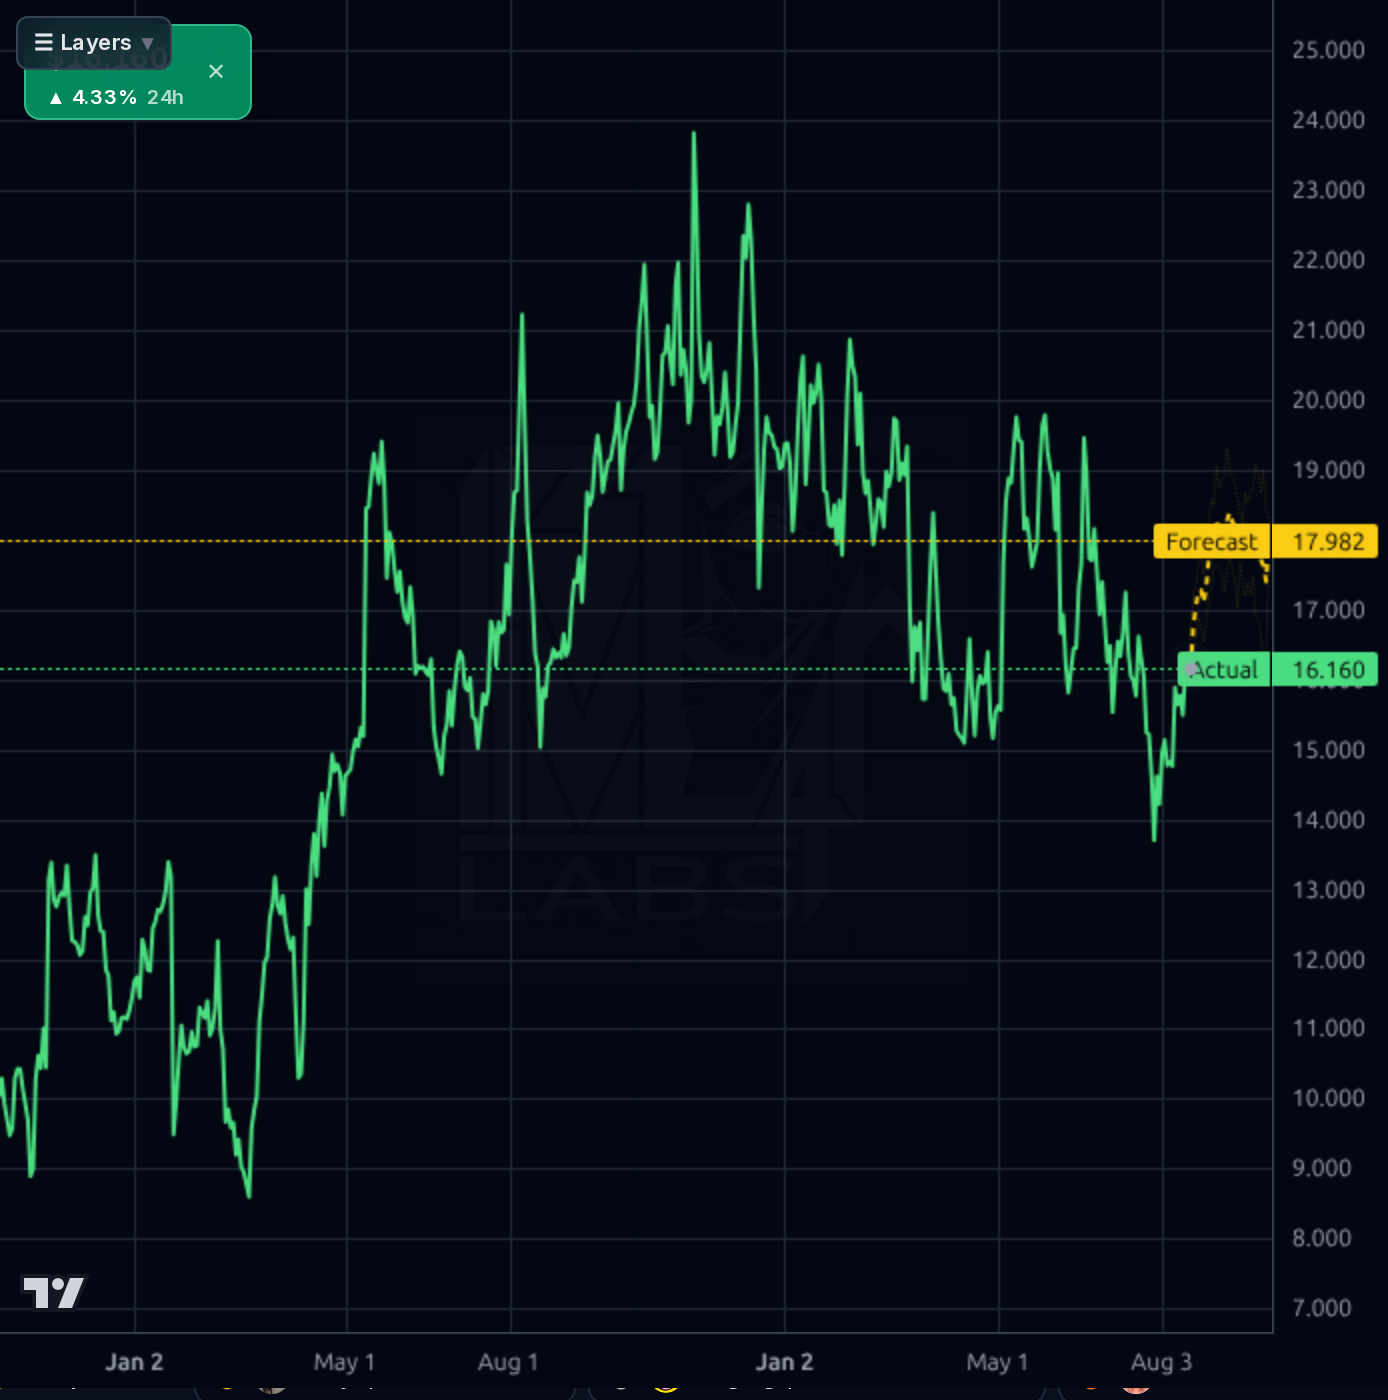
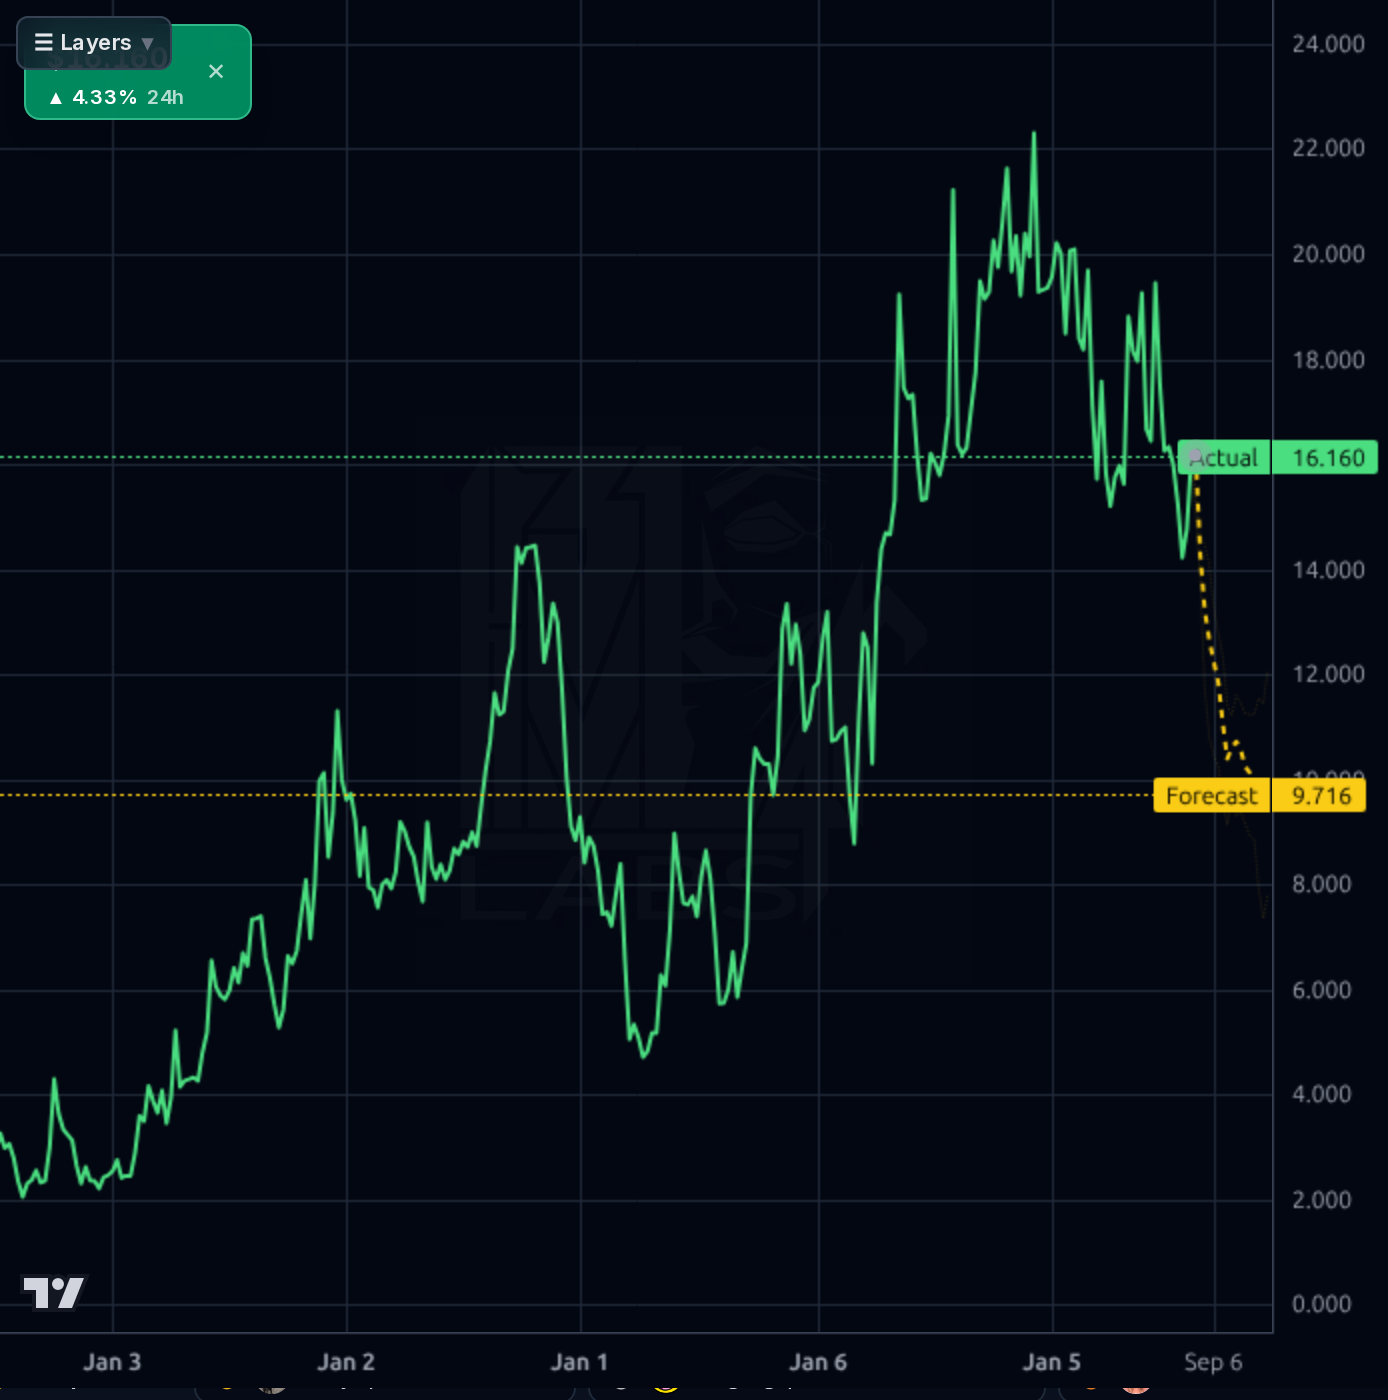
The chart shows volatile price action with a 24h spike of +4.33%, but the trend is bearish below $18.00 resistance. Key support at $13.65 (52-week low) and resistance at $18.00 (forecast band upper limit). The Kronos AI forecast shows actual price trading above its 17.982 forecast, suggesting short-term momentum but with high noise (directional accuracy only 56% vs naive baseline). RSI of 54.20 indicates neutral momentum, while the SMA20 (-5.73%) and SMA50 (-0.78%) show negative trend in medium term. The forecast band's upper limit ($17.98) is being tested but not yet broken.
The Q2 results reveal a net loss of $0.32/share due to maintenance outages, though the company secured capacity agreements and lowered Turtle Creek project costs. The extreme valuation (forward P/E 15.54 vs trailing P/E 780.68) suggests investors are pricing in future growth despite current operational struggles. The $27.75 target price is +7.3% above current price but lacks near-term catalysts given weak earnings momentum (-81.18% YTD). Social sentiment is overwhelmingly bullish (100% on StockTwits), which may reflect short-term noise.
Get AI analysis on any stock
This is one of hundreds of Kronos AI reports — scored fundamentals & technicals, bull/base/bear price targets, a multi-horizon plan, and continuously-updated forecasts across the market. Create a free account to explore them all.
Create your free account →Already a member? Sign in · Join our Discord