HUBB — AI Stock Forecast & Price Targets
Published 7/12/2026 · A free sample of K3vl4r’s AI-powered analysis.
Kronos price forecasts, scored fundamentals & technicals, and a multi-horizon plan.
View the live HUBB price forecast →
HUBB shows strong fundamentals driven by utility infrastructure growth and earnings momentum, but faces valuation pressure at current levels. Technicals indicate consolidation near $490 with forecast bands suggesting upside potential if earnings beat expectations. Short-term volatility from upcoming earnings creates uncertainty.
Wait for confirmation of the $500 breakout above resistance; if achieved, target $536.34 (bullish) with a stop-loss at $485. Invalidation is below $478 (52-week low).
Hold through earnings and monitor utility segment growth rates. Target $562.67 based on analyst price targets if the stock breaks above $500. Catalysts include sustained earnings beats and grid infrastructure expansion.
Long-term thesis hinges on continued utility infrastructure demand driven by AI/data center growth. Structural risk is valuation pressure at current levels; terminal value depends on maintaining 15%+ revenue growth in Utility Solutions segment.
Revenue growth is robust in the Utility Solutions segment (15% YoY), supported by grid infrastructure expansion. Margins are improving due to utility performance, with operating margins at 21.13%. Balance sheet strength is moderate with a current ratio of 1.58 and debt-to-equity at 72.47%, though high leverage requires monitoring. Free cash flow conversion rate is strong (46.0% in Q1 2026), but the forward P/E of 22.29 suggests potential overextension relative to historical averages. Capital allocation appears prudent with consistent dividend growth and strategic investments.
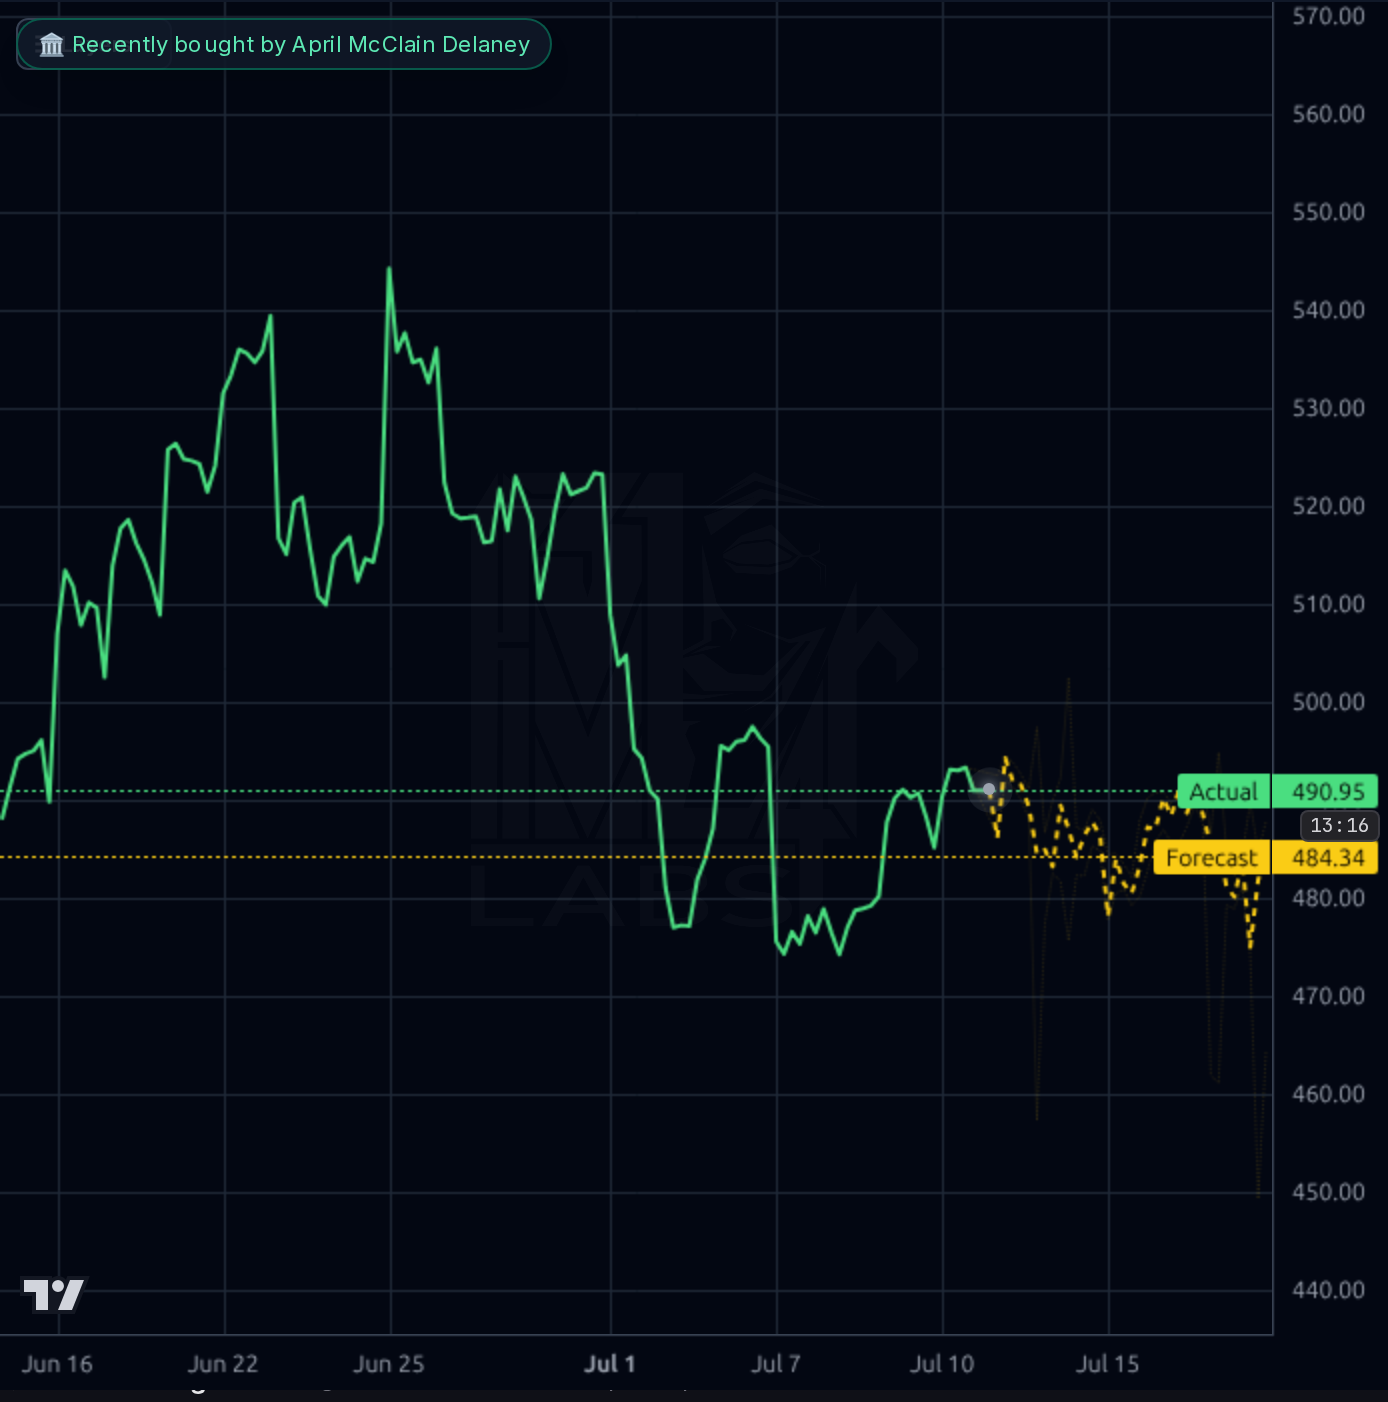
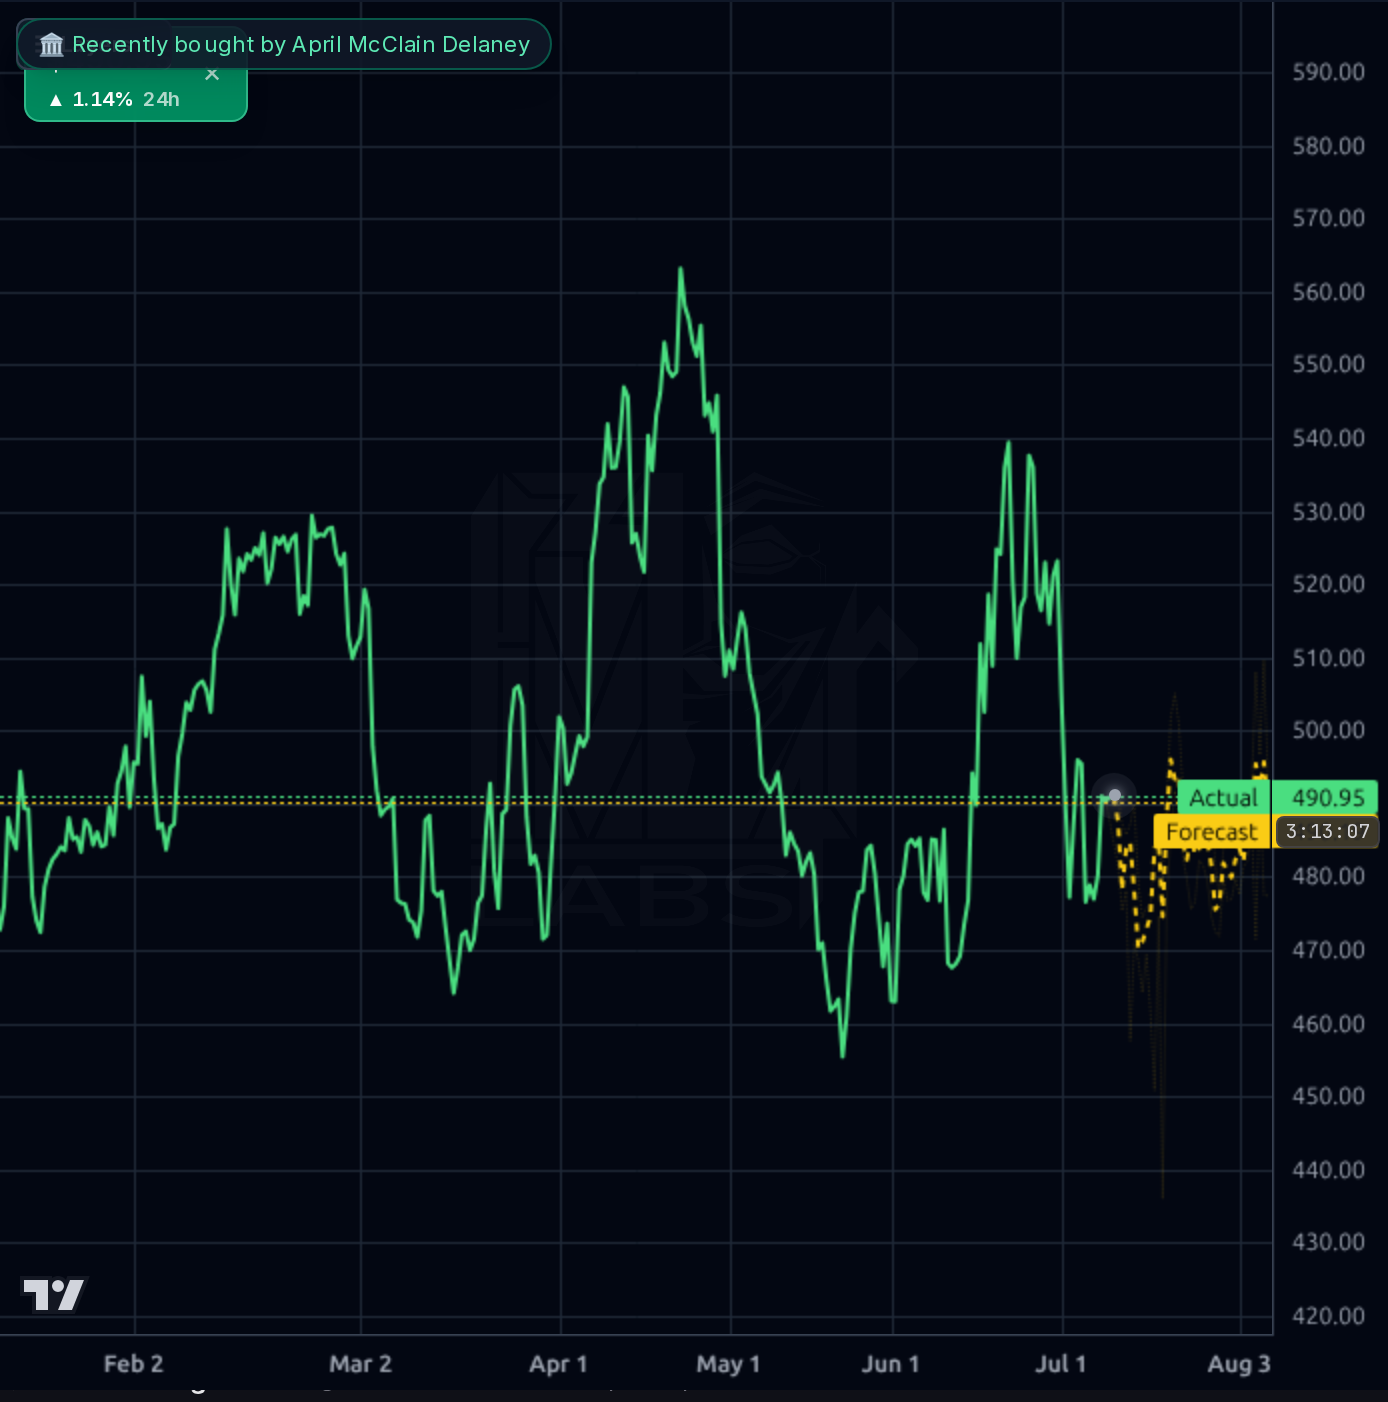
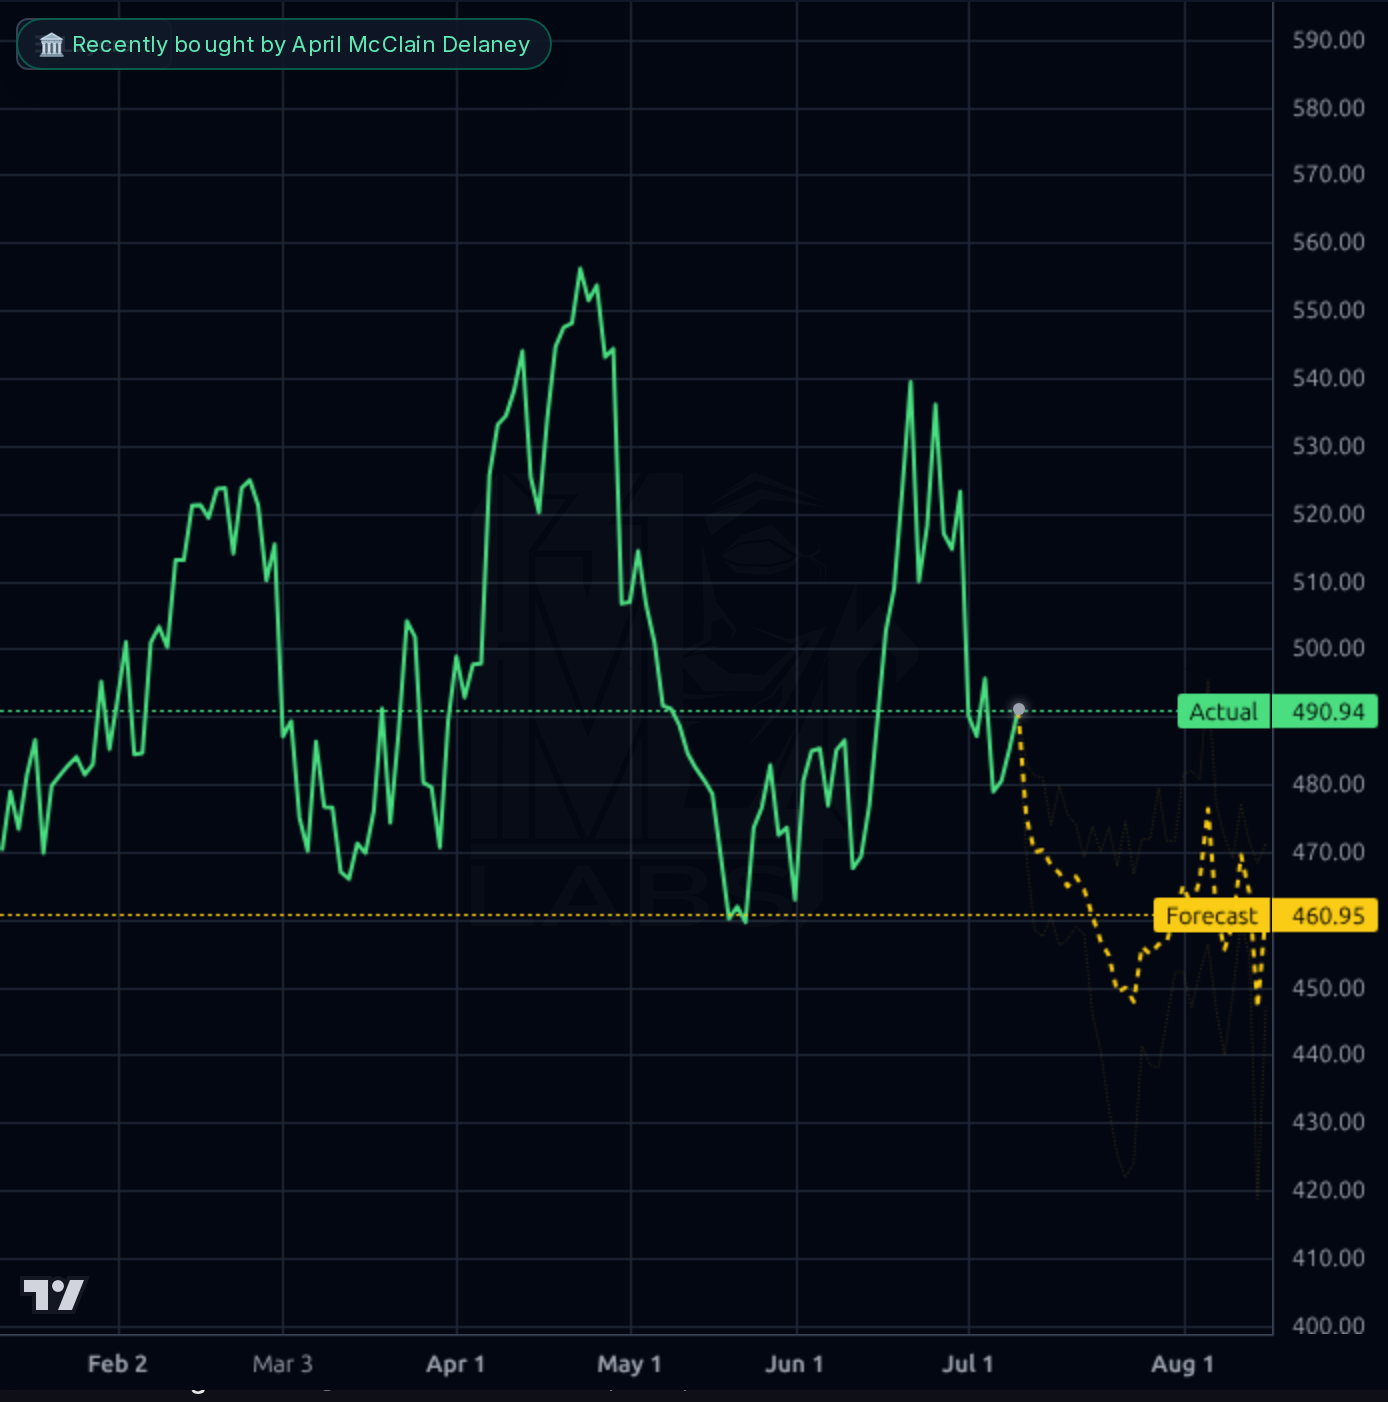
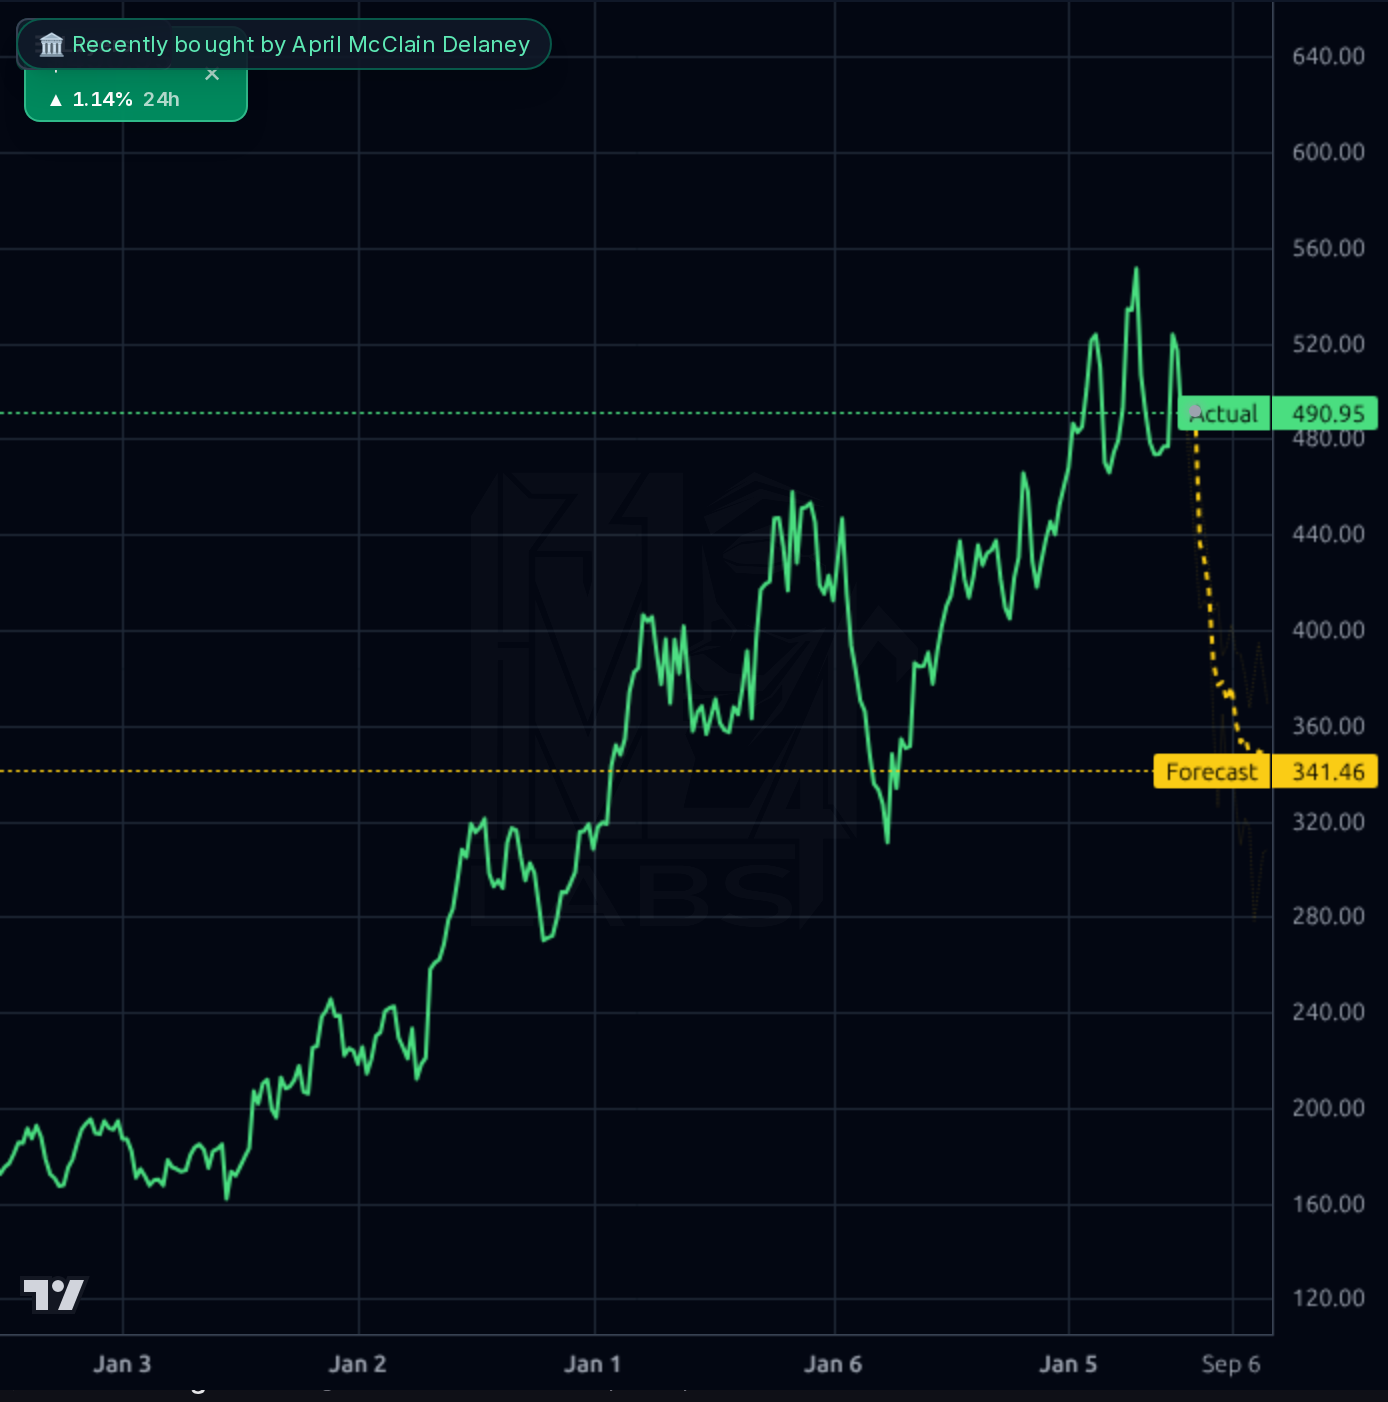
The chart shows consolidation near $490 with recent price action trading within a narrow band between $478 (52-week low) and $565 (52-week high). The Kronos AI forecast bands indicate potential upside to $562.67, but the current price is below the 50-day SMA ($491.30), suggesting short-term weakness. Support levels are at $485 (previous close) and $478 (52-week low), while resistance is near $500 (psychological level). The RSI of 47.95 indicates neutral momentum, with no clear breakout signal yet.
Recent news highlights Hubbell's potential for explosive upside due to strong earnings history and a Zacks upgrade to Buy. However, the stock has been 'treading water' at $478.05 for six months, missing S&P 500 gains. The upcoming earnings report (July 28) is critical as it could validate growth momentum or trigger volatility. Broader market context shows NZ services sector growth and global macro trends, but these are less directly relevant to HUBB's near-term performance.
- Utility Solutions segment driving 15% YoY revenue growth due to grid infrastructure expansion
- Zacks upgrade to Buy reflecting growing optimism about earnings prospects
- Valuation risk: Forward P/E of 22.29 suggests potential overextension relative to historical averages
- Earnings volatility: Short-term sensitivity to near-term earnings beats/misses could trigger disproportionate sell-offs
Get AI analysis on any stock
This is one of hundreds of Kronos AI reports — scored fundamentals & technicals, bull/base/bear price targets, a multi-horizon plan, and continuously-updated forecasts across the market. Create a free account to explore them all.
Create your free account →Already a member? Sign in · Join our Discord