HURN — AI Stock Forecast & Price Targets
Published 7/14/2026 · A free sample of K3vl4r’s AI-powered analysis.
Kronos price forecasts, scored fundamentals & technicals, and a multi-horizon plan.
View the live HURN price forecast →
Huron has rallied +11% since the last call to $111.23, reclaiming the key $108-110 resistance and validating the mean-reversion thesis into the base case. Operational fundamentals remain strong (11.8% revenue growth, 23% ROE, 1.00 analyst recom, forward P/E 10.9x), but the unresolved Q1 debt surge to $887M and -$174M FCF cap the near-term re-rating; the stock is now at the upper end of its trading band with elevated execution risk into the May earnings print.
Stock is at the upper end of the $95-$115 range with RSI 59 and a +11% weekly move — trim/harvest posture into $113-$115 resistance is prudent for tactical holders. Do not chase here. Reload zone is $102-$105 on pullback; hard invalidation on a daily close below $100. Position sizing: 1/3 to 1/2 of full target size given the range is not yet broken.
1-6 month view remains ACCUMULATE. The May 5 earnings print is the pivotal catalyst: if management articulates the source of the $339M debt jump (M&A? working capital?), shows gross margin recovery above 30%, and FCF normalization, the stock re-rates toward $130+. If those don't materialize, expect a retest of $95-$100. Expected return range: -10% to +20% from $111. Change-my-mind: a decisive break above $115 on volume with commentary that deleverages the balance sheet flips this to BUY.
1-3 year thesis is that Huron's Healthcare/Education digital-transformation franchise (RelateCare managed services, Huron Research suite, AI/automation in EHR/ERP) supports mid-teens EPS growth from a compressed base, with $86M contracted 2026 revenue and $75M 2027 backlog providing visibility. At forward P/E of 10.9x vs a 5-year performance of +137%, the terminal multiple should re-expand toward 14-16x if leverage normalizes. Biggest structural risk is that the debt surge signals a strategic pivot (major M&A) that dilutes returns, or that Healthcare IT capex slows in a downturn.
Top-line momentum is intact: Q1'26 revenue of $451.8M is the fourth consecutive quarter of sequential growth, TTM sales of $1.71B, with sales Y/Y TTM at 11.79% and Q/Q at 11.78%. However, margins visibly compressed in Q1'26 — gross margin fell to 30.0% from 33.0% in Q4'25, operating margin dropped to 8.2% from 12.2%, and net margin to 5.1% from 6.9%. The bigger issue is the balance sheet: total debt jumped to $887M from $548M in a single quarter (a $339M increase), stockholders' equity fell to $397M from $529M, and D/E now sits at 2.23x. Operating cash flow flipped from +$126M in Q4 to -$162M in Q1, driving FCF to -$174M with only $26M cash on hand. Working capital did improve to $283M, and profitability metrics remain enviable (ROE 23.3%, ROIC 8.3%, forward EPS of $10.22 vs TTM $5.85 implying meaningful margin normalization). Capital allocation looks aggressive — the debt build with no disclosed remediation plan and a director insider sale into weakness are yellow flags that need clarity at the May 5 print.
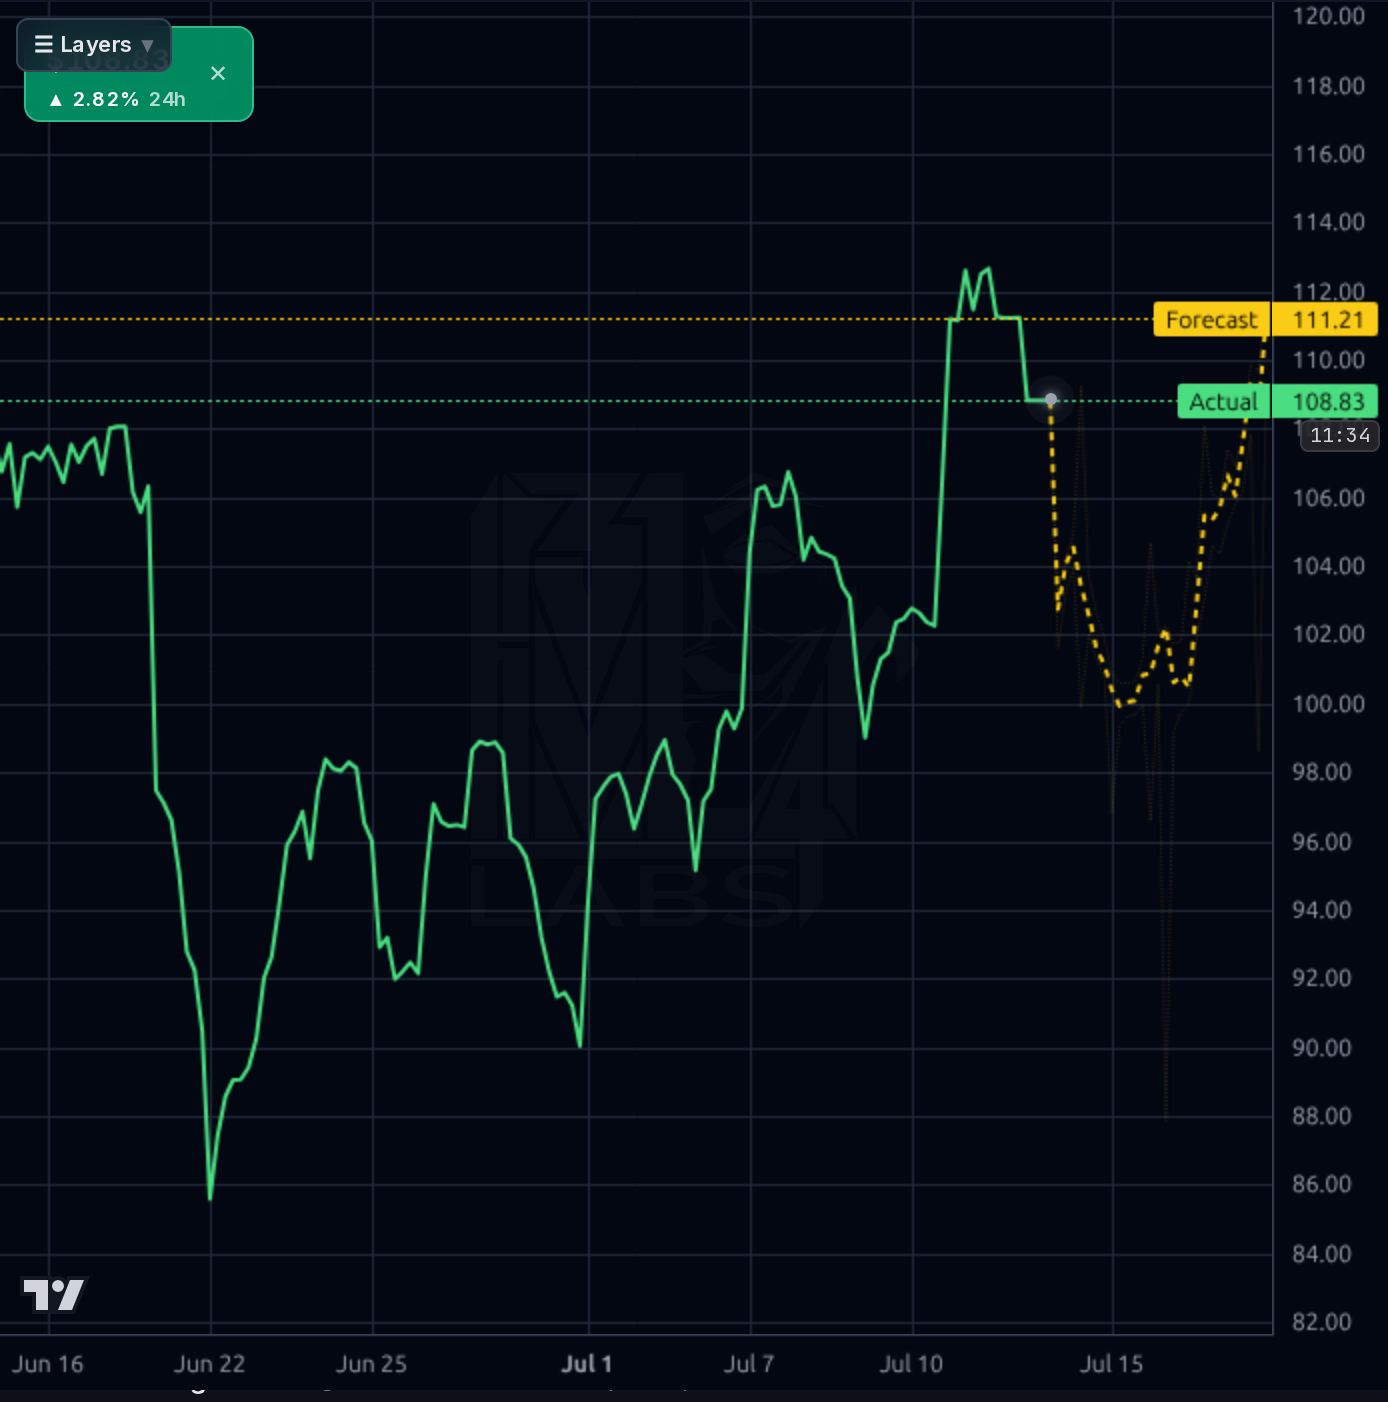
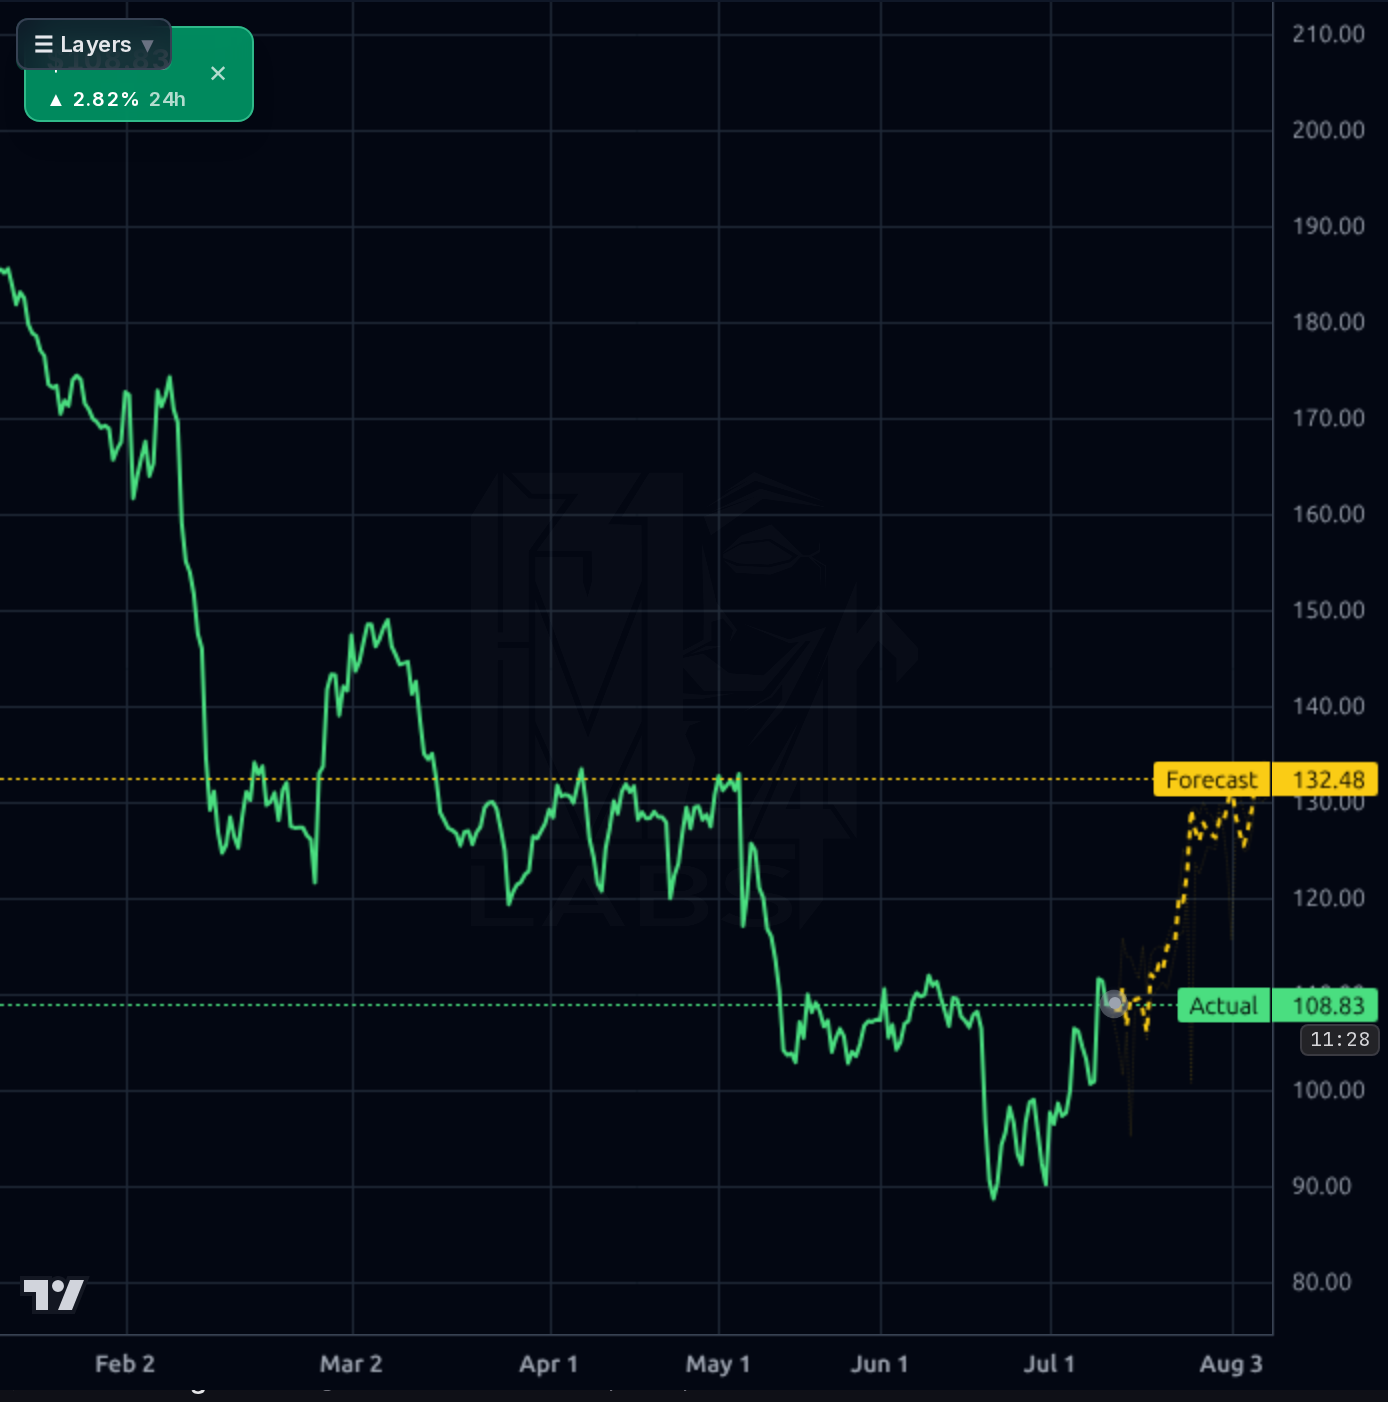
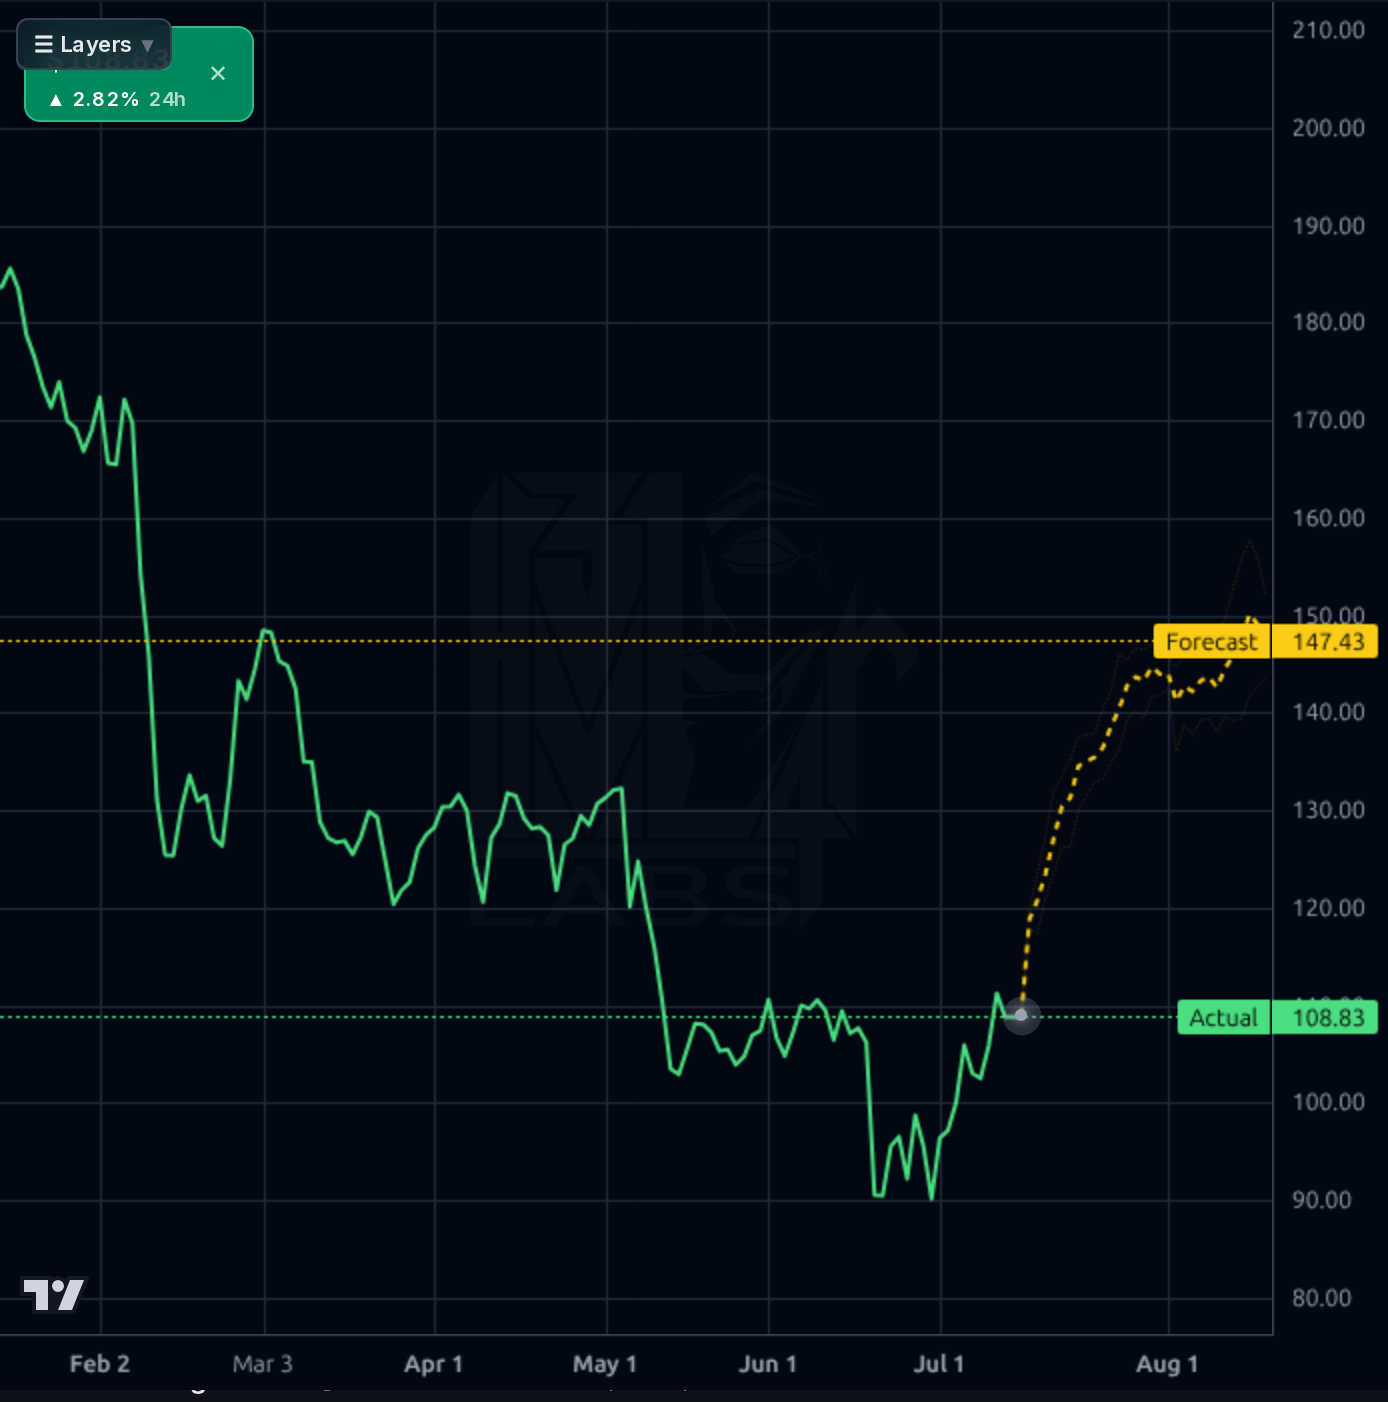
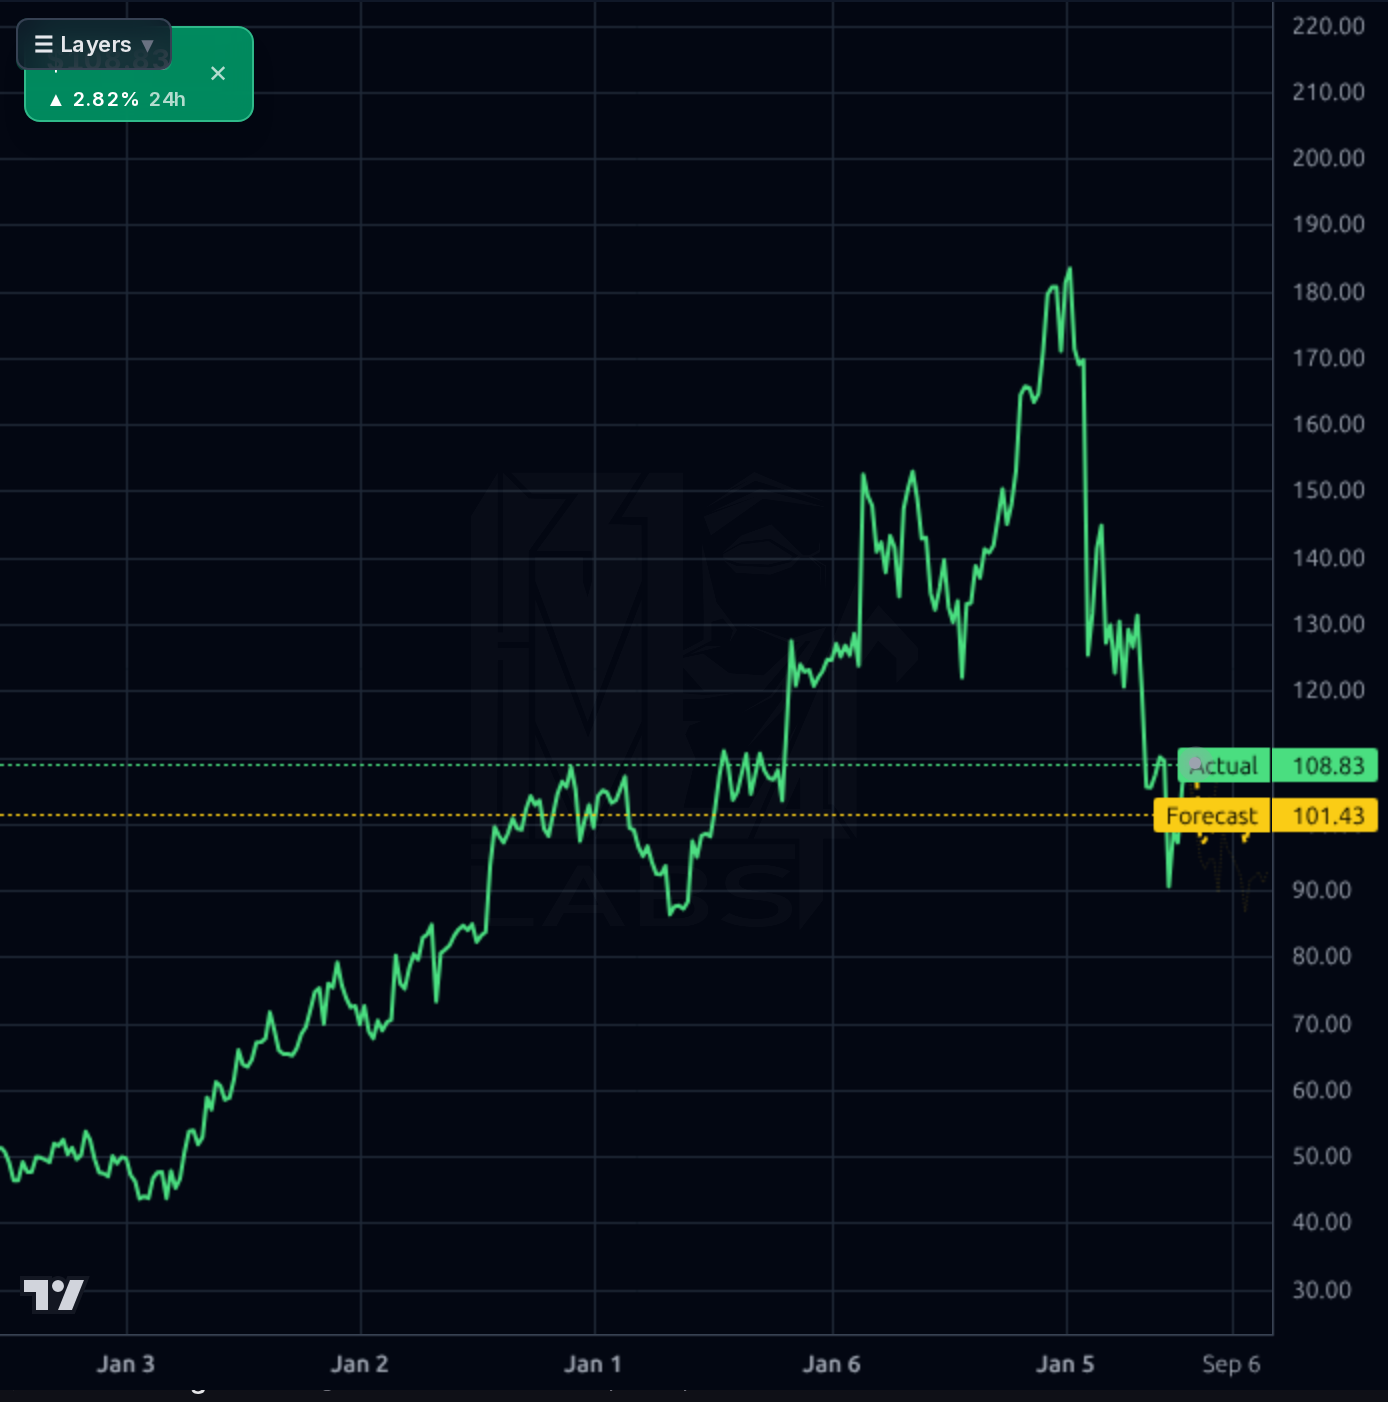
Price action has decisively repaired: the 1h chart shows a clean breakout from the June-July $95-$100 base to $108.83 (+2.82% on the day), with the short-term forecast band pointing to $111.21. The 4h chart confirms a stair-step higher, with the AI forecast projecting $132 over the horizon (though prior lessons show >$130 targets consistently fail). The daily shows the reclaim of the $100-108 zone and a projected $147 12-week path — treat as directional signal, not level. Weekly context is critical: HURN was rejected hard from $186 down to $85 and is now attempting the first legitimate weekly trend-repair with SMA20 distance of +11.1% and SMA50 +3.7%, though still -21.4% below the 200-day. RSI at 59 is bullish but not overbought, weekly performance +11.2% shows real momentum, and the forecast reliability is strong on 1wk (100% directional accuracy, 4% MAPE). Key levels: $108-110 flipped from resistance to support, $115 is next resistance (prior consolidation), then $125-130. Downside invalidation is a break back below $102, with $95 as the hard floor.
The most material item is the June 22 8-K disclosing an executive change (Item 5.02) — during a period of balance sheet stress, this is a governance question mark investors will want clarified. The June 30 disclosure of a director selling >1,800 shares into weakness is a negative sentiment signal, though small in absolute terms. On the positive side, June 29 coverage flagged a 7.1% single-day jump on above-average volume, and July 3 and July 9 pieces highlight HURN as a Russell 2000 and consulting services name with explosive upside potential, referencing a 44% undervalued view from at least one framework. The tape is a debate between a deep-value/mean-reversion crowd and a governance/leverage-concerned crowd; the news flow tilts modestly positive but is not a catalyst — the May 5 earnings print is.
- $86M contracted 2026 revenue plus $75M 2027 managed-services backlog provides multi-year visibility on recurring revenue mix shift
- Forward EPS of $10.22 vs TTM $5.85 implies analyst expectation of ~75% earnings recovery as Q1 margin trough reverses
- Huron Research product suite and RelateCare managed services drive higher-margin, recurring revenue away from lumpy consulting engagements
- AI/automation integration in enterprise EHR and ERP practices positions Huron as a beneficiary of Fortune 500 AI transformation spend
- Analyst consensus recommendation of 1.00 (strong buy) with $184 target price implies +66% upside if operational thesis is validated
- Debt surged $339M in Q1'26 to $887M with no publicly disclosed remediation plan; cash of only $26M leaves limited flexibility
- Q1'26 operating cash flow of -$162M and FCF of -$174M is a stark reversal from Q4's +$126M and impairs near-term deleveraging
- Gross margin compressed 300bps to 30.0% and operating margin fell 400bps to 8.2% — margin recovery is not yet demonstrated
- June 22 executive change filed as Item 5.02 during balance sheet stress raises governance/continuity questions ahead of May 5 earnings
- Director insider sale into weakness (June 30 disclosure) signals lack of insider conviction at these levels
- Long-horizon AI forecasts targeting $132-$147 have historically failed to print for this name — do not anchor on them
- Consulting services is cyclical; a Healthcare/Education capex slowdown would compound the margin pressure already visible
Get AI analysis on any stock
This is one of hundreds of Kronos AI reports — scored fundamentals & technicals, bull/base/bear price targets, a multi-horizon plan, and continuously-updated forecasts across the market. Create a free account to explore them all.
Create your free account →Already a member? Sign in · Join our Discord