HURN — AI Stock Forecast & Price Targets
Published 7/10/2026 · A free sample of K3vl4r’s AI-powered analysis.
Kronos price forecasts, scored fundamentals & technicals, and a multi-horizon plan.
View the live HURN price forecast →
Huron trades at $102.51 (8.8x forward P/E, -41% YTD) with a stark tension between solid operational execution (11.8% revenue growth, 23% ROE, 1.00 analyst recom) and acute balance sheet stress (D/E 2.23x, Q1 FCF -$174M, debt jumped to $887M from $548M). The stock has stabilized above $100 with RSI neutral at 50 and a 6.4% weekly bounce, suggesting the panic phase may be ending, but multiple re-rating requires evidence of leverage remediation at the May 5 print.
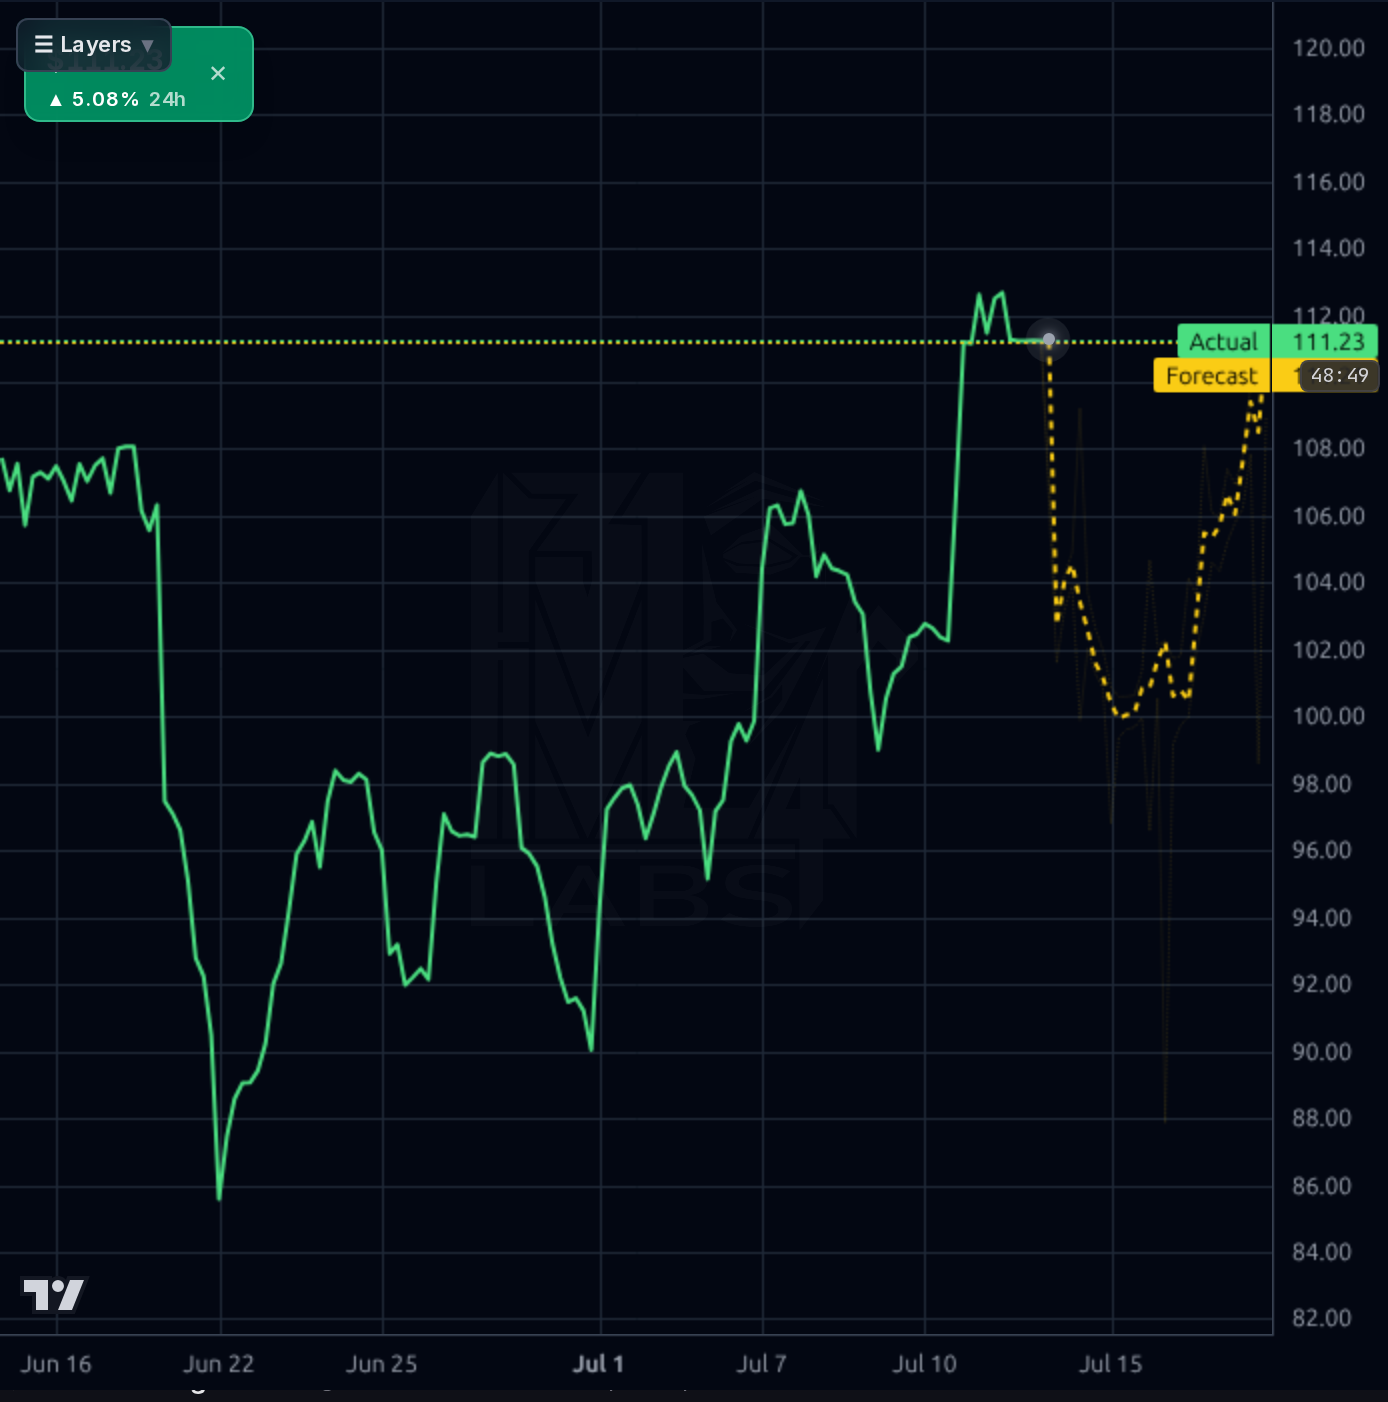
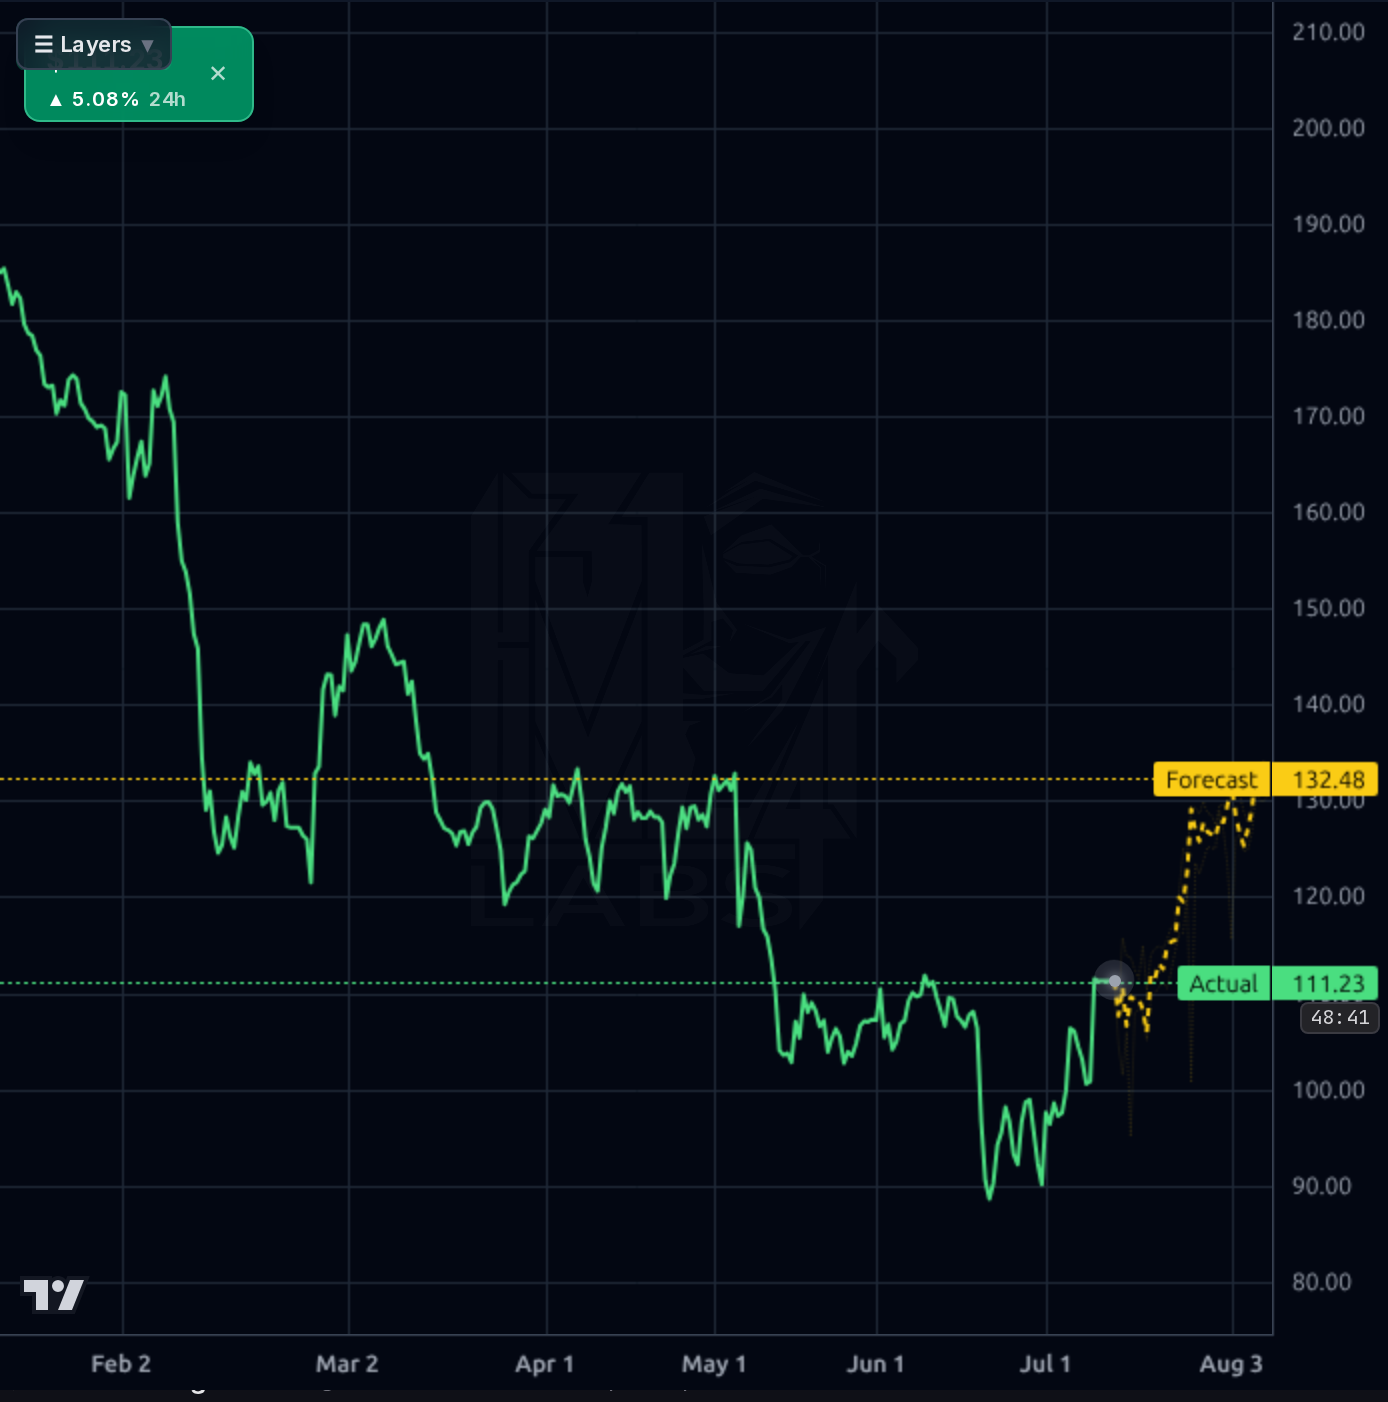
Over 1-4 weeks, treat $100 as the pivot: sustained holds above it argue for a mean-reversion move toward $108-$112 (gap-fill and 50-day). Initiate or add small size (1/3 to 1/2 of target position) with a stop below $92 (recent swing low structure). The 6.4% weekly bounce, RSI at 50, and reclaim of the 20-day SMA are constructive but not yet a confirmed trend change. Do not chase strength into $110+ without volume confirmation. Invalidation: a decisive break below $92 reopens $85 (52-week low). Avoid heavy sizing before the May 5 earnings print.
Over 1-6 months, the thesis is mean-reversion to $110-$120 base case if Q2'26 shows FCF normalization and clarity on the debt jump. Expected return range: -10% to +25% skewed positively given the 8.8x forward P/E provides valuation asymmetry. Key catalysts: May 5 earnings (FCF trajectory, debt commentary, gross margin recovery back above 30%), any deleveraging announcements, and RelateCare integration progress. Thesis breaks if: (1) Q2 shows another quarter of negative FCF without a credible explanation, (2) gross margin fails to recover above 30%, or (3) management guidance signals demand softness in Healthcare/Education end markets. Base target $112 is my derived level from technical gap-fill combined with 11x forward earnings.
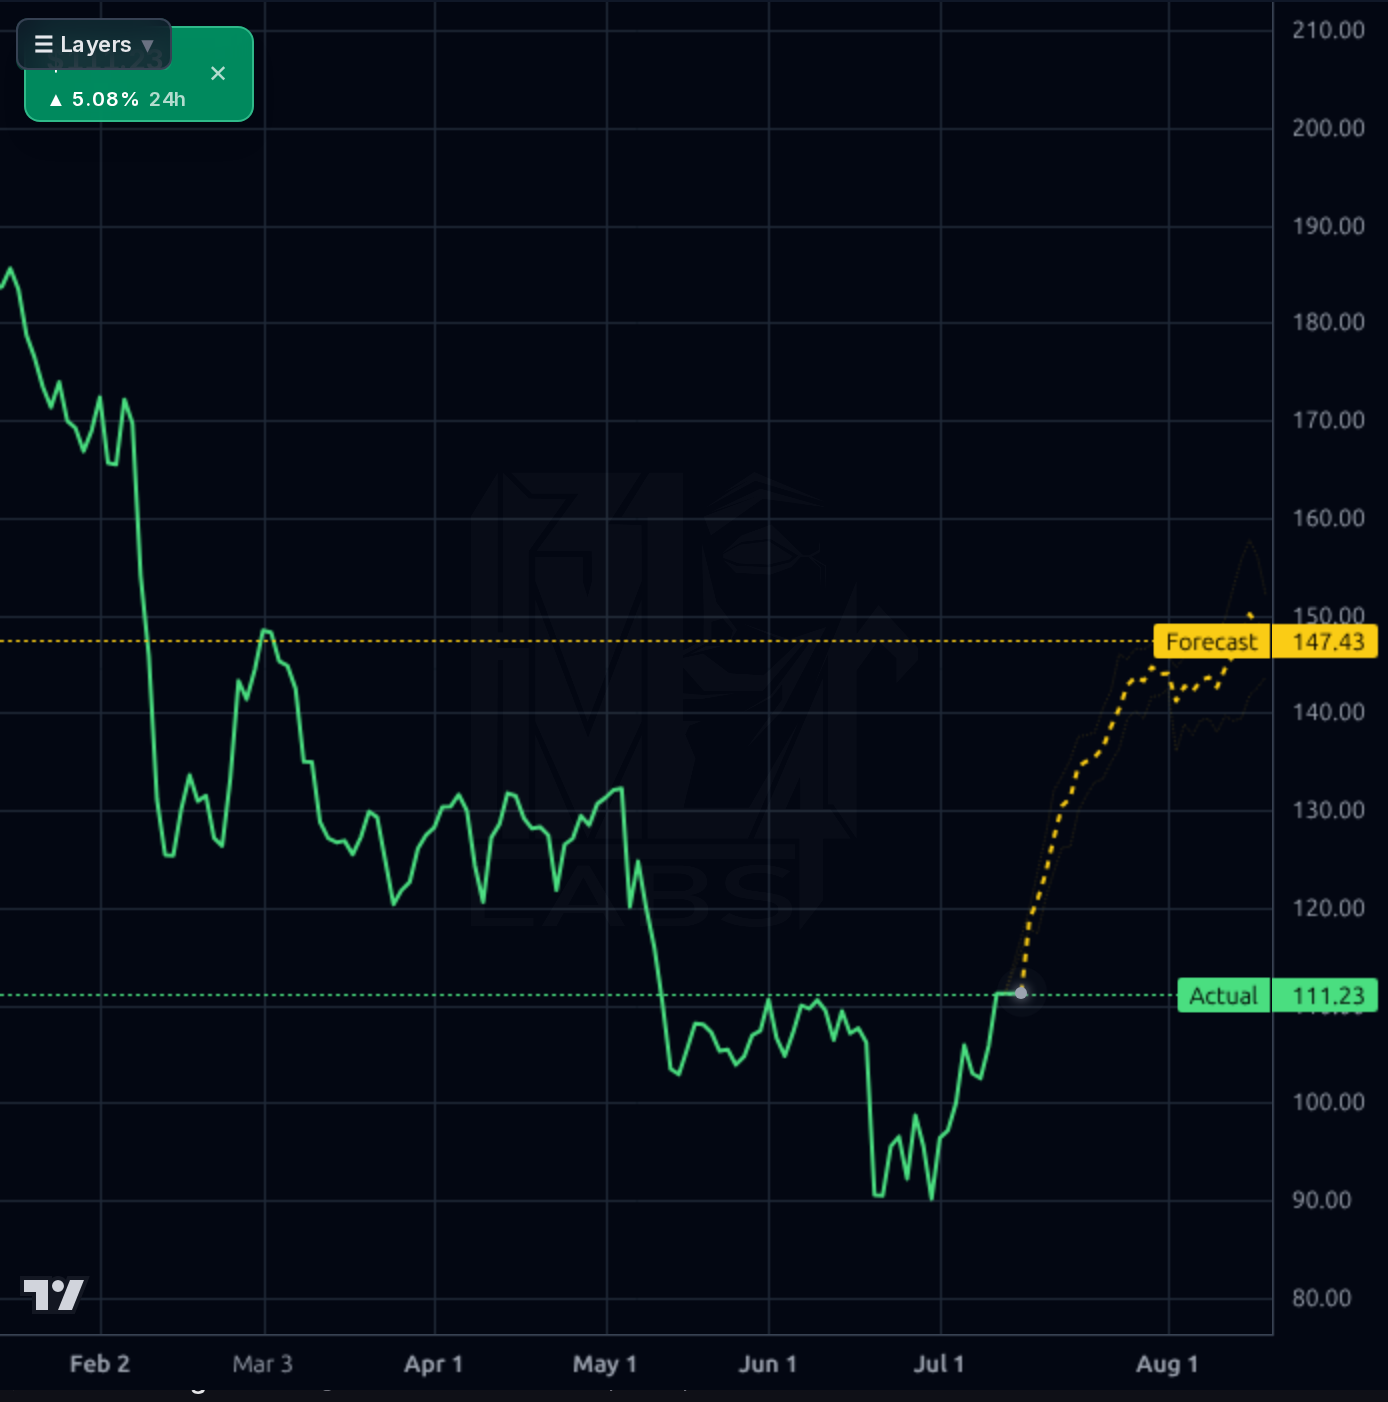
Over 1-3 years, if Huron executes on the shift to recurring managed services revenue (RelateCare, Healthcare digital, Huron Research), the model can re-rate to 13-15x forward earnings on $12-$14 EPS by FY28, implying $150-$180. The multi-year drivers are: (1) managed services revenue mix moving above 25%, improving revenue visibility and margin stability, (2) Healthcare segment continuing to compound above 10% given the durable outsourcing tailwind, and (3) deleveraging bringing D/E back below 1.5x. The biggest structural risk is that Huron is a professional services firm competing against Accenture, Deloitte, and boutiques with better balance sheets — any prolonged Healthcare capex slowdown could compress both growth and margins simultaneously, and the current leverage limits the ability to invest counter-cyclically.
Revenue trajectory remains constructive: TTM sales of $1.71B with Q1'26 at $451.8M (+11.8% Y/Y), continuing a multi-quarter double-digit growth pattern. However, Q1'26 gross margin compressed to 30.0% from 33.0% in Q4'25, and operating margin dropped to 8.2% from 12.2% — a meaningful sequential deterioration signaling either pricing pressure, mix shift, or integration friction. The balance sheet is where the thesis breaks: total debt surged to $887M from $548M in one quarter (a $339M jump), stockholders' equity dropped from $529M to $397M, and D/E ballooned to 2.23x. Q1'26 operating cash flow was -$162M and FCF -$174M — a stark reversal from the +$118M FCF in Q4'25. This likely reflects working capital seasonality plus what appears to be a buyback/M&A-funded debt raise, but management owes shareholders clarity. ROE remains strong at 23.3% and ROIC at 8.3%, suggesting the underlying business quality is intact. Analyst target of $184.25 with a 1.00 (strong buy) recom implies the sell-side sees this as noise, not signal.
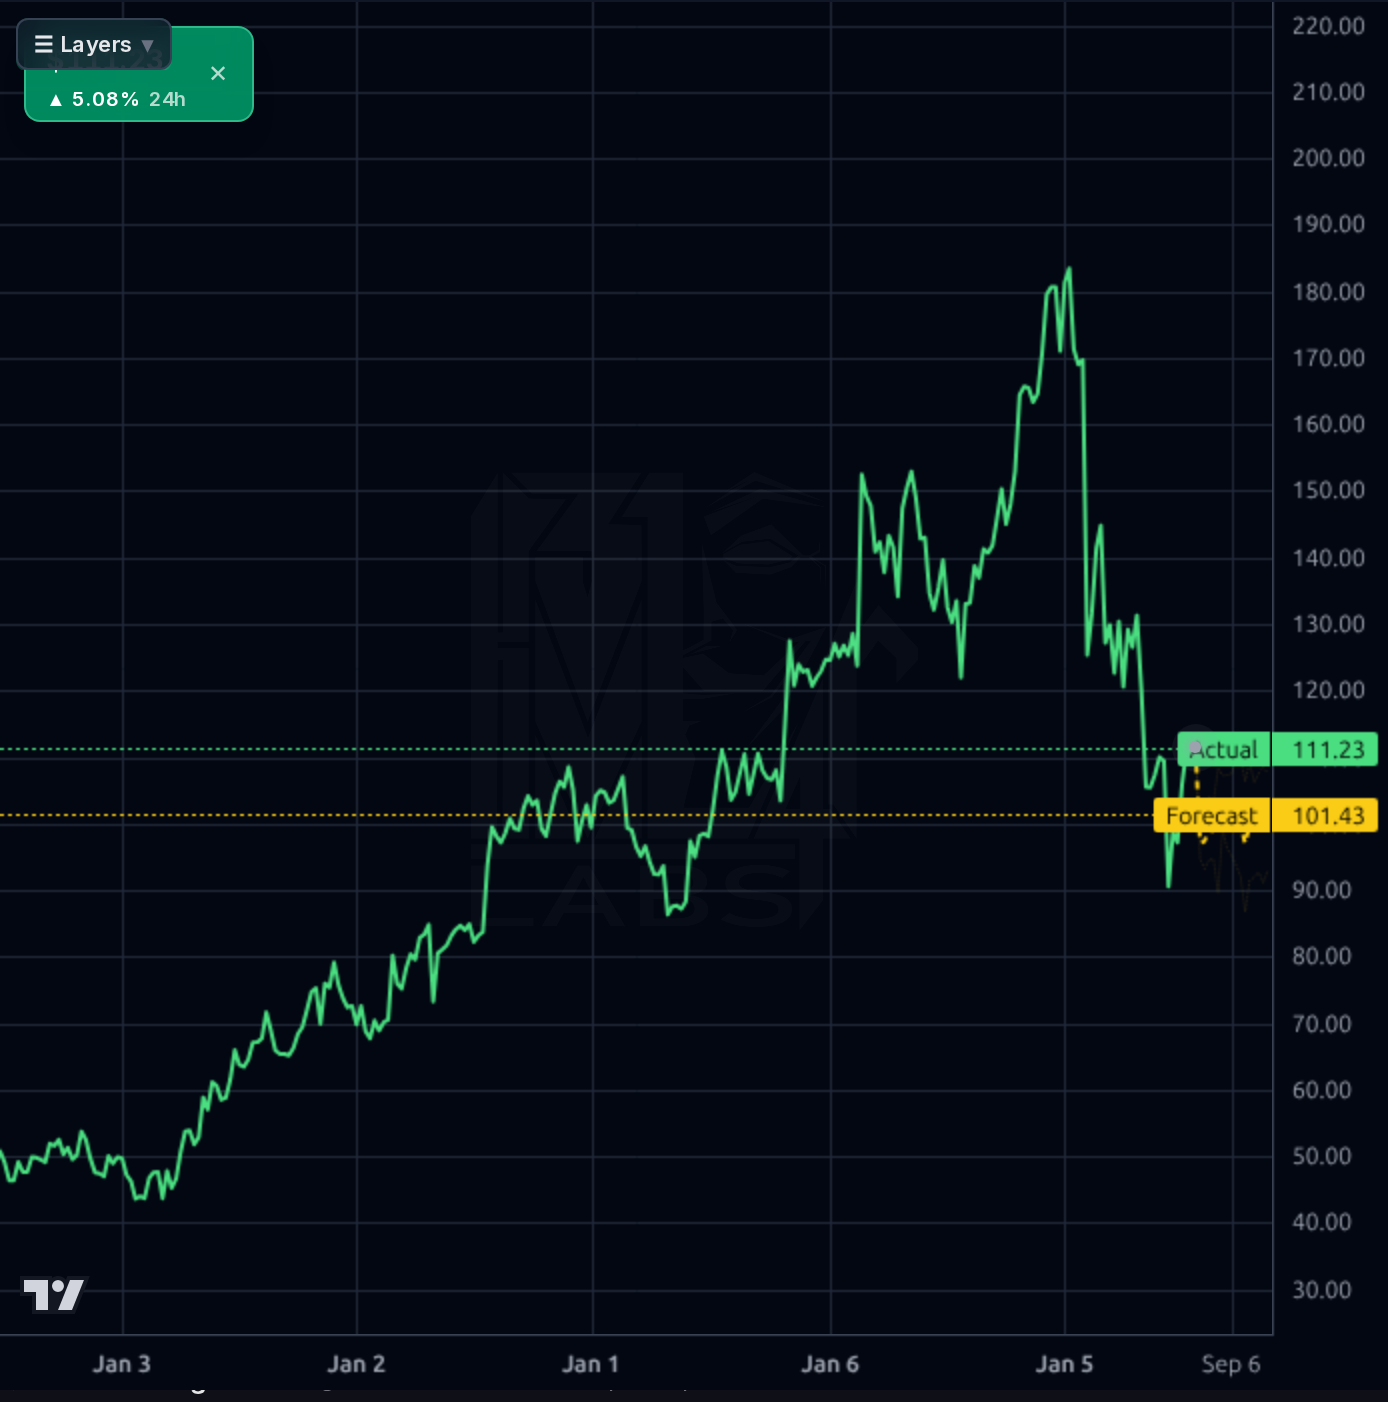
The multi-timeframe picture is mixed but stabilizing. On the daily, price sits at $102.51, +6.4% on the week, RSI 50 (neutral), SMA20 +2.5% (near-term bullish), SMA50 -5.2% (still below), and SMA200 -27.7% (long-term downtrend intact). The 52-week range of $84.88-$186.78 shows how brutal the drawdown has been (-45% from highs). The 1h and 4h Kronos forecasts project continued upside into the $110-$150 zone with the AI showing a 100% bullish probability — but the model's own realized MAPE of 31% on 1d and sub-baseline directional accuracy at short horizons demand heavy discounting. The 1wk forecast is more reliable (100% directional accuracy, 4% MAPE) and also leans bullish toward $123. The weekly chart shows price attempting to base after a sharp descent from ~$185. Key structure: support $95-$100 (must hold), resistance $108 (50-day area) then $115-$120 (breakdown gap), with $130+ requiring a fundamental catalyst. Prior bull targets above $135 have systematically failed to print.
The signal-to-noise ratio in recent news is low but leans constructive. StockStory (Jul 3) flagged HURN among Russell 2000 names with 'explosive upside potential,' and a June 29 Zacks piece highlighted a 7.1% single-session jump on above-average volume. Simply Wall St (Jul 9) quantified a 44% undervalued view, echoing the sell-side consensus. Counterweighting this, a Motley Fool piece flagged director selling of ~1,800 shares — small in absolute terms but poor optics given the drawdown. The June 22 8-K on an executive change (Item 5.02) is worth watching but the market absorbed it without incident. The absence of major negative disclosures since Q1 suggests the balance sheet shock may already be priced in. Broader market news (crypto, Meta data centers) is not relevant to HURN's thesis.
- Healthcare segment continues to lead consolidated growth with Q1'26 revenue of $451.8M (+11.8% Y/Y) and $86.2M in remaining performance obligations for 2026
- RelateCare integration into AI/healthcare managed services with 2027 revenue targets creating recurring revenue visibility
- Digital services expansion including EHR, ERP, AI/automation, and technology managed services broadening the addressable market
- Huron Research software suite for research administration compliance creates a differentiated, higher-margin product offering
- Analyst consensus at $184.25 with a 1.00 (strong buy) recom implies ~80% upside on multiple normalization
- Balance sheet stress: total debt jumped $339M sequentially to $887M with D/E at 2.23x — source and remediation plan not yet disclosed
- Q1'26 FCF collapsed to -$174M vs +$118M in Q4'25; if not seasonal working capital, this fundamentally impairs the deleveraging path
- Gross margin compression to 30.0% in Q1'26 from 33.0% in Q4'25 signals pricing pressure or mix deterioration
- SMA200 at -27.7% confirms a broken long-term uptrend; institutional distribution has been persistent (Inst Trans -5.62%)
- Executive change 8-K on June 22 (Item 5.02) adds leadership uncertainty at a fragile moment
- Model's own short-horizon directional accuracy is below the naive baseline at multiple horizons — bullish AI forecast should be heavily discounted
- Prior bull targets above $135 have repeatedly failed to print, suggesting a durable ceiling until balance sheet is repaired
- Sector cyclicality: Healthcare/Education consulting spending is vulnerable to a broader IT capex slowdown
Get AI analysis on any stock
This is one of hundreds of Kronos AI reports — scored fundamentals & technicals, bull/base/bear price targets, a multi-horizon plan, and continuously-updated forecasts across the market. Create a free account to explore them all.
Create your free account →Already a member? Sign in · Join our Discord