HURN— AI Stock Forecast & Price Targets
Published 7/1/2026 · A free sample of K3vl4r’s AI-powered analysis.
Kronos price forecasts, scored fundamentals & technicals, and a multi-horizon plan.
View the live HURN price forecast →
Huron Consulting's depressed valuation (8.8x forward P/E) reflects structural concerns over aggressive leverage and negative cash flow, despite strong operational metrics like record revenue and AI-driven expansion. Technicals show a broken trend with no near-term breakout confirmation, while recent news highlights both catalysts (RelateCare acquisition) and risks (insider sales).
Wait for confirmation of $100 resistance; if breached, target $110-$115 as initial upside. Avoid entry below $90 due to technical breakdown and negative FCF momentum. Invalidation: close below $84.88 (52-week low).
Focus on Q2 FCF recovery and margin stabilization; base case targets at $108-110 with 12-month upside potential of 15-20%. Catalysts include RelateCare integration progress and debt reduction. Change your mind if FCF turns positive or margins stabilize above 9%.
Terminal thesis hinges on successful AI healthcare expansion and debt restructuring; long-term growth depends on maintaining double-digit revenue growth while reducing leverage to below 1.5x. Structural risk is high due to cyclical IT budget constraints in consulting sector, which could limit margin recovery even with strategic M&A.
Revenue growth remains robust at 11.79% Y/Y TTM, supported by AI-enabled healthcare expansion (RelateCare acquisition), but margins are under pressure: gross margin fell to 30% and operating margin dropped to 8.2%, indicating structural profitability concerns. The balance sheet is highly leveraged with debt/equity at 2.24x, and Q1 FCF turned negative (-$174M) despite record revenue ($443.7M), creating significant debt service risk. Capital allocation appears misaligned as debt surged to $889.8M (up from $548.3M in prior quarter), suggesting aggressive leverage accumulation rather than strategic M&A funding.
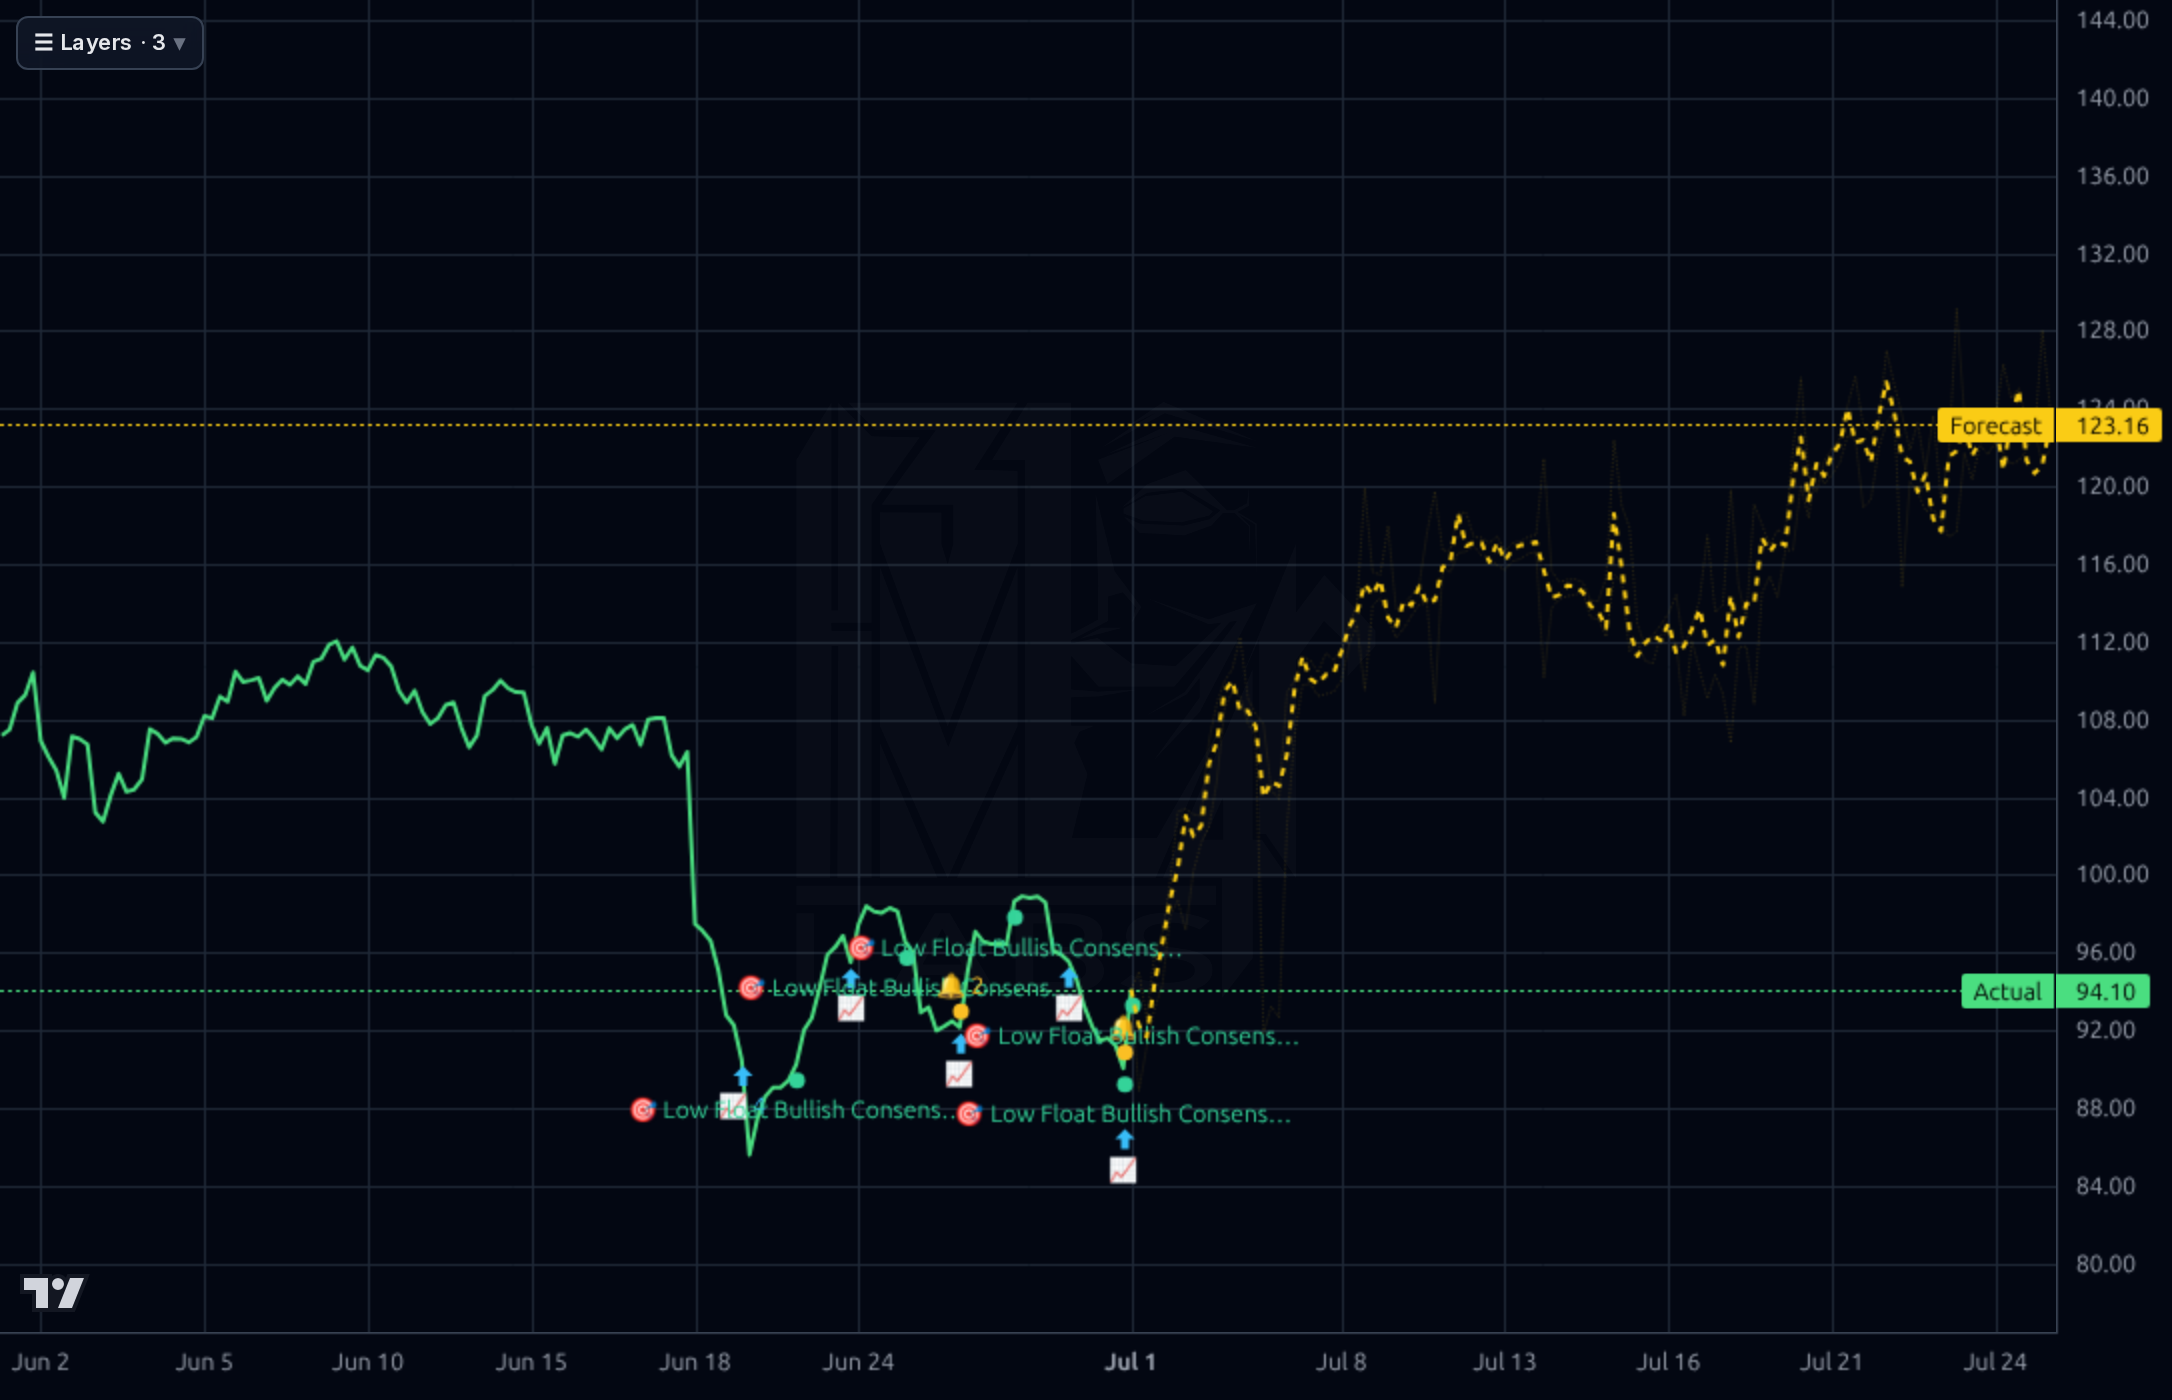
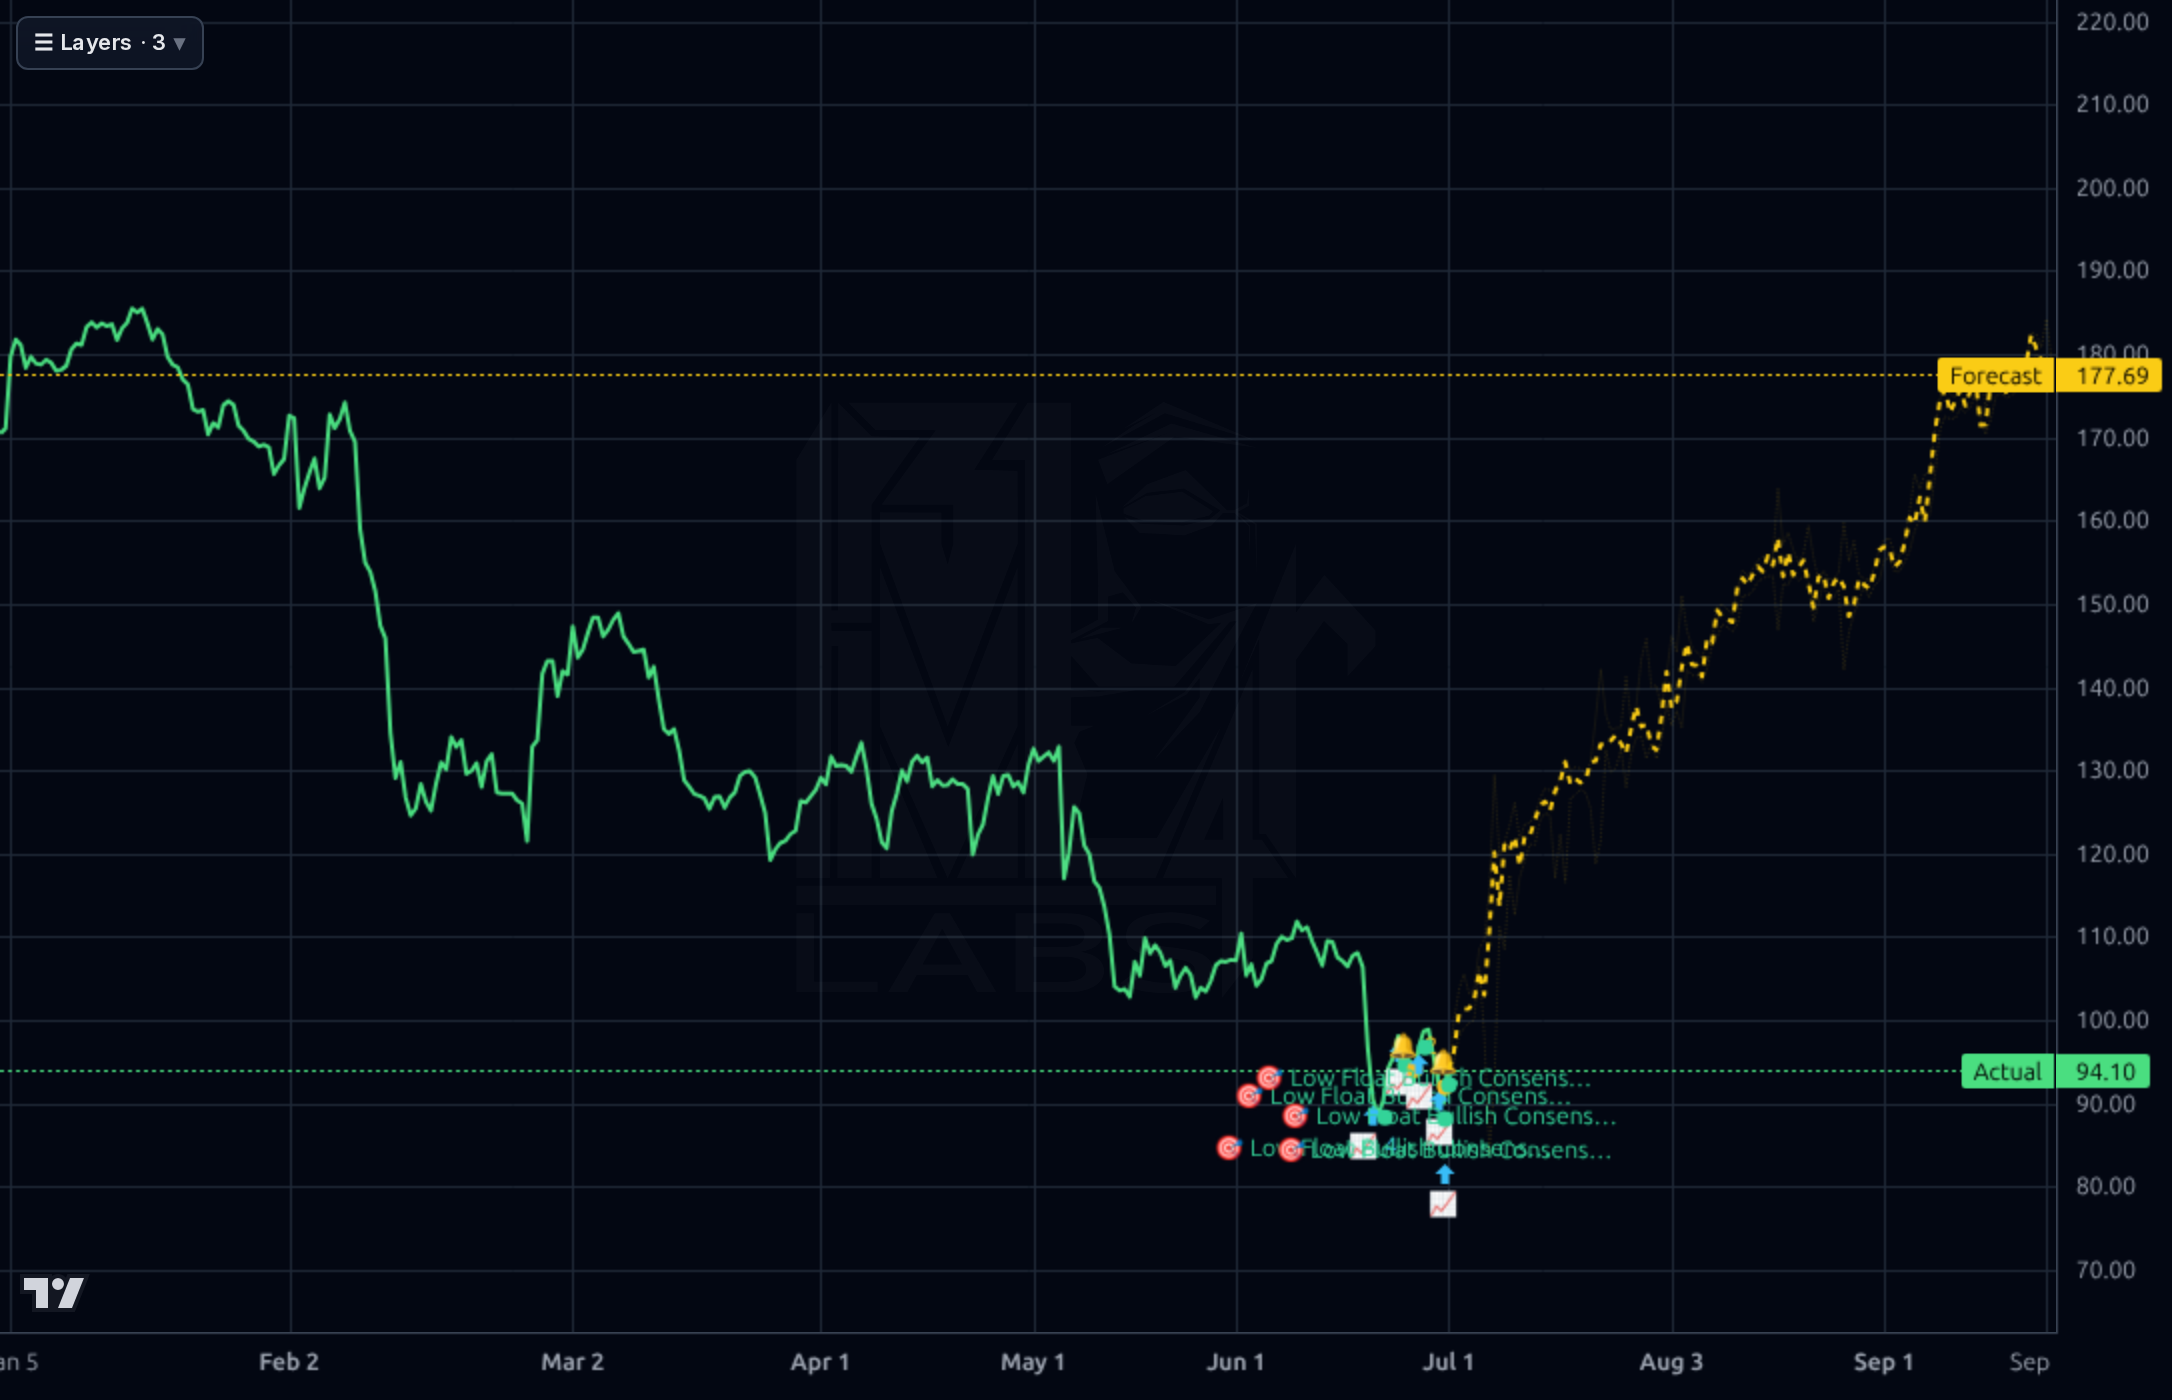
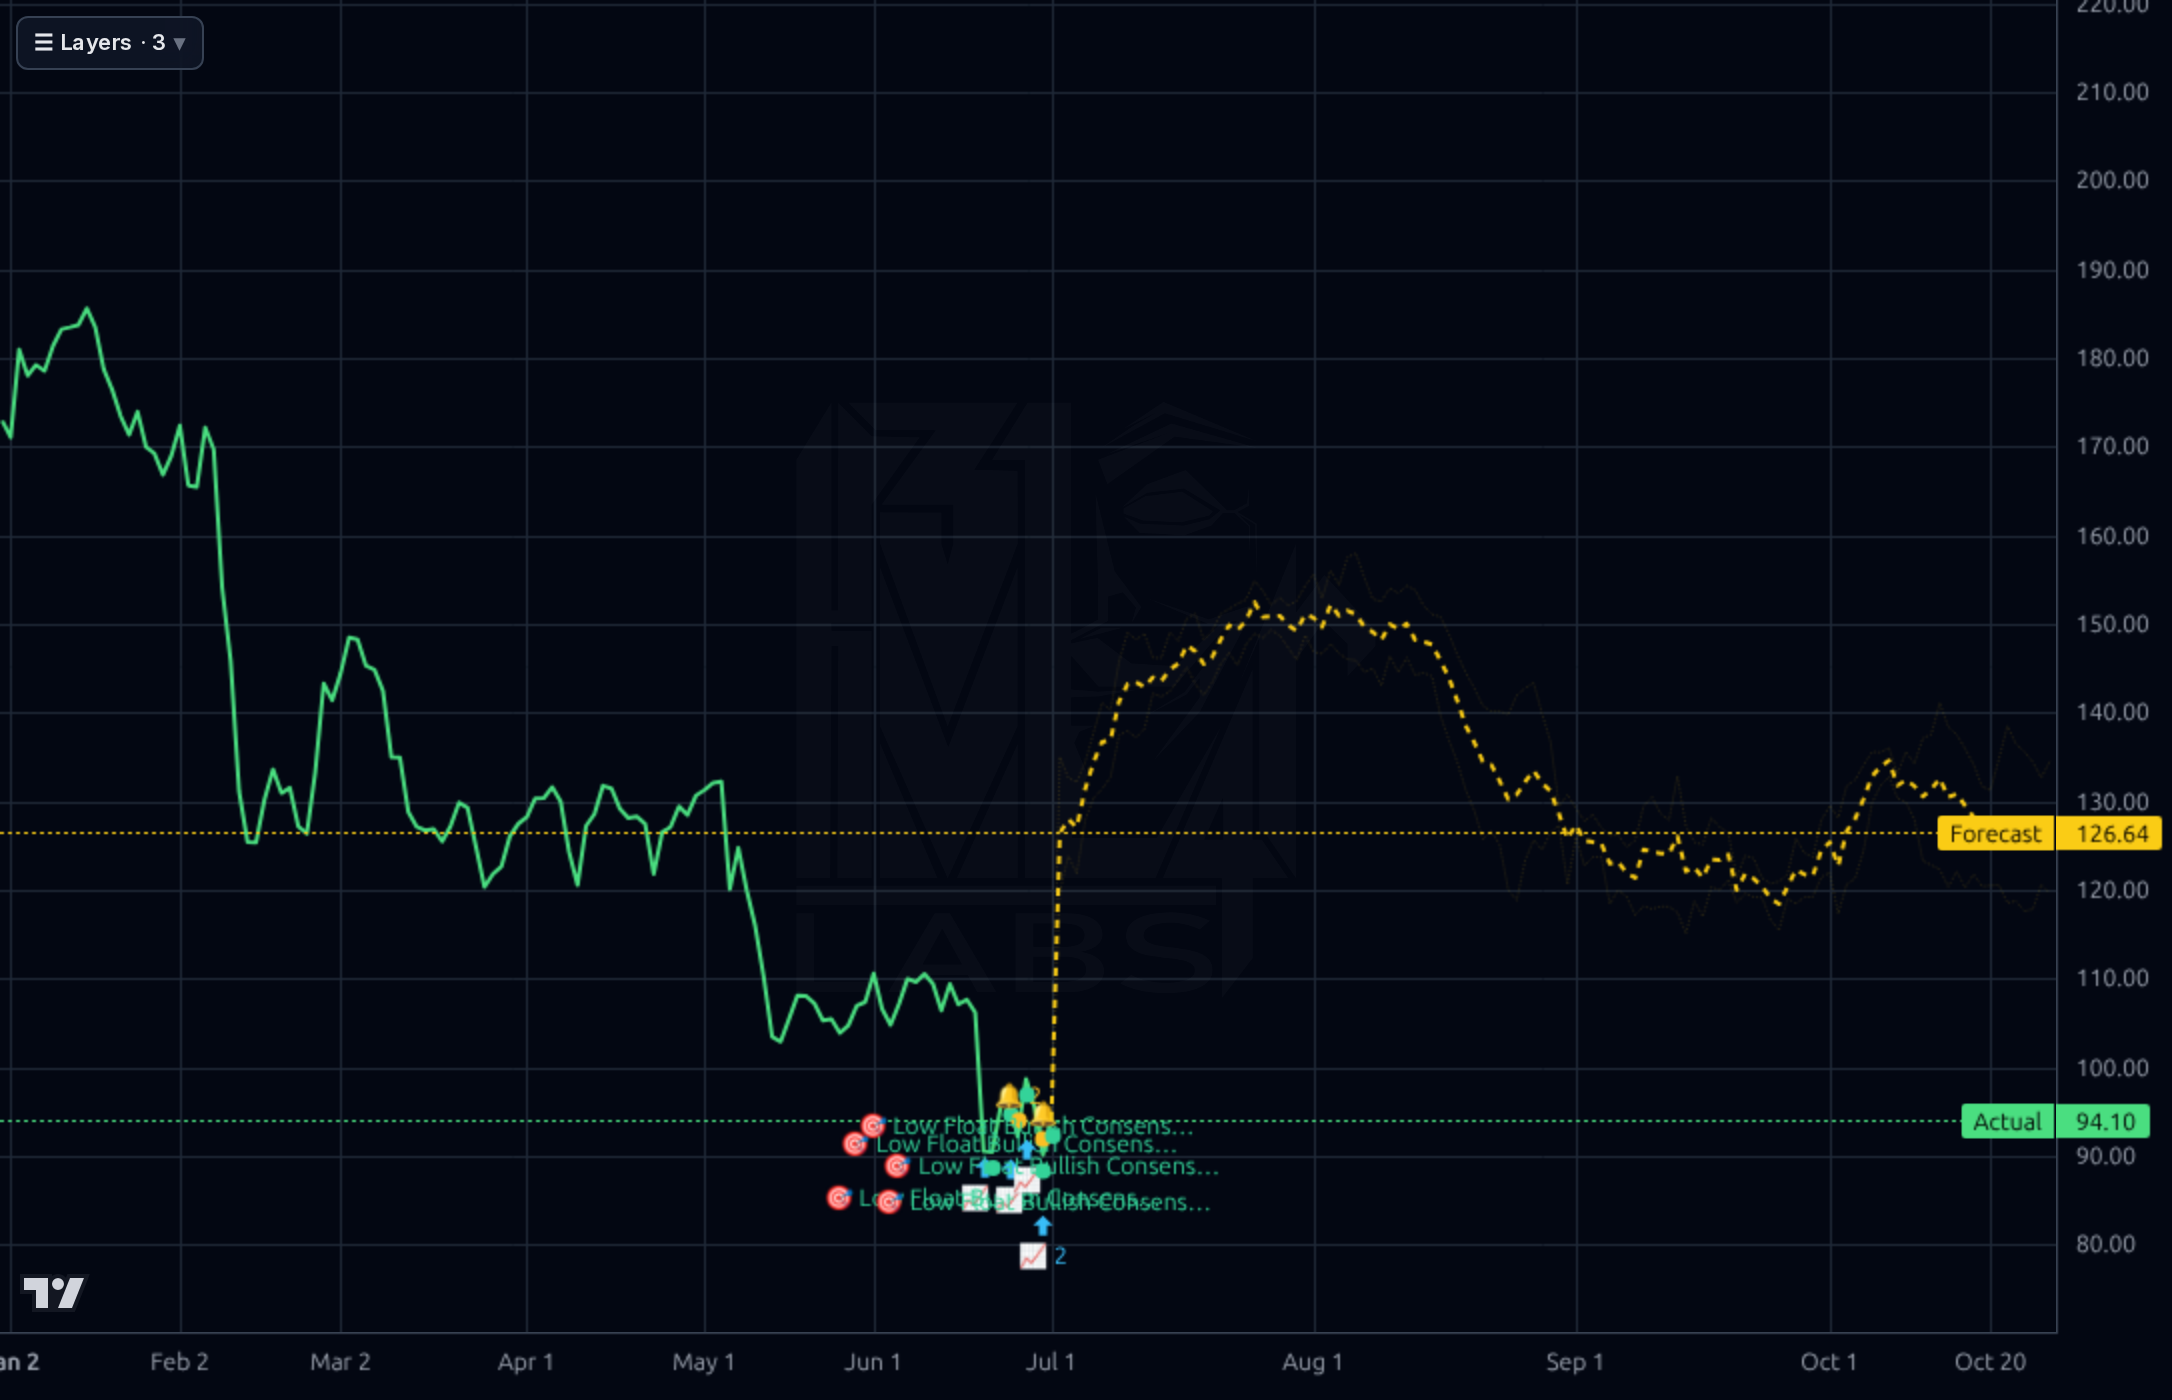
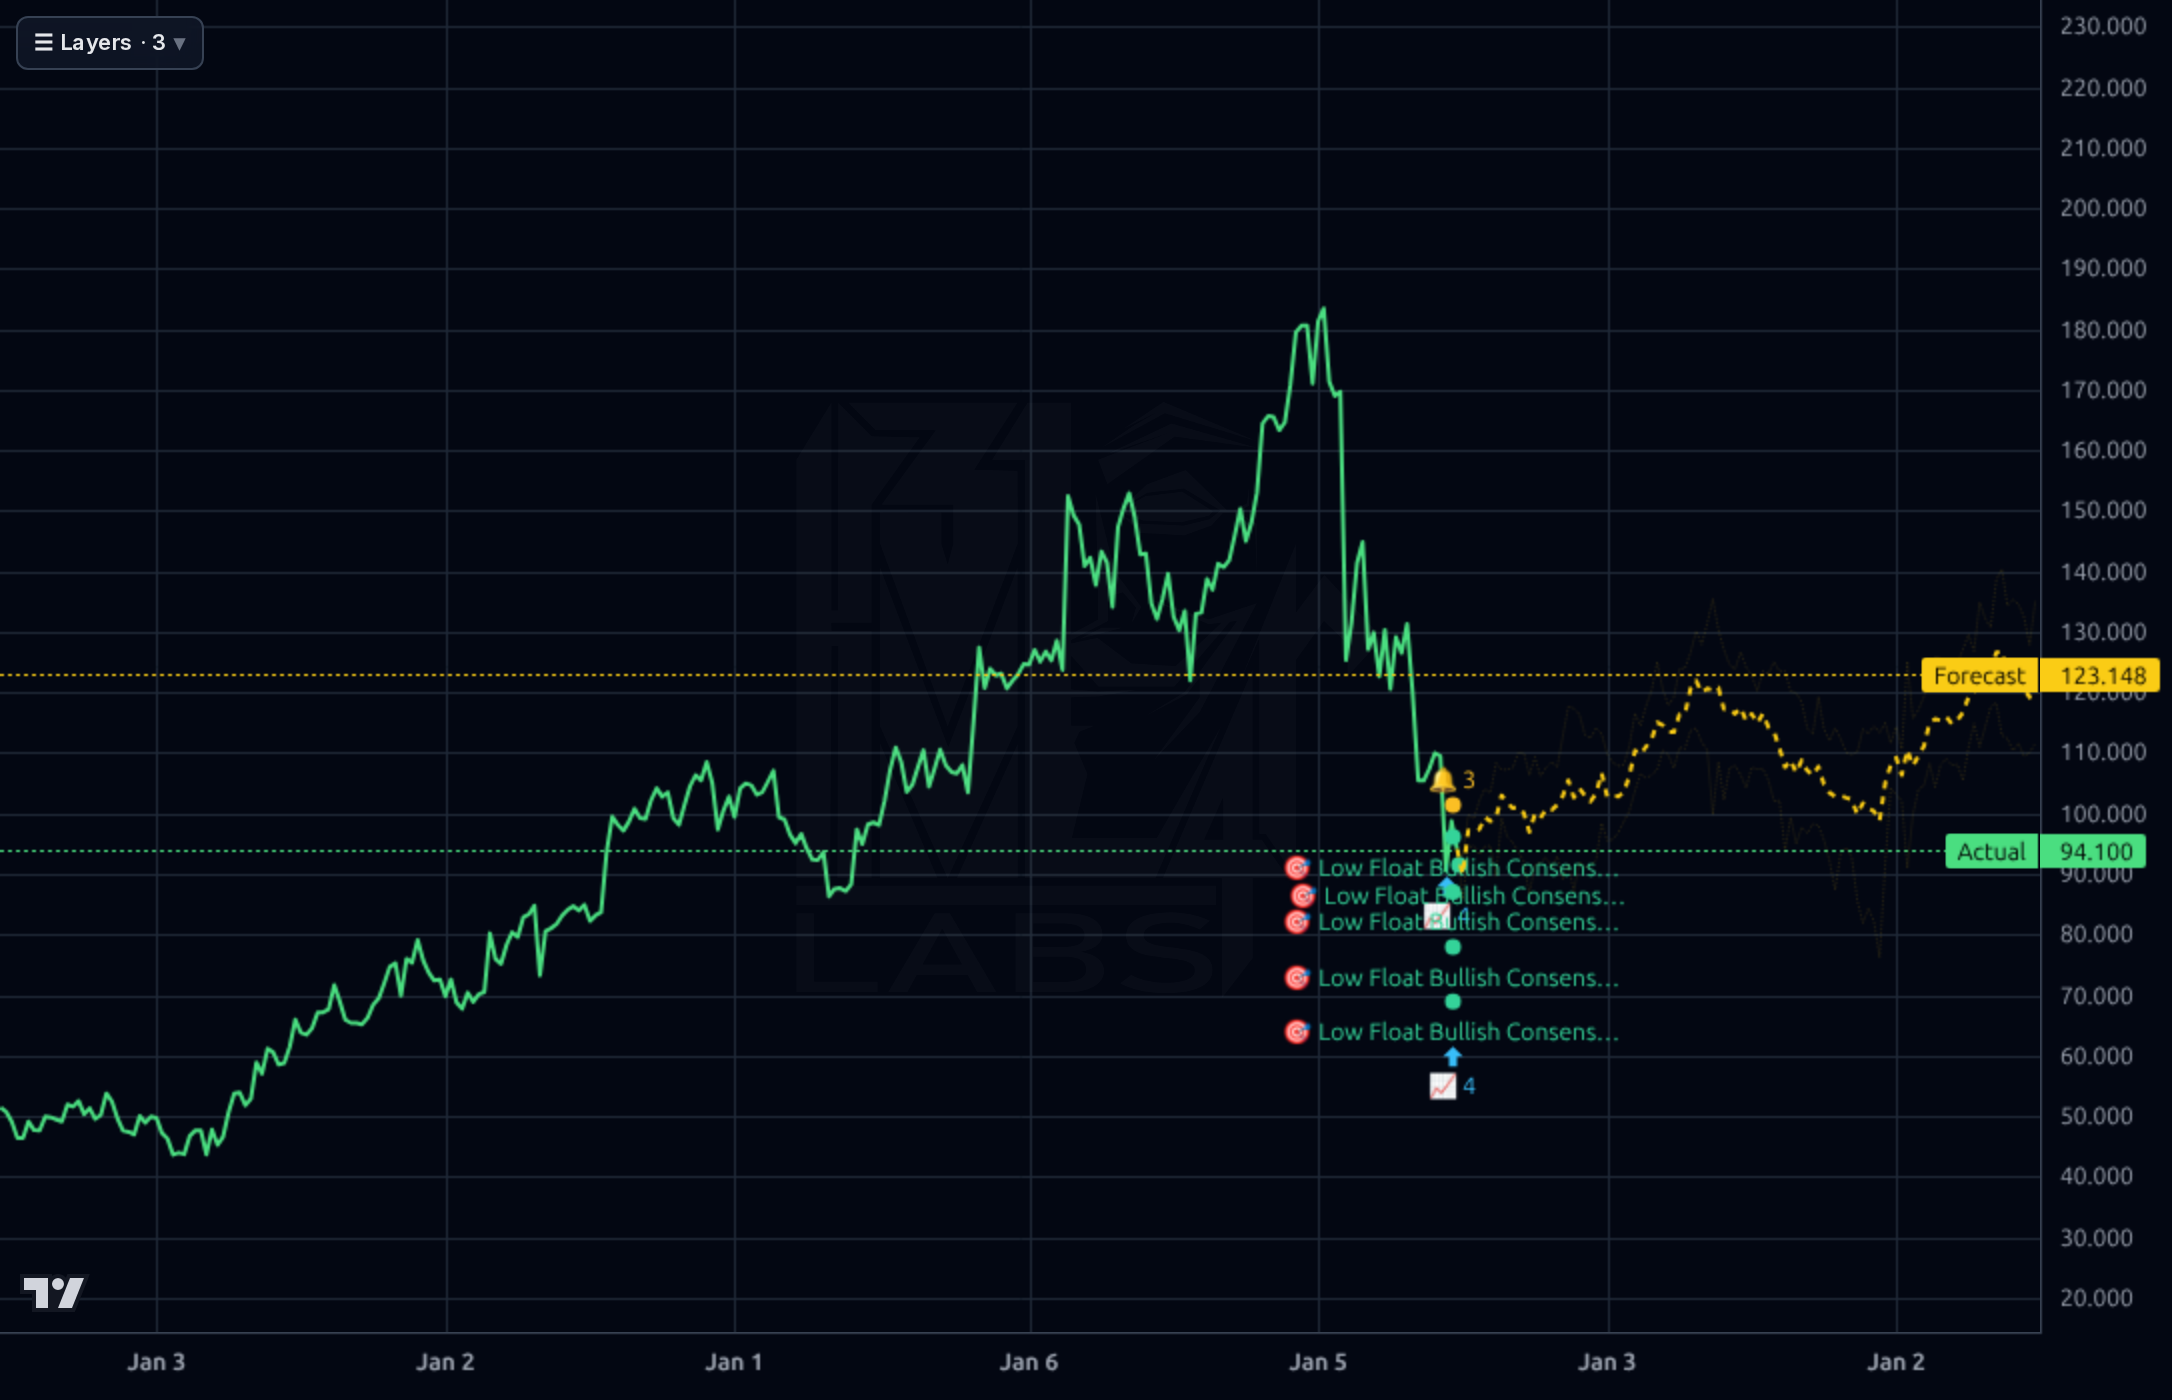
The chart shows a decisively broken trend with price below key support levels ($100) and the SMA20 (-11.82%) and SMA50 (-18.91%) both negative. The Kronos AI forecast band (yellow dashed line) suggests limited upside potential, with current price at $90.16 well below the forecasted range of $123.148-$125.64. RSI at 35.30 indicates oversold conditions but no momentum reversal; technicals require confirmation of $100 resistance before any sustained rally.
Recent news highlights both catalysts and risks: the RelateCare acquisition (June 4) expands AI healthcare services, while insider sales (June 30) signal management confidence. However, Truist's price target reduction to $155 (June 9) and negative Q1 FCF (-$174M) overshadow bullish narratives. The stock has dropped 48.4% from its 52-week high ($186.78), with current price at $90.16 near the 52-week low of $84.88, indicating severe downside risk.
- RelateCare acquisition integration (June 4 news) expected to boost AI healthcare services revenue by $75M annually starting 2027
- Aggressive leverage build-up ($889.8M debt) combined with negative Q1 FCF creates significant debt service risk
- Cyclical IT budget slowdowns in enterprise consulting sector could erode margin recovery progress
- Negative cash flow momentum (Q1 FCF -$174M) may persist despite revenue growth
Get AI analysis on any stock
This is one of hundreds of Kronos AI reports — scored fundamentals & technicals, bull/base/bear price targets, a multi-horizon plan, and continuously-updated forecasts across the market. Create a free account to explore them all.
Create your free account →Already a member? Sign in · Join our Discord