HURN — AI Stock Forecast & Price Targets
Published 7/10/2026 · A free sample of K3vl4r’s AI-powered analysis.
Kronos price forecasts, scored fundamentals & technicals, and a multi-horizon plan.
View the live HURN price forecast →
Huron Consulting Group (HURN) presents a mean-reversion opportunity with strong operational metrics but is hampered by severe balance sheet stress and negative cash flow momentum. The stock has stabilized above $100 with RSI neutral at 50, suggesting potential for asymmetric upside upon leverage stabilization.
Hold near $100 with tight stop-loss at $95; invalidation is break below $95, which would confirm balance sheet fears. Monitor for confirmation of leverage stabilization or technical breakout above $108.
Accumulate if price holds above $100 and signs of deleveraging emerge (e.g., positive FCF trends). Target range $108-$115 based on base case targets; catalysts include debt reduction plans and margin recovery to 30%+ operating margins. Invalidation is sustained weakness below $95.
Terminal thesis assumes successful deleveraging and margin expansion, with HURN trading at a multiple reflecting its operational strength (23% ROE). Structural risk includes continued capital expenditure slowdown in healthcare consulting; long-term value hinges on execution of managed services growth strategy. Multi-year drivers include AI integration via RelateCare and recurring revenue models.
Revenue growth remains robust at 11.79% YTD (TTM), driven by Healthcare segment ($1.71B TTM). Gross margins have declined to 30.0%, and operating margins are pressured at 11.77%. Balance sheet stress is acute with debt surging to $887M (D/E 2.23x) and Q1'26 FCF collapsing to -$174M, reversing prior positive cash flow trends. Strong operational metrics (23% ROE, 8.28% ROIC) provide a fundamental floor but are overshadowed by capital structure concerns. Management must demonstrate credible deleveraging plans before multiple re-rating can occur.
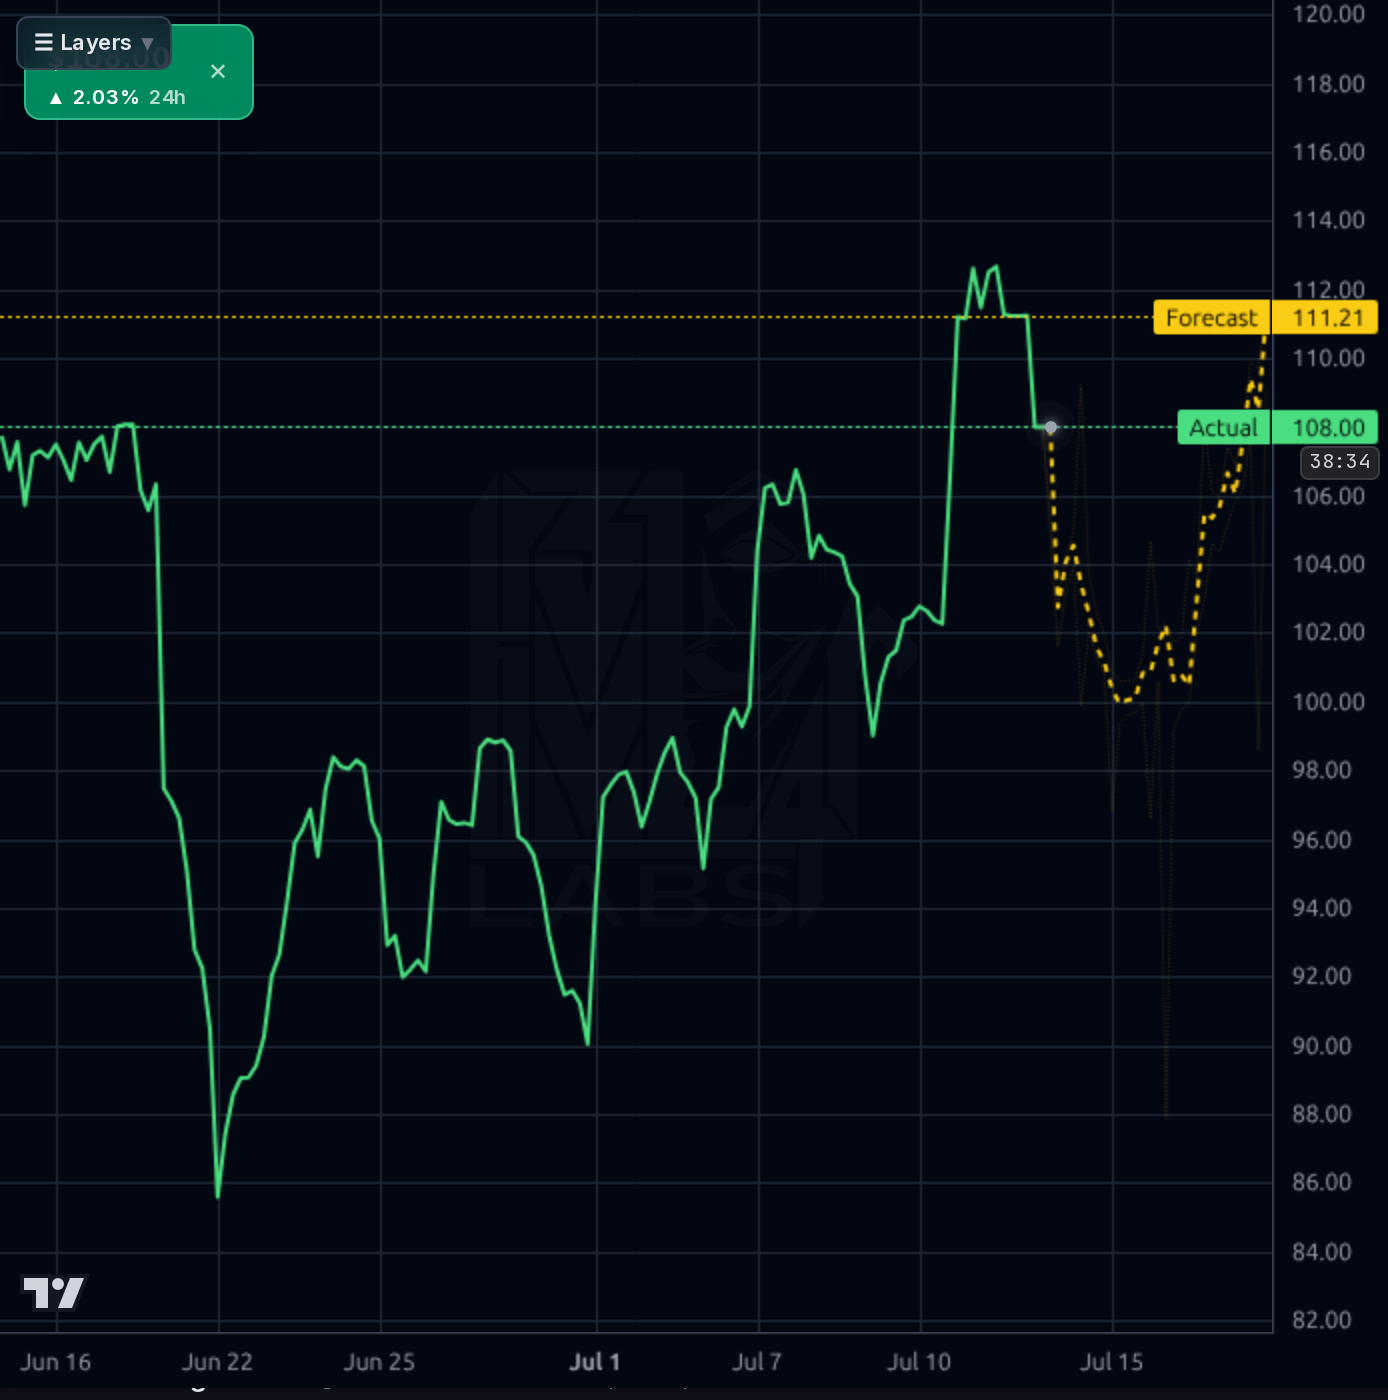
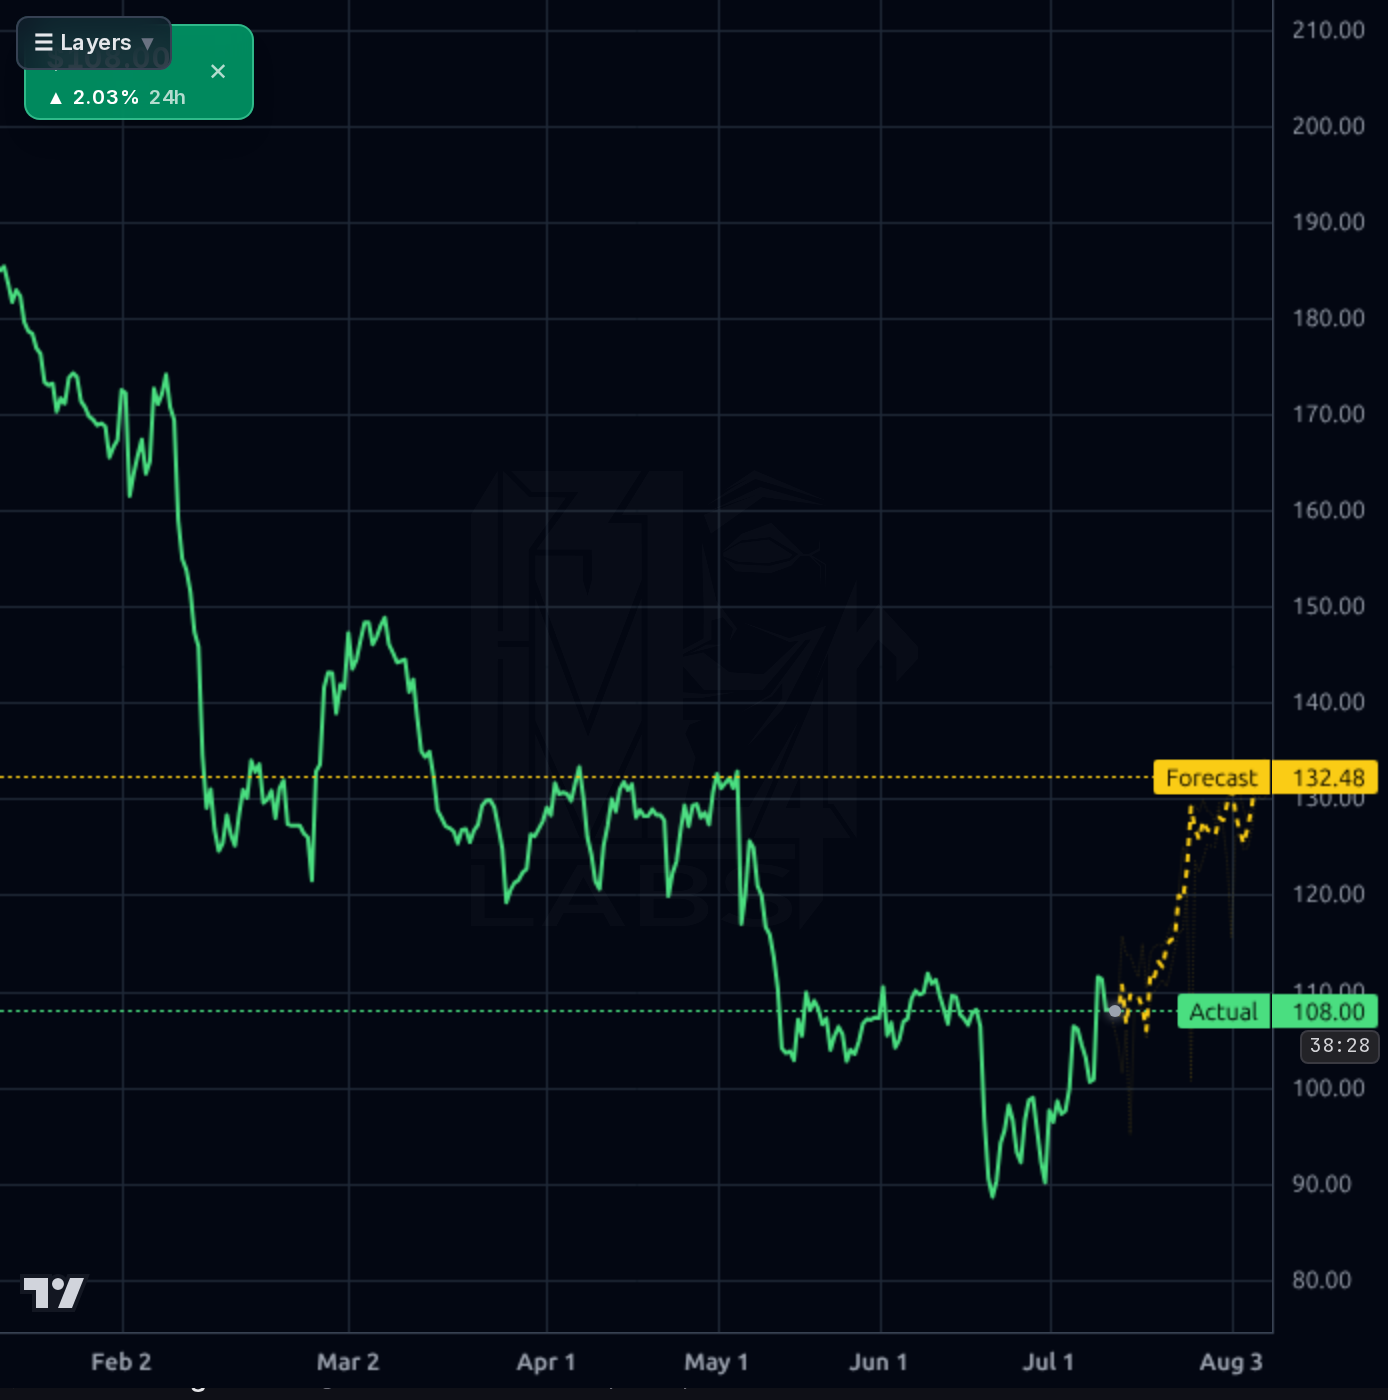
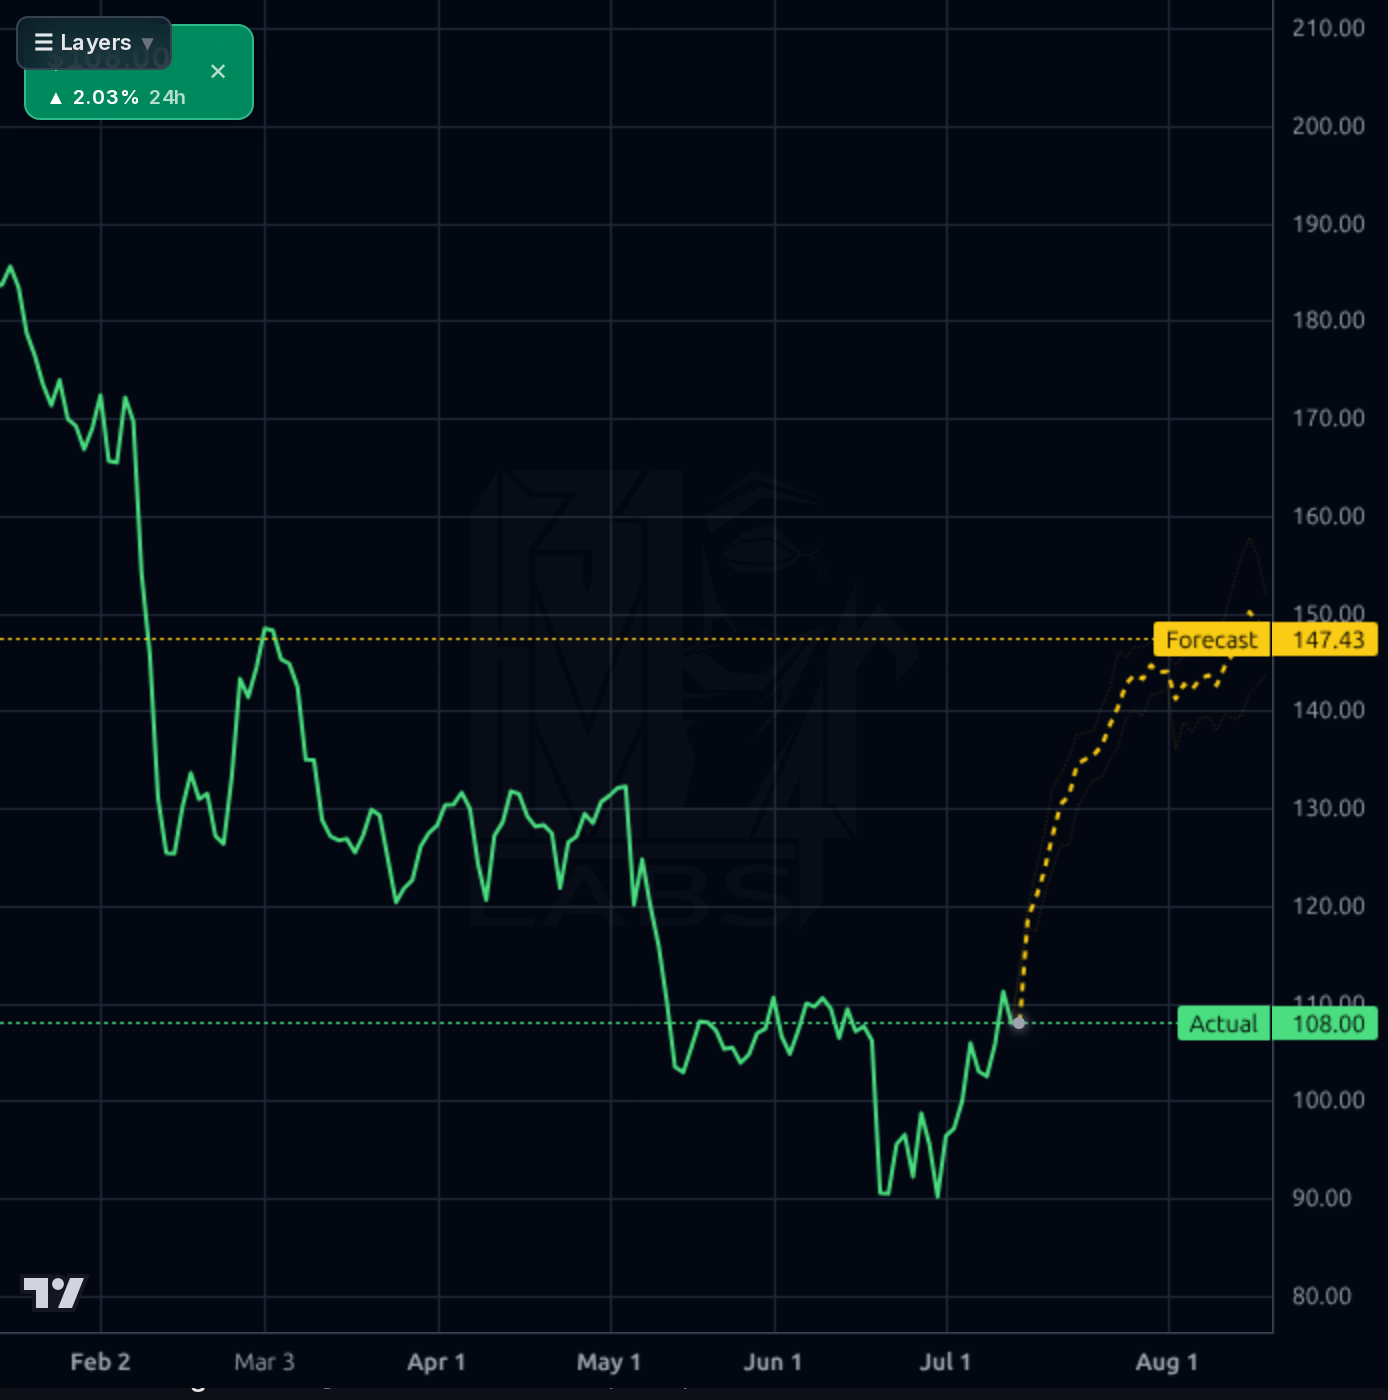
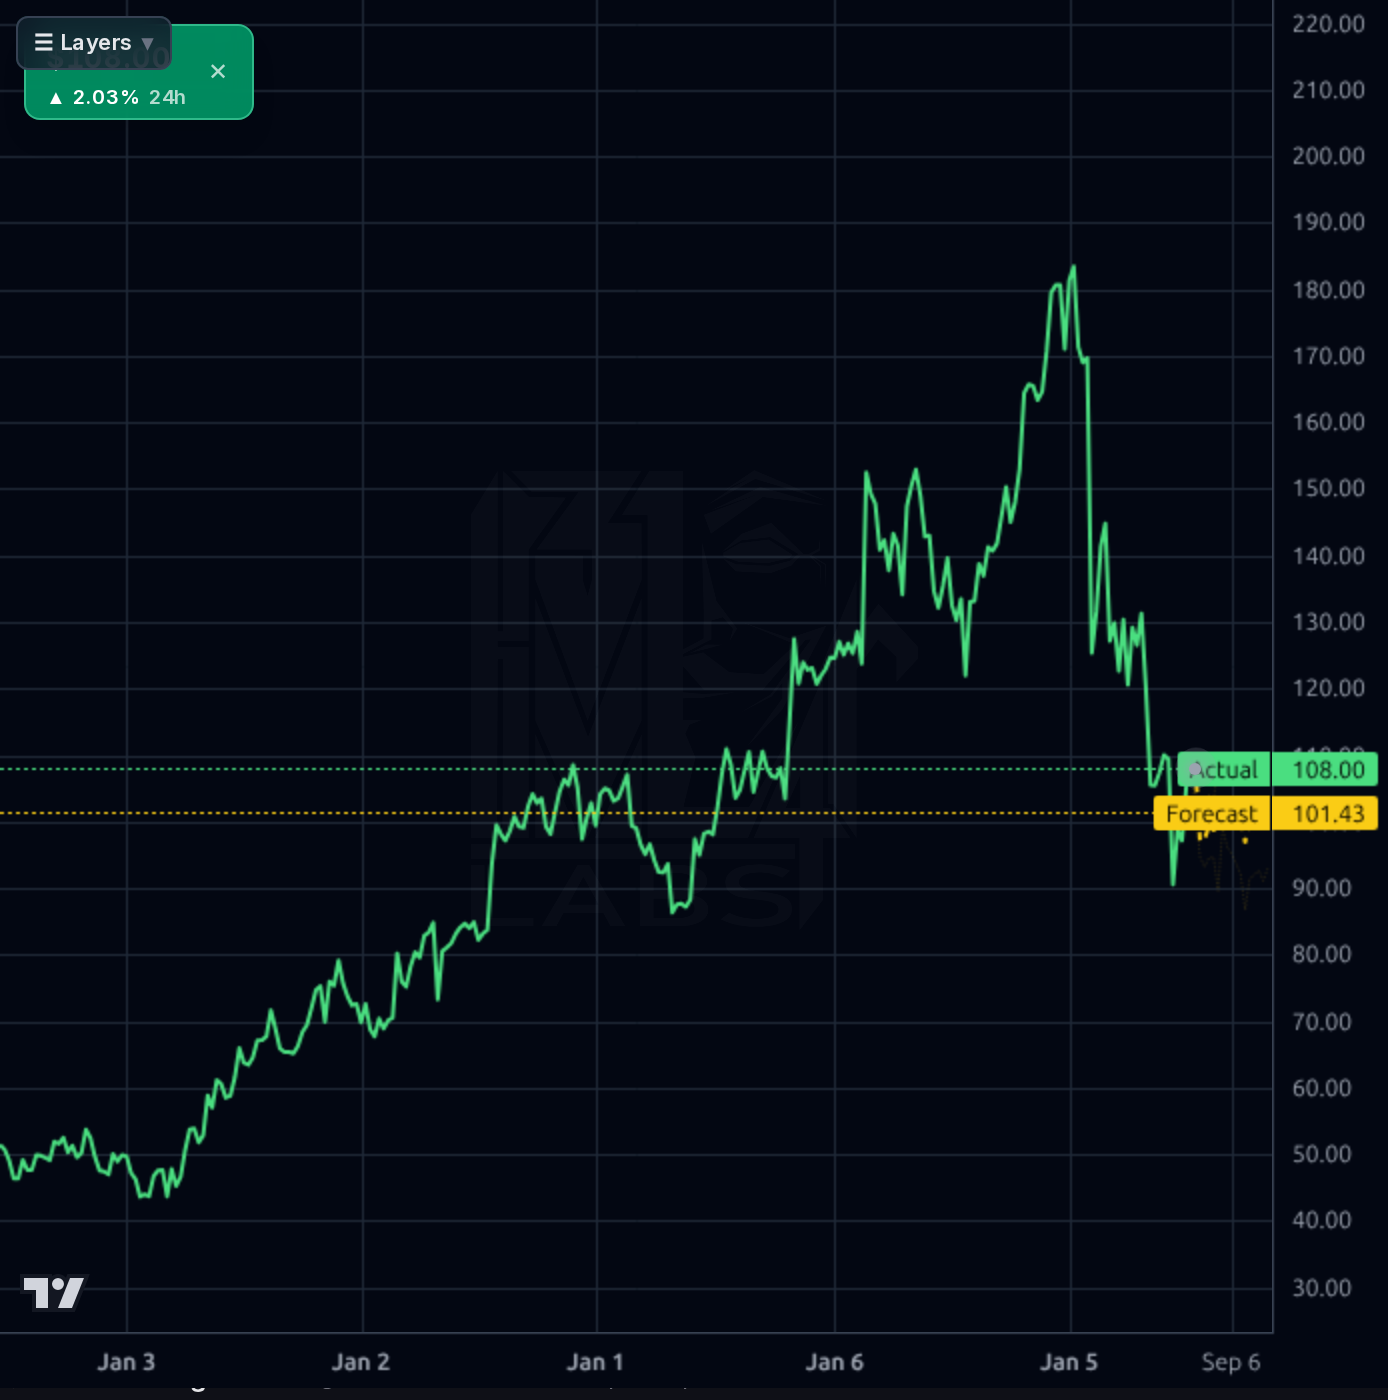
The stock has consolidated near $100 with RSI at 50.23 (neutral), testing key support levels ($95-$100) while the Kronos AI forecast suggests continued upside within a tight band. The 1-week chart shows a 6.36% weekly bounce, indicating short-term momentum. However, the 1-day chart reveals volatility with ATR at 5.68 and price action dominated by balance sheet fears. The model's forecast band (yellow) is currently above actual prices but shows narrowing bands suggesting potential consolidation.
Recent news highlights a 44% undervalued view for HURN, with the stock down 17% over three months despite positive revenue growth. Insider sales and weak quarterly performance have amplified concerns. However, strong operational metrics (23% ROE) and double-digit top-line growth provide a foundation for mean-reversion. The $887M debt surge and Q1 FCF collapse are critical risks that must be addressed before multiple expansion can occur.
Get AI analysis on any stock
This is one of hundreds of Kronos AI reports — scored fundamentals & technicals, bull/base/bear price targets, a multi-horizon plan, and continuously-updated forecasts across the market. Create a free account to explore them all.
Create your free account →Already a member? Sign in · Join our Discord