IBP — AI Stock Forecast & Price Targets
Published 9/4/2026 · A free sample of K3vl4r’s AI-powered analysis.
Kronos price forecasts, scored fundamentals & technicals, and a multi-horizon plan.
View the live IBP price forecast →
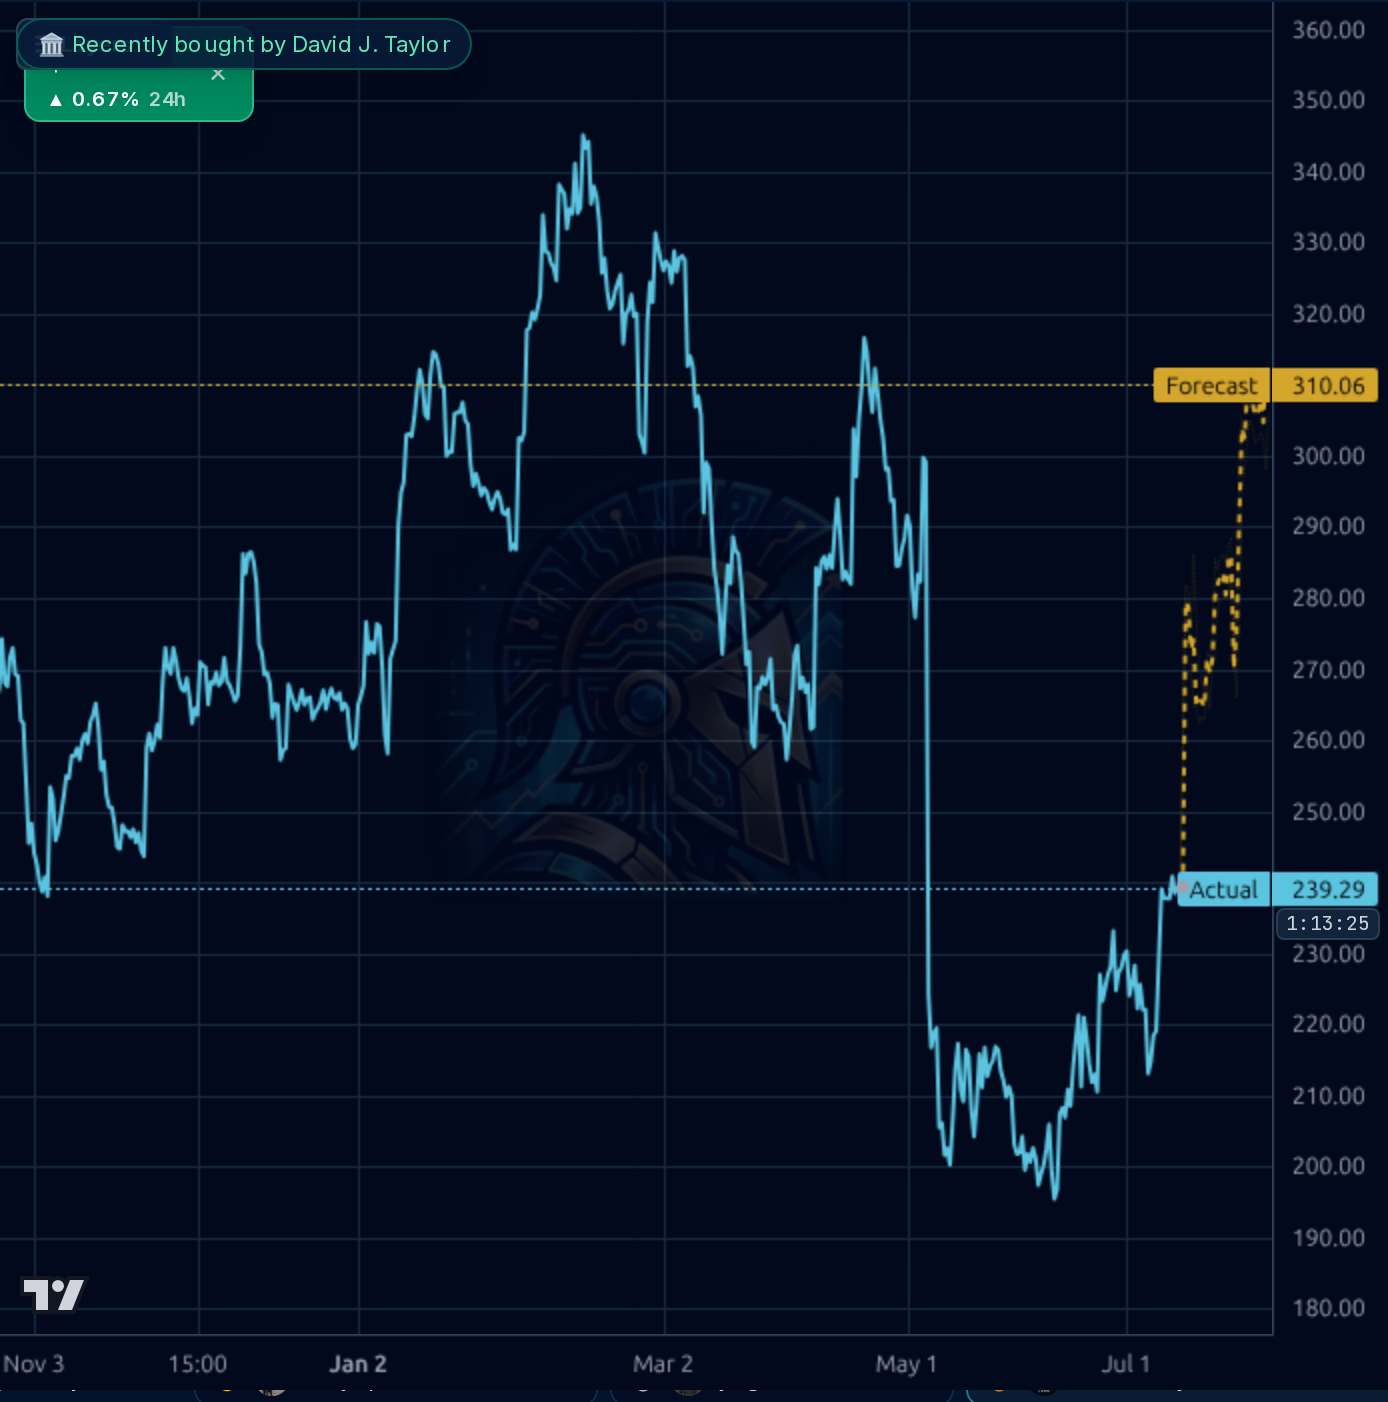
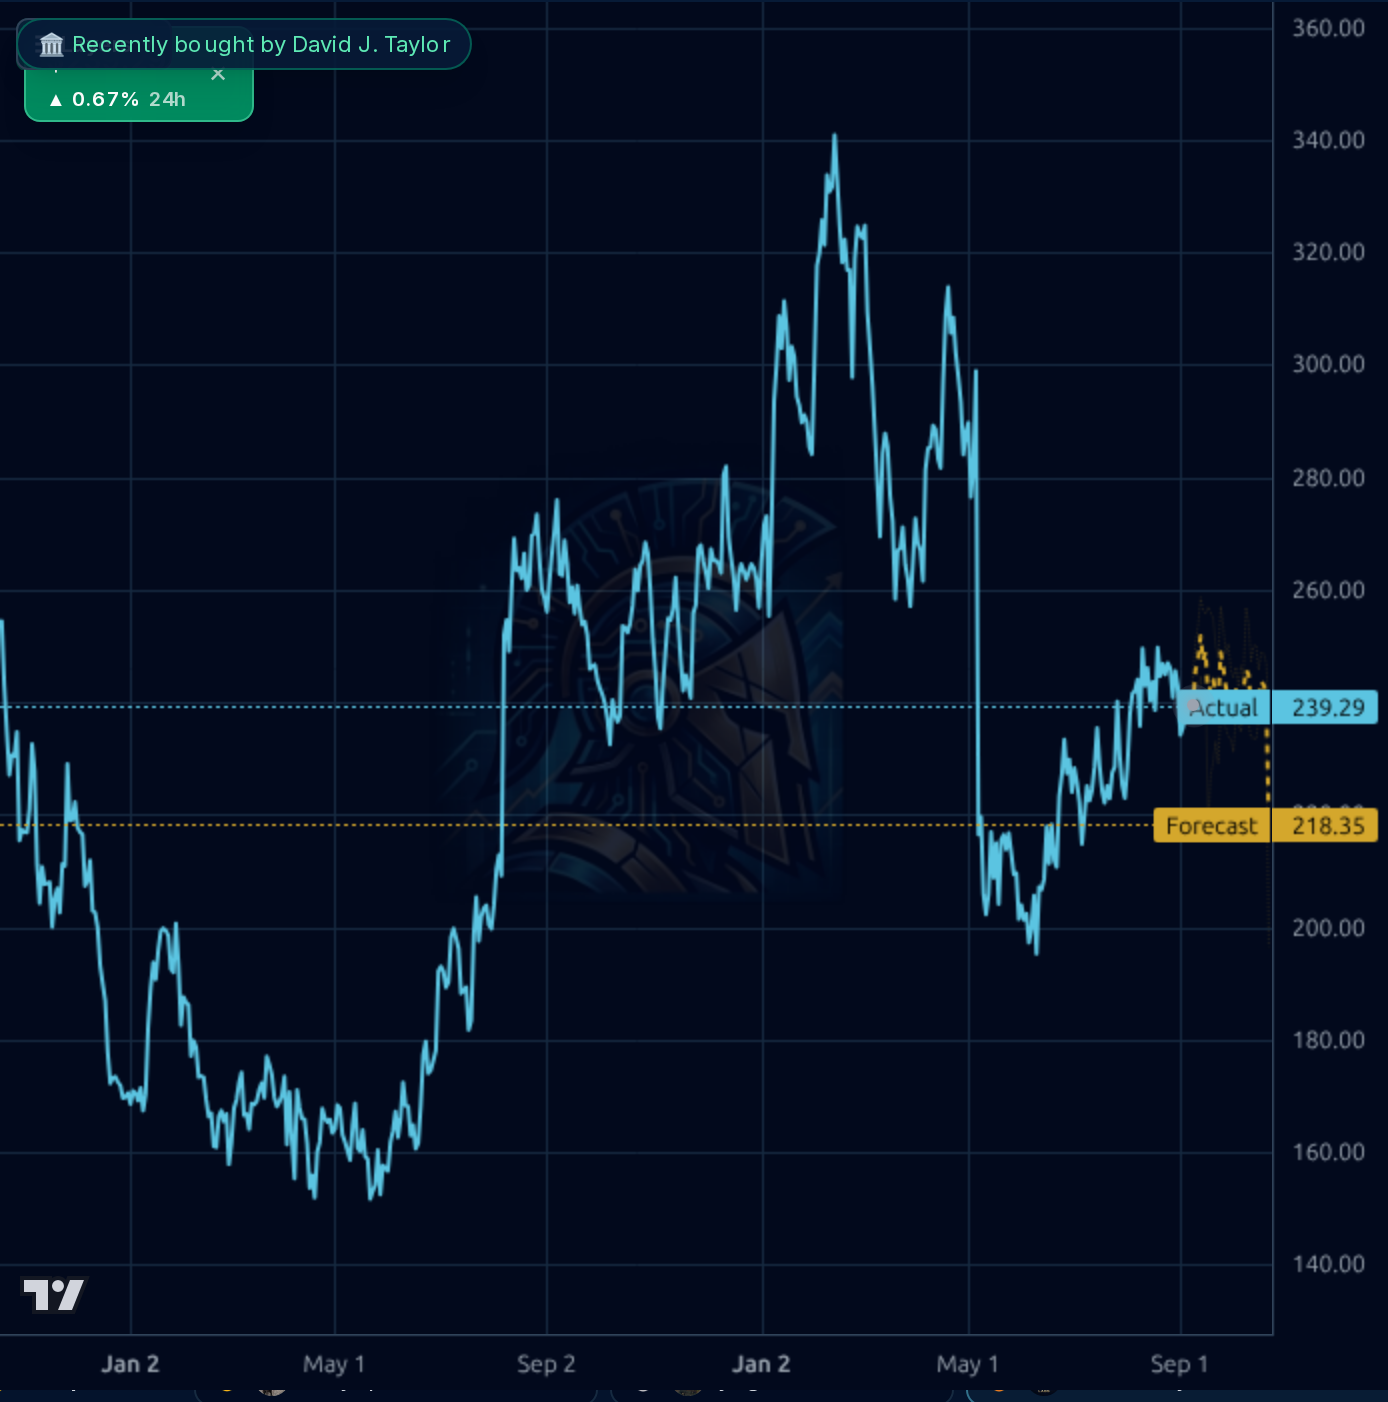
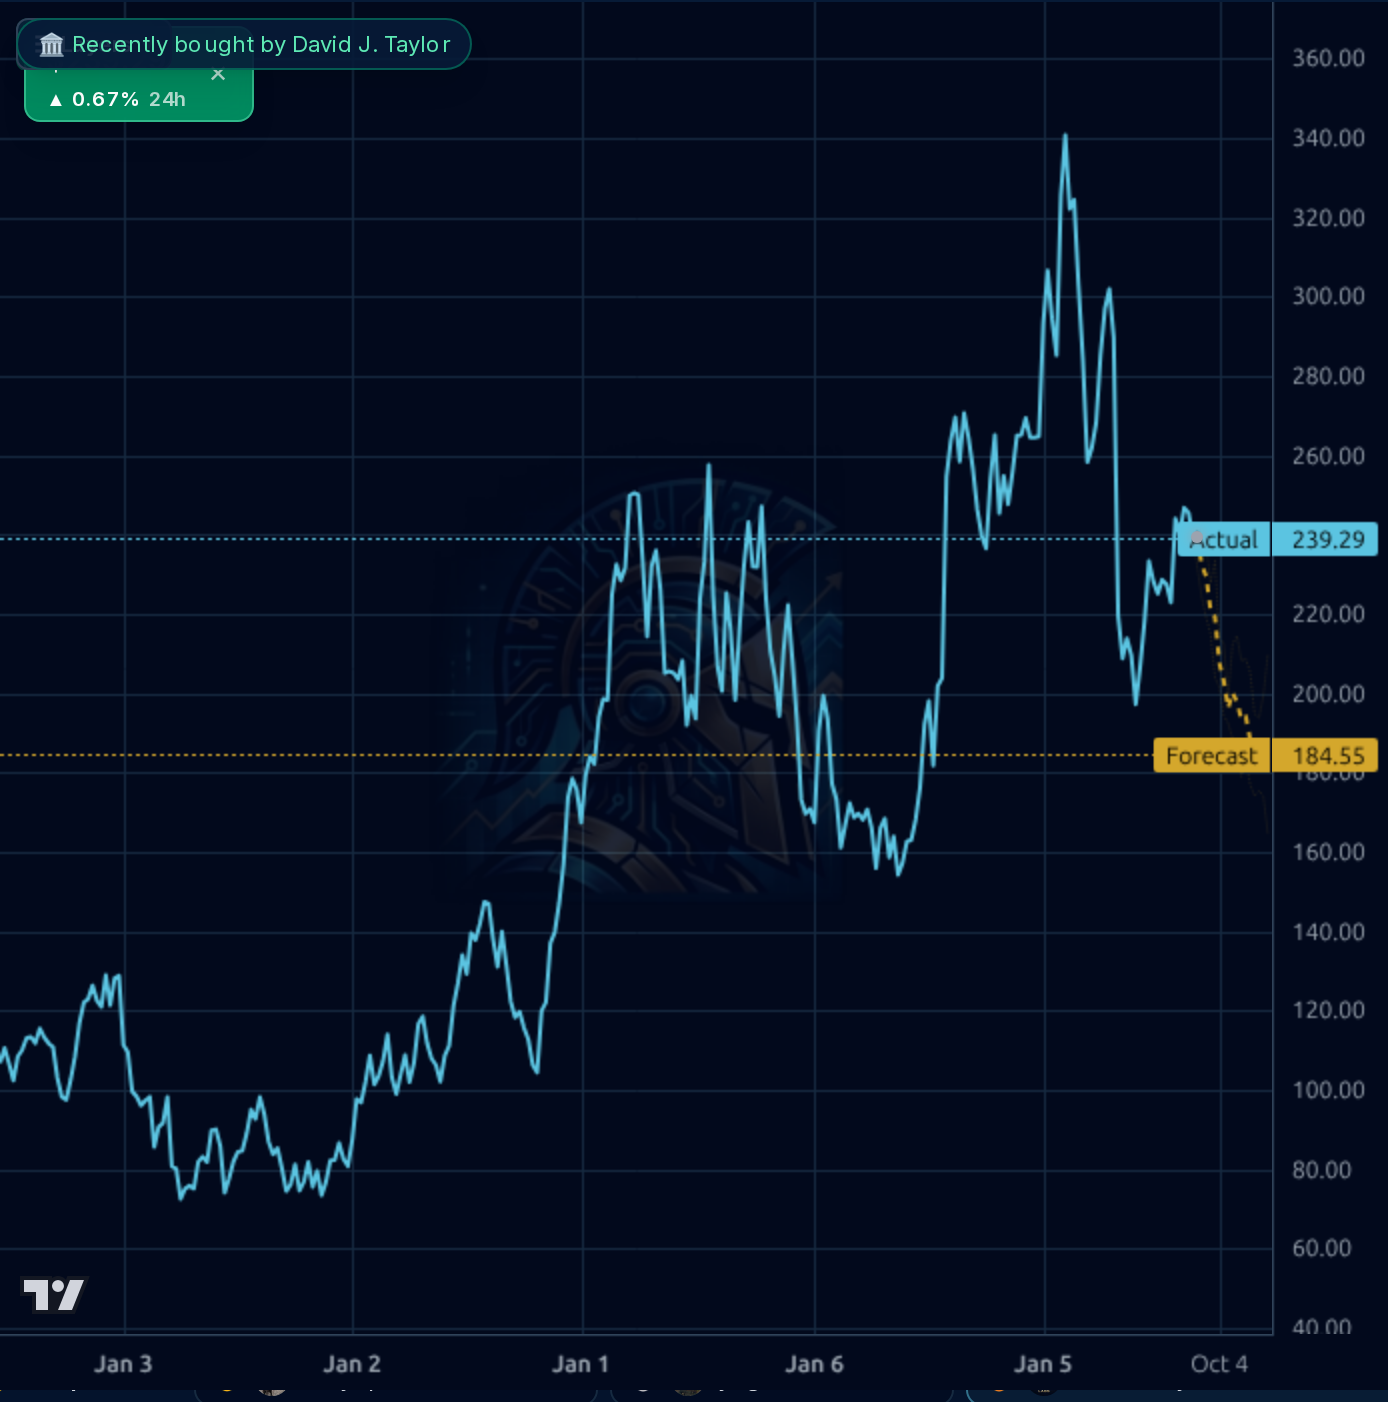
IBP's resilient commercial growth and diversified segments provide a buffer against residential weakness, but stretched valuation (PEG 4.21) and cyclical risks limit near-term upside. The forecast bands suggest potential upside to $244.82, though momentum is fragile amid housing sector headwinds.
Hold near current price ($238.57); invalidation below $230. The 1d forecast accuracy is low, so avoid timing short-term moves. Key catalyst: confirmation of sustained commercial growth in next earnings.
Accumulate if commercial segment continues to outperform residential weakness; target $244.82 (current analyst target). Catalysts include housing policy shifts or improved construction data. Invalidation: persistent residential weakness dragging overall margins below 10%.
Long-term thesis hinges on structural shift in housing demand toward commercial/industrial applications. Biggest risk is prolonged residential weakness limiting growth potential, though diversified segments provide buffer for multi-year stability.
Revenue growth remains modest (Q2 revenue +2.3% YoY) with commercial segment driving resilience (+16% in Q2). Margins are pressured by residential weakness but remain healthy (gross margin 32.22%, operating margin 12.51%). Balance sheet is strong (current ratio 2.98, debt/equity 1.87) with robust cash flow ($289M FCF), though valuation metrics are stretched (PEG 4.21). The company's diversified platform offsets cyclical risks but lacks near-term catalysts to justify current pricing.
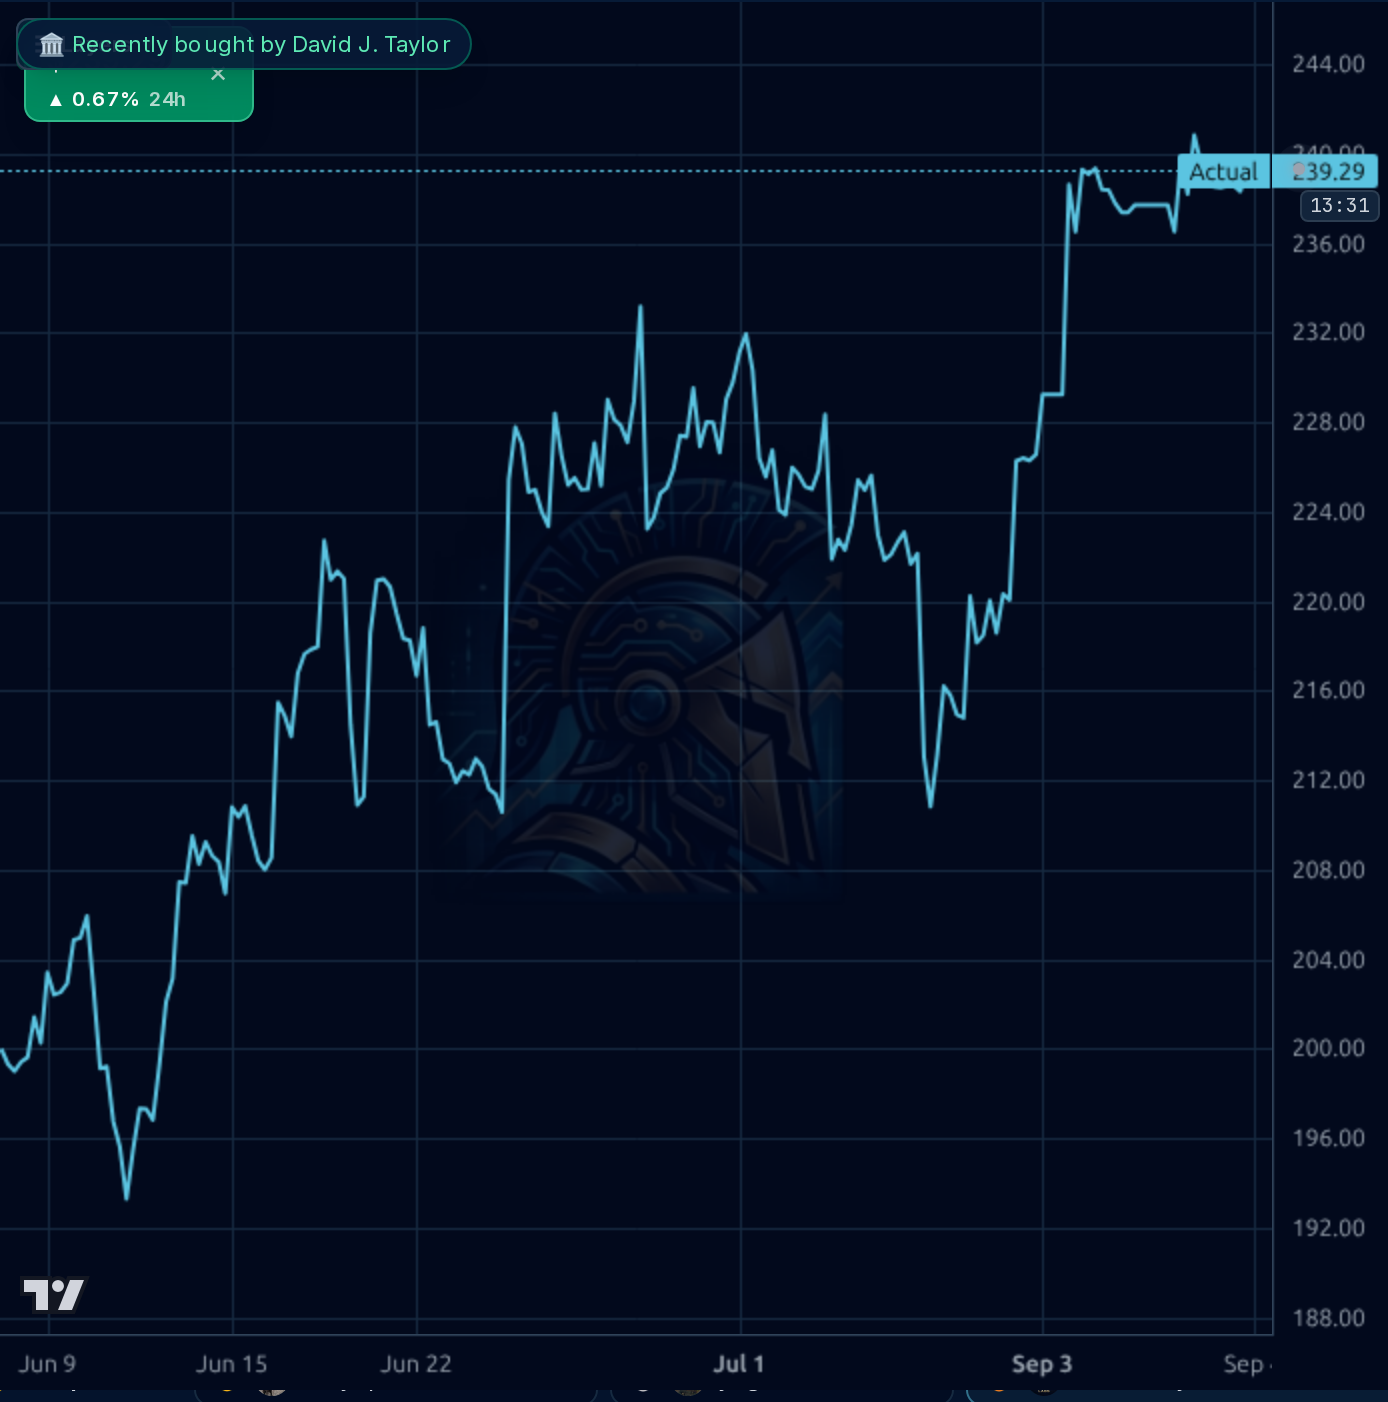
The chart shows a bullish trendline breaking above $230, with recent price action testing resistance at $239.29 (actual) and forecast bands suggesting upside potential to $244.82. However, the 1d forecast accuracy is low (54% directional accuracy vs naive baseline), indicating technical momentum may not sustain without fundamental catalysts. The SMA20 (-1.64%) and SMA50 (+1.92%) suggest short-term weakness but longer-term support at $230-235.
Recent Q2 results showed commercial growth offsetting residential weakness, with revenue up 2.3% YoY. However, the stock has fallen 24.8% over six months amid persistent housing sector headwinds. Analysts remain cautious (current target $244.82), but institutional buying (98.88% ownership) and forecast bands suggest potential upside if commercial momentum continues.
- Commercial segment growth (+16% Q2) driven by data center and industrial installations
- Diversified platform offsetting residential weakness with manufacturing/distribution segments
- Prolonged residential weakness pressuring overall margins below 10%
- Stretched valuation (PEG 4.21) limiting upside without material housing recovery
- Sensitivity to interest rate changes impacting housing affordability
Get AI analysis on any stock
This is one of hundreds of Kronos AI reports — scored fundamentals & technicals, bull/base/bear price targets, a multi-horizon plan, and continuously-updated forecasts across the market. Create a free account to explore them all.
Create your free account →Already a member? Sign in · Join our Discord