IDN — AI Stock Forecast & Price Targets
Published 8/5/2026 · A free sample of K3vl4r’s AI-powered analysis.
Kronos price forecasts, scored fundamentals & technicals, and a multi-horizon plan.
View the live IDN price forecast →
IDN is a high-quality micro-cap SaaS (90%+ gross margins, zero debt, $10M cash) trading at $3.88 after a -50% quarter, with a binary Q2 earnings print in 8 days and a fresh CTO departure adding governance overhang. The fundamental setup remains asymmetric on a 6-12 month horizon, but near-term the setup is a coin flip into a lumpy revenue print, and past bullish targets on this name have systematically failed to print — I'm holding, not chasing.
Do not swing into the Aug 13 print. This name has a documented tendency to sell off into/through earnings, revenue is lumpy, and IV crush is guaranteed. If already long, trim into any rip toward $4.15-$4.30 to reduce binary exposure. Invalidation for any tactical long is a daily close below $3.59; upside is capped near $4.30 pre-print. Flat is a legitimate position here.
1-6 month view is ACCUMULATE on weakness, but only after the Aug 13 print clears the binary. If the print holds mid-single-digit revenue growth and confirms margin sustainability, a re-rate toward $4.80-$5.30 is achievable (that's roughly the model's own 1d forecast level and the volume shelf from May). A miss or soft guide likely drops the stock to $3.20-$3.35 — that's where I'd want to be adding size. What changes my mind: another quarter of negative operating income, further executive departures, or institutional ownership breaking below 40%.
1-3 year thesis rests on IDN converting its genuine SaaS quality (90% gross margin, positive FCF, zero debt) into durable double-digit revenue growth via the logistics/freight fraud vertical and BNPL/fintech penetration. Terminal case is a $25-30M revenue business at 20%+ operating margins, worth $130-180M mkt cap (~$6.50-9.00/share), which is roughly a double from here but far below the peaks retail chased. Biggest structural risk is competitive displacement by larger identity verification incumbents (Socure, Jumio, Onfido) and customer concentration — at $23M revenue the loss of any single top-5 customer is a P&L event.
The business quality is genuinely high: TTM revenue $23.3M with 90.7% gross margins, zero debt, $10.1M cash, and current ratio ~3.0. Operating cash flow ran $4.2M TTM and FCF $3.0M, with Q1 2026 posting $5.5M revenue (+12.9% Y/Y), $542K operating income, and $636K net income — clean margin recovery from the Q2'25 -$251K net loss. However, the lumpiness is glaring: quarterly revenue oscillates $5.1M → $6.0M → $6.6M → $5.5M, and Q4 op margin of 22.5% has already reverted to 9.8% in Q1. Trailing P/E of ~35x and forward P/E ~17-23x are not cheap for a business growing top line 15% Y/Y TTM, though EV/Sales of 2.9x is defensible for a 90%+ gross margin SaaS with 11.4% ROE. Balance sheet gives real optionality (cash is ~13% of market cap), but capital allocation has been passive — no buybacks or dividend, no debt used for growth. Broken items: revenue is not compounding smoothly, and the CTO exit at a 38-person company is a real red flag on execution capacity.
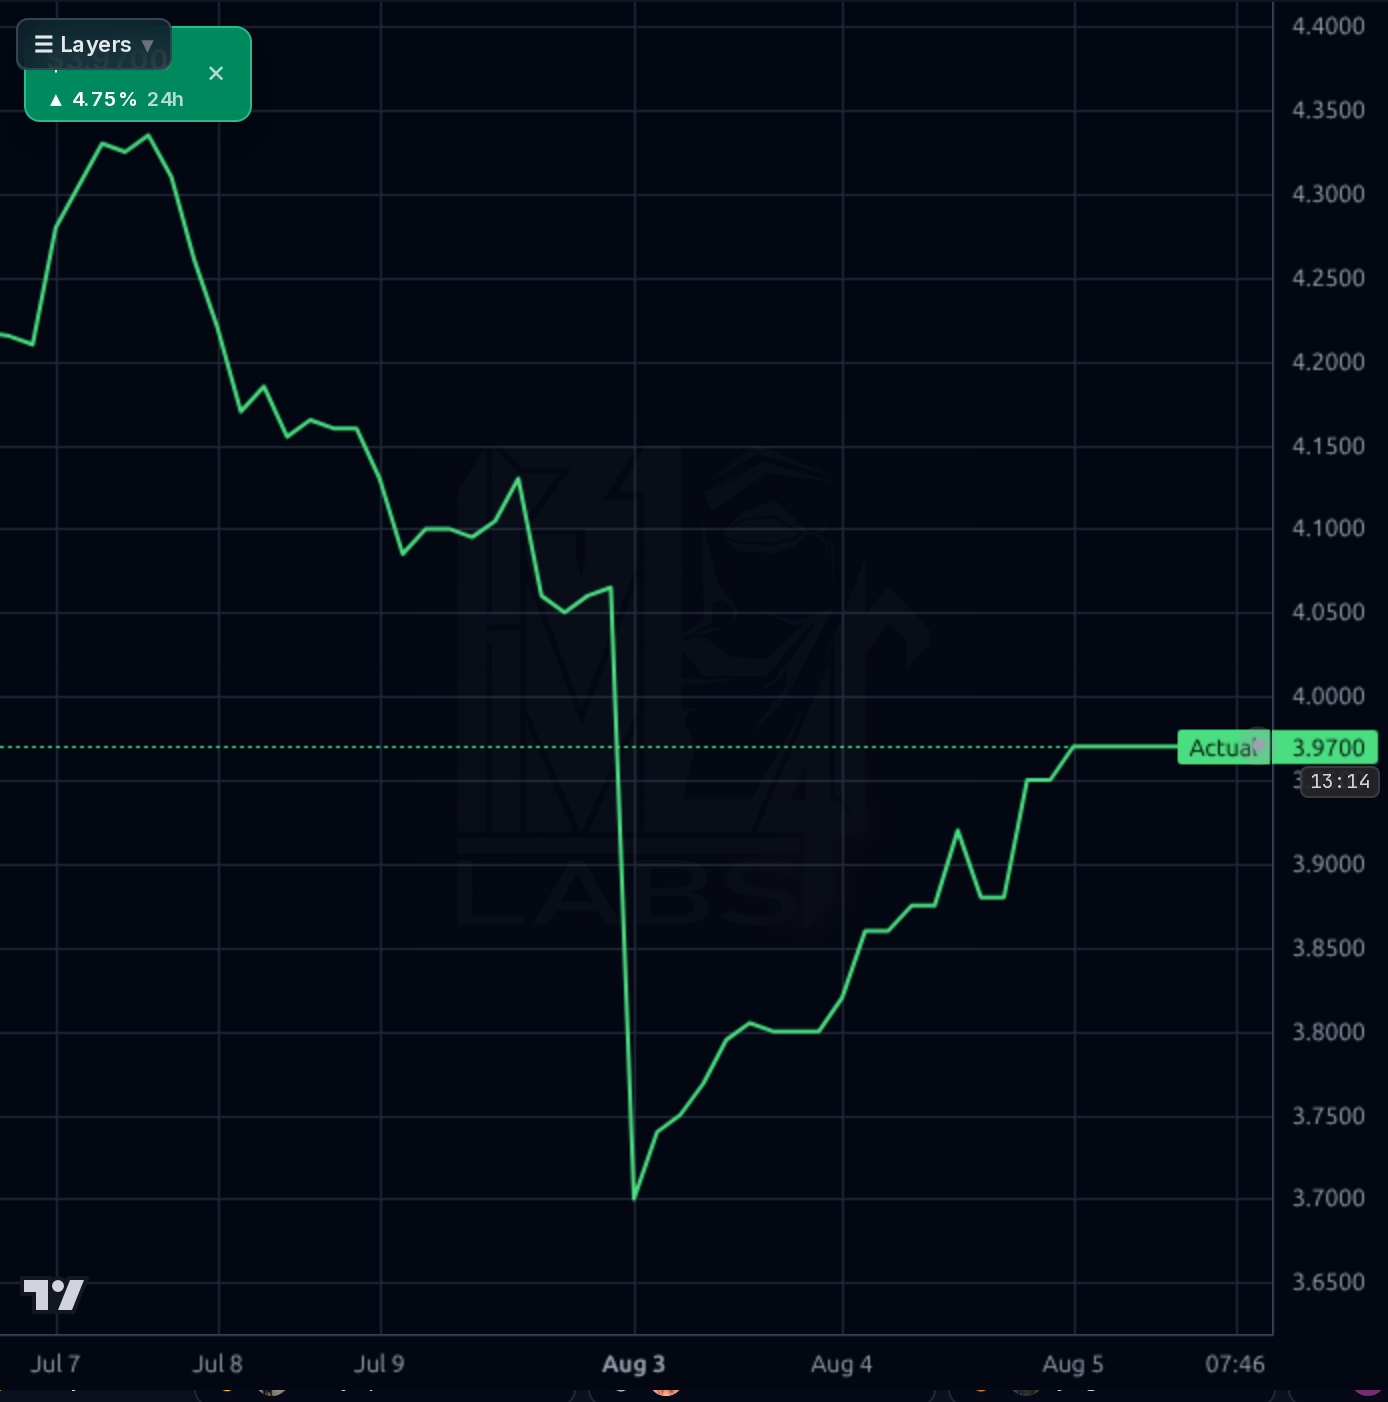
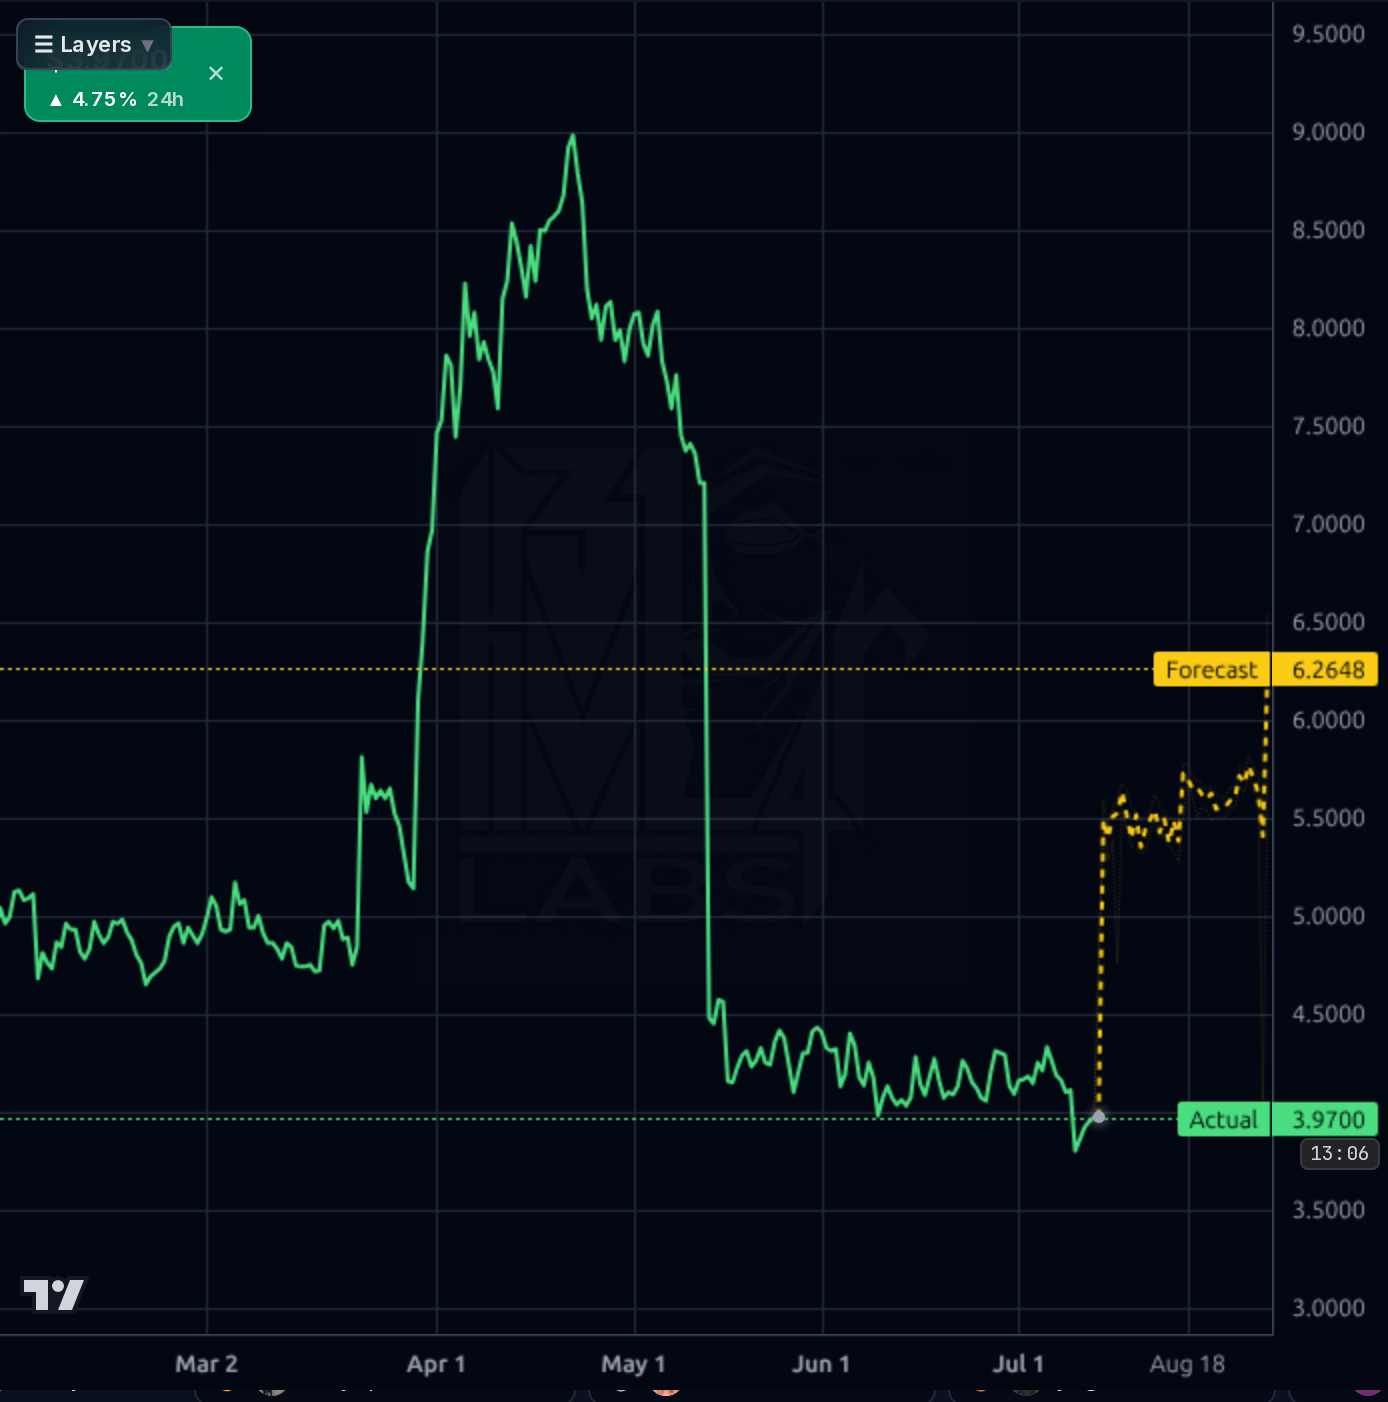
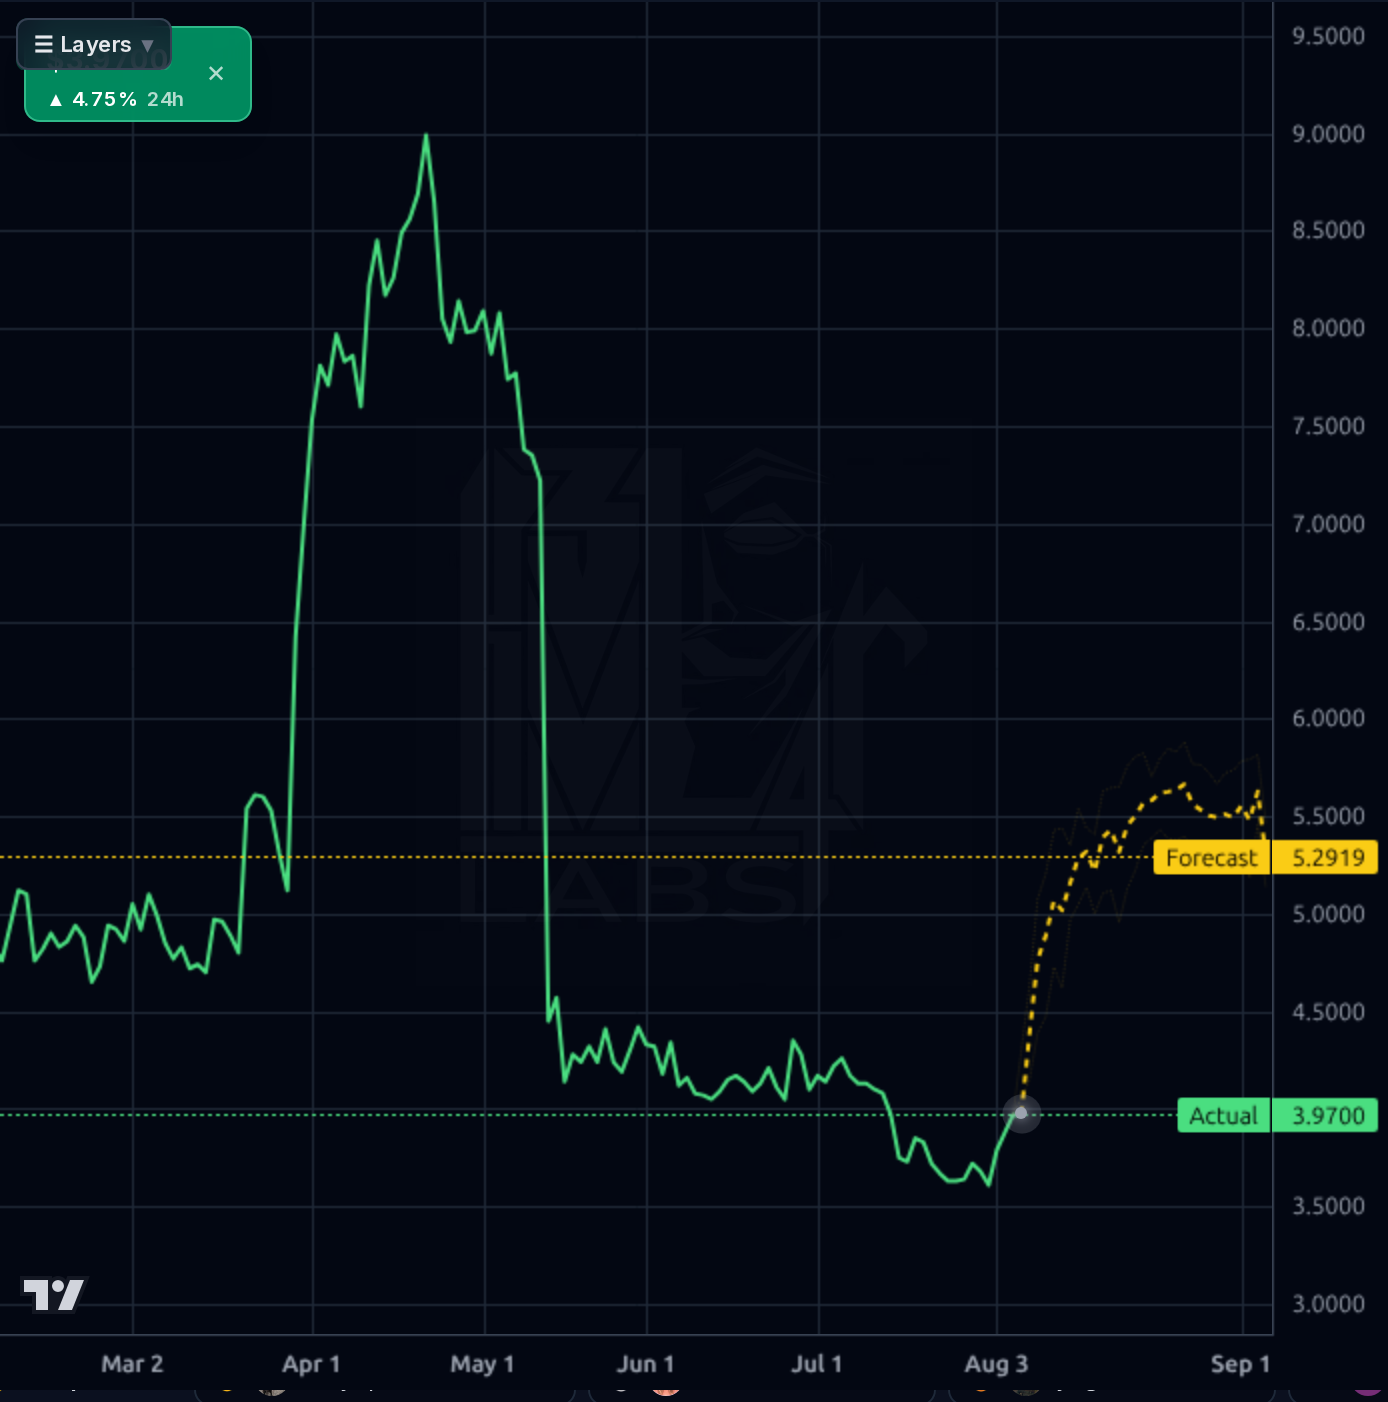
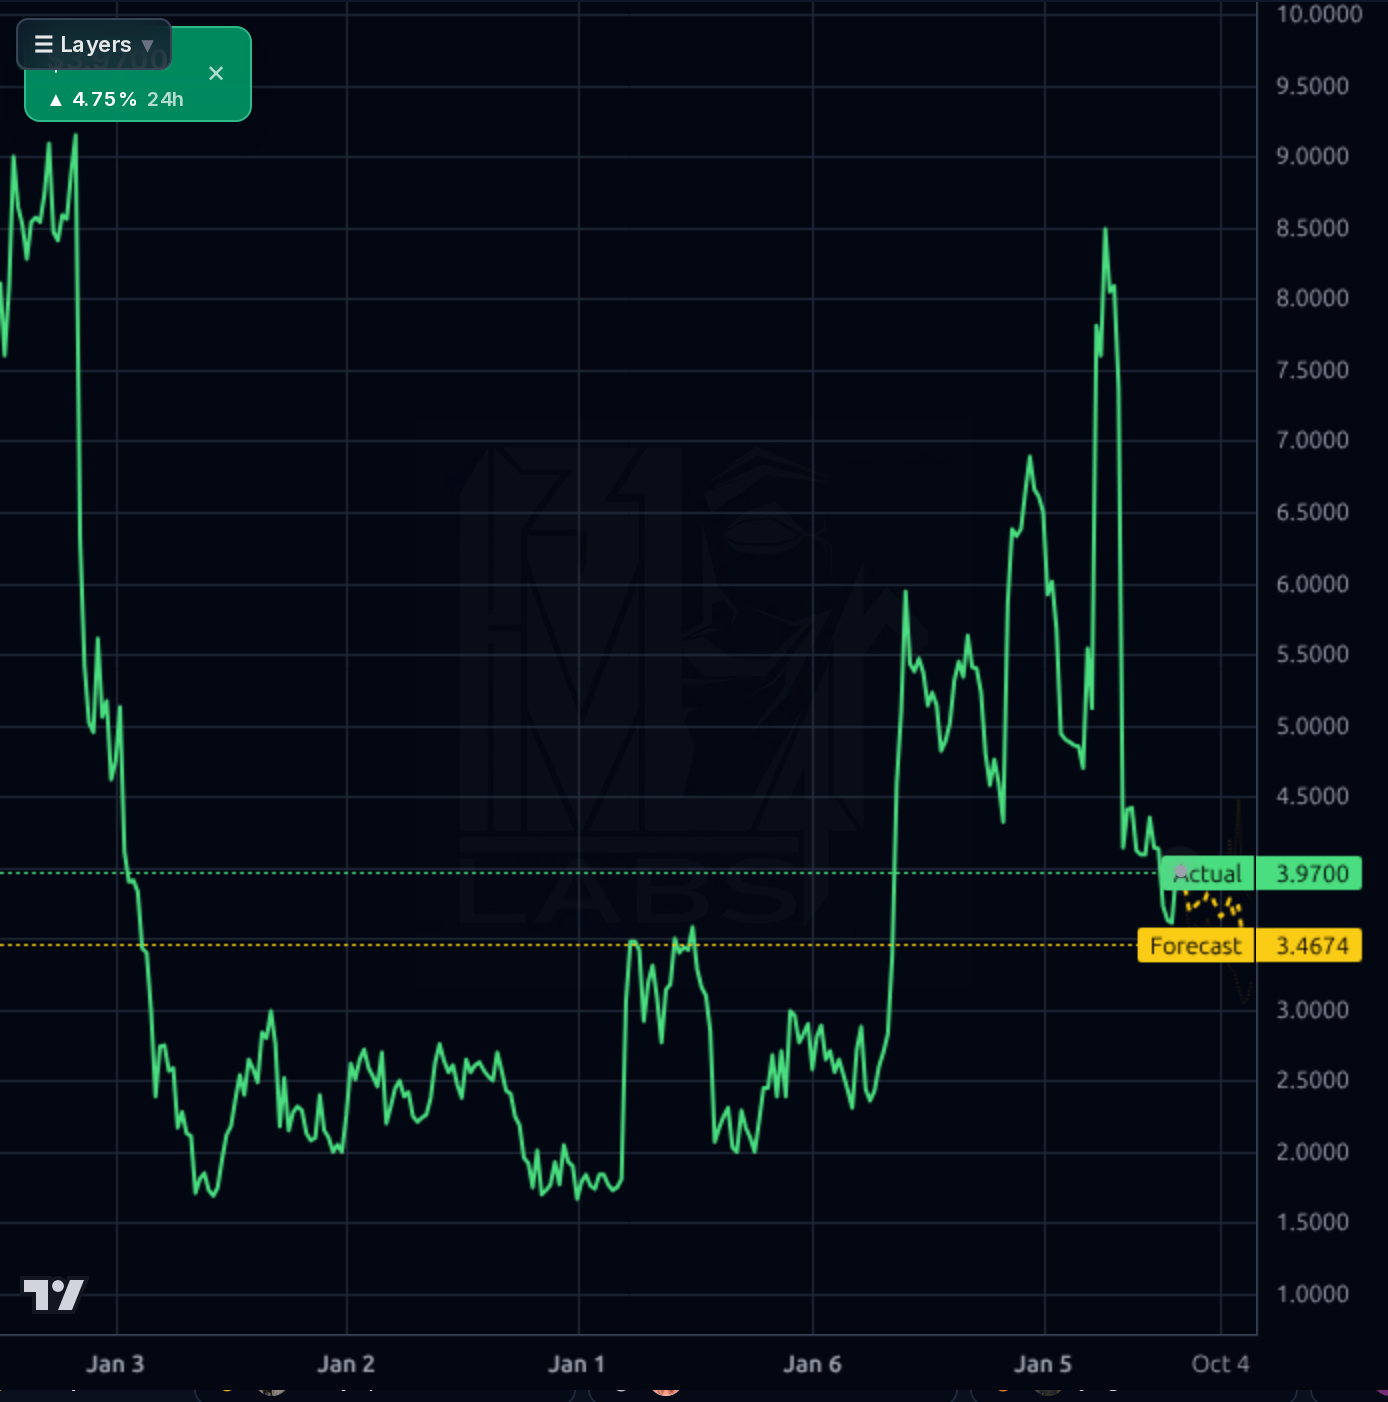
The trend is broken across every timeframe I can see. On the daily, price collapsed from ~$8.50 in mid-April to $3.70 on Aug 3 (-57%), with the SMA200 sitting ~30% above spot. The 1h chart shows a capitulation wick to $3.70 on Aug 3 followed by a mechanical bounce to $3.97 — classic oversold reflex, not a trend change. RSI(14) at 47.8 has worked off the oversold read (was 29.7 three weeks ago) without meaningful price progress, which is a mild negative divergence. Key support is the $3.59 52-week low / $3.70 recent swing; a break there opens $3.35. Resistance stacks at $4.15 (prior consolidation shelf), then $4.60 and the $5.00 gap zone. The AI forecast band shows 4h/1d models projecting $5.29-$6.26 — but the model's realized directional accuracy is 29% at 1d and 33% at 1wk, both worse than a naive baseline, so I'm discounting that upside projection heavily. The pattern that matters: a base is forming, but it hasn't confirmed with a higher high.
Signal: the July 22 8-K disclosing CTO Jonathan Robbins' departure effective Oct 16 for 'personal family reasons' is material at a 38-employee company where four executives just became three, and it aligns with the L2 bearish institutional ownership drop (50.7% → 43.2% on 7/30) before a partial recovery (+4.7pp on 7/31). Short float also stepped up from 4.1% → 6.3% in mid-July. Bylaw amendments on 7/23 are routine. Noise: The single 'IDN' news article about fake IDs is thematically supportive of the identity-verification narrative but is not a company-specific catalyst. Retail sentiment on Stocktwits/X is 80% bullish among tagged messages but the sample is tiny (5) and dominated by 'bought hoping for higher lows into ER' — that's exactly the crowded pre-earnings positioning that historically gets punished on this name.
- Logistics/freight fraud vertical expansion — reinforced by the FreightWaves coverage of CEO Bryan Lewis discussing cargo-theft use cases; a differentiated TAM lane vs. legacy retail/banking
- Margin scalability at current revenue — Q4'25 hit 22.5% operating margin, proving operating leverage exists even if Q1 reverted
- Balance sheet optionality — $10M cash / zero debt at $78M market cap enables buybacks or bolt-on M&A without dilution
- Passive flow tailwind from RUT membership (confirmed in market snapshot) providing structural bid support on weakness
- Q2'26 earnings on Aug 13 as the near-term proof point on SaaS revenue durability and executive-transition impact
- CTO Jonathan Robbins departure at a 38-person company — real execution/product-continuity risk, no announced replacement
- Binary Aug 13 earnings print into an already broken chart with lumpy revenue history (Q4→Q1 op income collapsed from $1.49M to $542K)
- Institutional ownership volatility (-7.5pp then +4.7pp in two days) and rising short float 4.1%→6.3% signal disagreement and crowding on the short side
- Historical calibration on this name: prior base targets sit +20% above realized price on average — upside forecasts on IDN systematically over-shoot
- Micro-cap liquidity (avg volume 443K, market cap $78M) amplifies both directions and makes stops unreliable through the print
- Competitive displacement risk from larger identity-verification platforms with better distribution
Get AI analysis on any stock
This is one of hundreds of Kronos AI reports — scored fundamentals & technicals, bull/base/bear price targets, a multi-horizon plan, and continuously-updated forecasts across the market. Create a free account to explore them all.
Create your free account →Already a member? Sign in · Join our Discord