INTU — AI Stock Forecast & Price Targets
Published 7/16/2026 · A free sample of K3vl4r’s AI-powered analysis.
Kronos price forecasts, scored fundamentals & technicals, and a multi-horizon plan.
View the live INTU price forecast →
INTU trades at $279.70, down ~66% from its 52-week high of $813.70, with a forward P/E of ~10.2x and PEG of 0.66 despite 47% operating margins, 22.5% ROE, and $5.2B in TTM FCF — a valuation dislocation vs. a still-intact franchise. Technicals remain broken (-42.8% vs SMA200, -55.9% half-year) but base is forming near $252-$270 and the stock is now +2.8% on the week with RSI 46.9. Earnings on Aug 20 is the pivotal binary; ACCUMULATE cautiously into weakness, size for the print.
1-4 weeks: The Aug 20 earnings print is ~35 days out — this is the dominant risk. Do NOT build a full position into the binary. Tactical plan pre-earnings: nibble accumulation in the $270-$278 zone with a hard invalidation on a daily close below $252 (52W low). Upside scan into the print $296 then $310-$315 gap-fill; trim any tactical add on a spike to $310+. Earnings stance: neutral-to-cautiously-constructive but explicitly NOT sizing for the gap — a guide-down could easily print sub-$240; a guide-in-line with FY27 EPS reaffirmation could re-rate to $340-$360 quickly. Hold core dry powder for post-print reaction.
1-6 months: Thesis is a valuation-driven mean reversion in a high-quality compounder. At 10.2x forward EPS of $27.34 the stock is priced for a growth breakage that fundamentals (47% op margin, +15% TTM revenue, +34% TTM EPS) do not yet corroborate. Expected return range if the Aug print is not a disaster: +25% to +45% over 6 months as the multiple normalizes toward 13-15x forward. Catalysts: FY27 guide, TurboTax tax-season commentary, Credit Karma monetization update, potential dividend raise, buyback activity. What would change my mind: FY27 revenue guide < +8% Y/Y, operating margin compression below 42%, or a Credit Karma writedown.
1-3 years: Terminal thesis intact — INTU is the dominant SMB financial-OS (QuickBooks) with a durable consumer tax franchise (TurboTax) and an optionality asset (Credit Karma) that finally has a profitable path via QuickBooks cross-sell. Multi-year drivers: AI-augmented assisted tax/bookkeeping (higher ARPU), international QuickBooks/Mailchimp expansion, price/mix in the mid-market. Biggest structural risk: agentic-AI disintermediation of tax prep (free/near-free LLM-driven filing) and small-business bookkeeping — this is the real reason the multiple compressed and it is not going away. A secondary risk is IRS Direct File expansion. If AI turns out to be a headwind rather than a tailwind, the stock is a value trap at any multiple.
The underlying business remains elite despite the tape. FY TTM revenue is $20.92B (+15.1% Y/Y), with the seasonally huge Apr-2026 quarter delivering $8.56B revenue, $4.02B operating income (47.0% margin), and $3.06B net income. Gross margin sits at 80.8% and TTM ROE at 22.5% / ROA 12.1% / ROIC 17.2% — those are enterprise-software best-in-class numbers. Cash generation is exceptional: TTM operating cash flow $7.89B and FCF $5.23B on just $173M capex, implying a ~7% FCF yield at today's $76.5B market cap and P/FCF of 9.9x. Balance sheet is comfortable — $6.78B cash vs $6.90B total debt (net debt essentially zero), current ratio 1.45, D/E 0.33. Capital allocation continues to fund a $4.80 dividend (30% payout, yield 1.72%, 15% 3Y growth rate). What's working: Global Business Solutions/QuickBooks and Credit Karma monetization, EPS Q/Q +11%, EPS Y/Y TTM +33.7%. What's broken (or perceived as such): the FY-guidance reset that accompanied a 17% workforce cut, forcing a growth-outlook derating; forward EPS of $27.34 vs trailing $16.22 implies management/street still expect a big rebound, but the market clearly does not trust it yet.
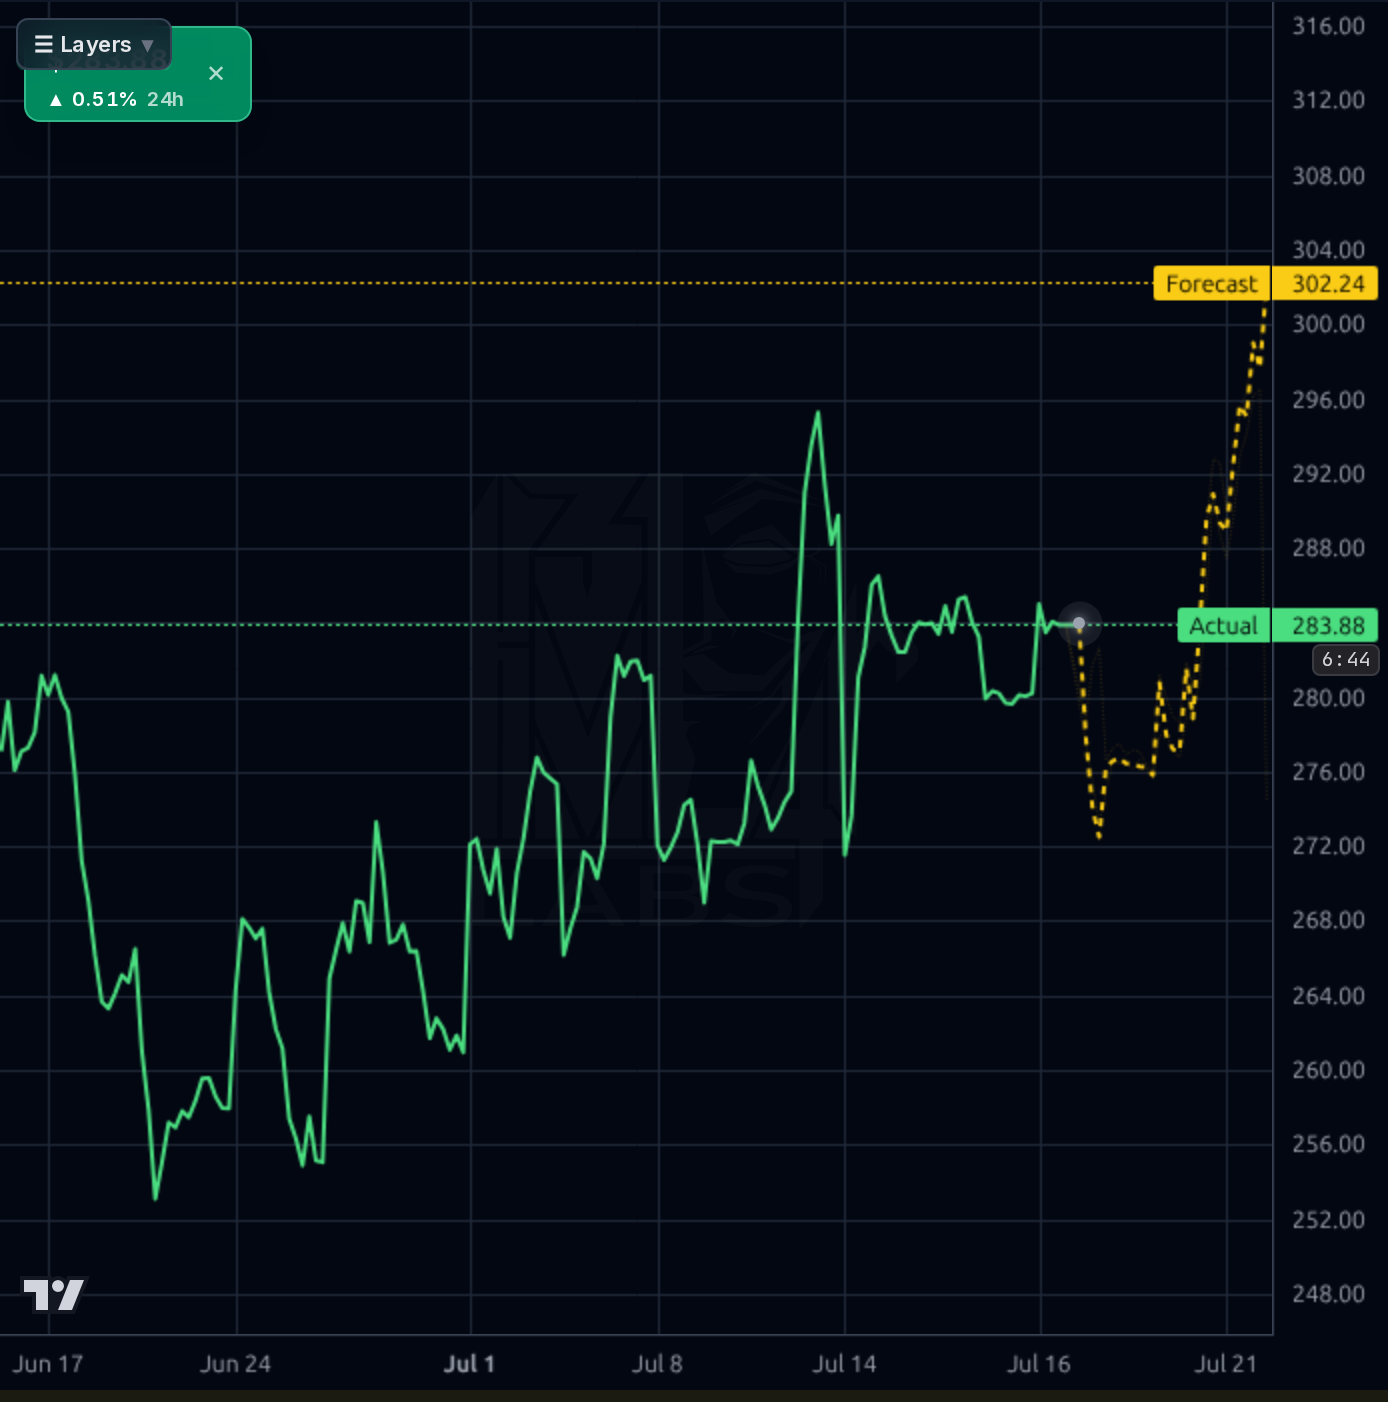
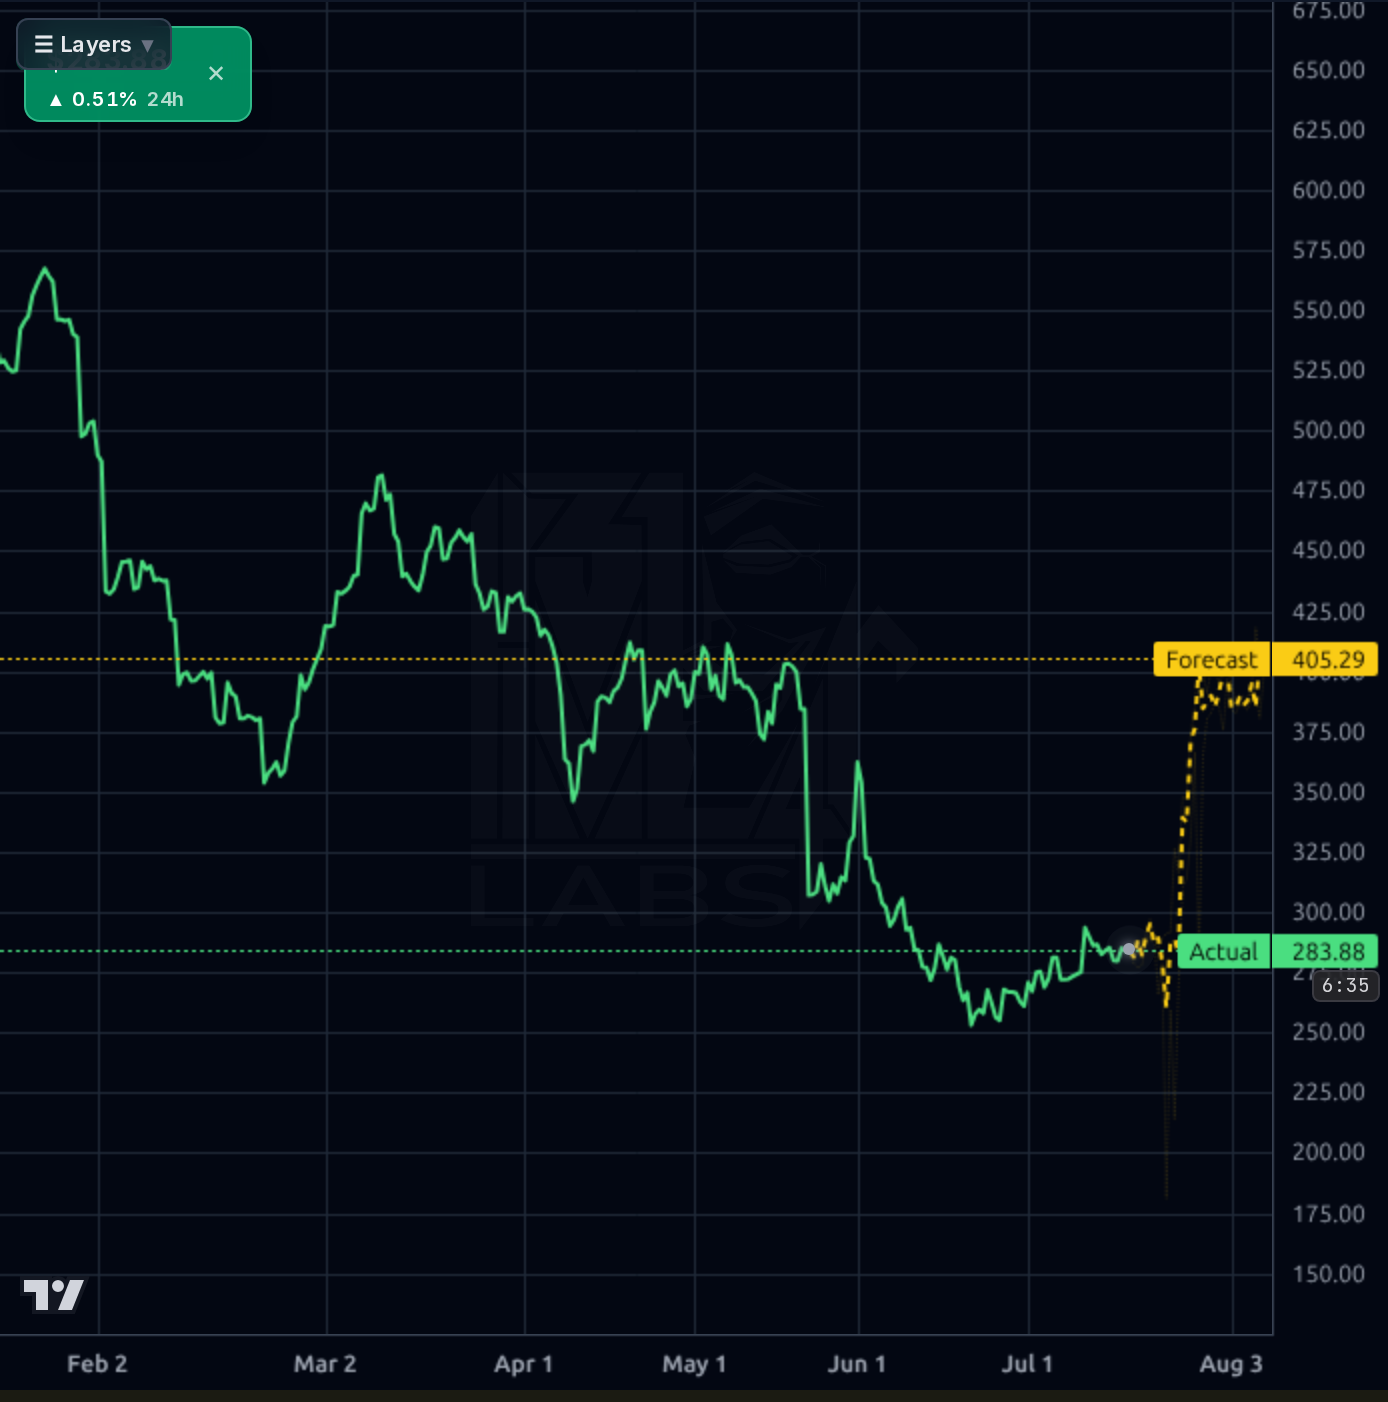
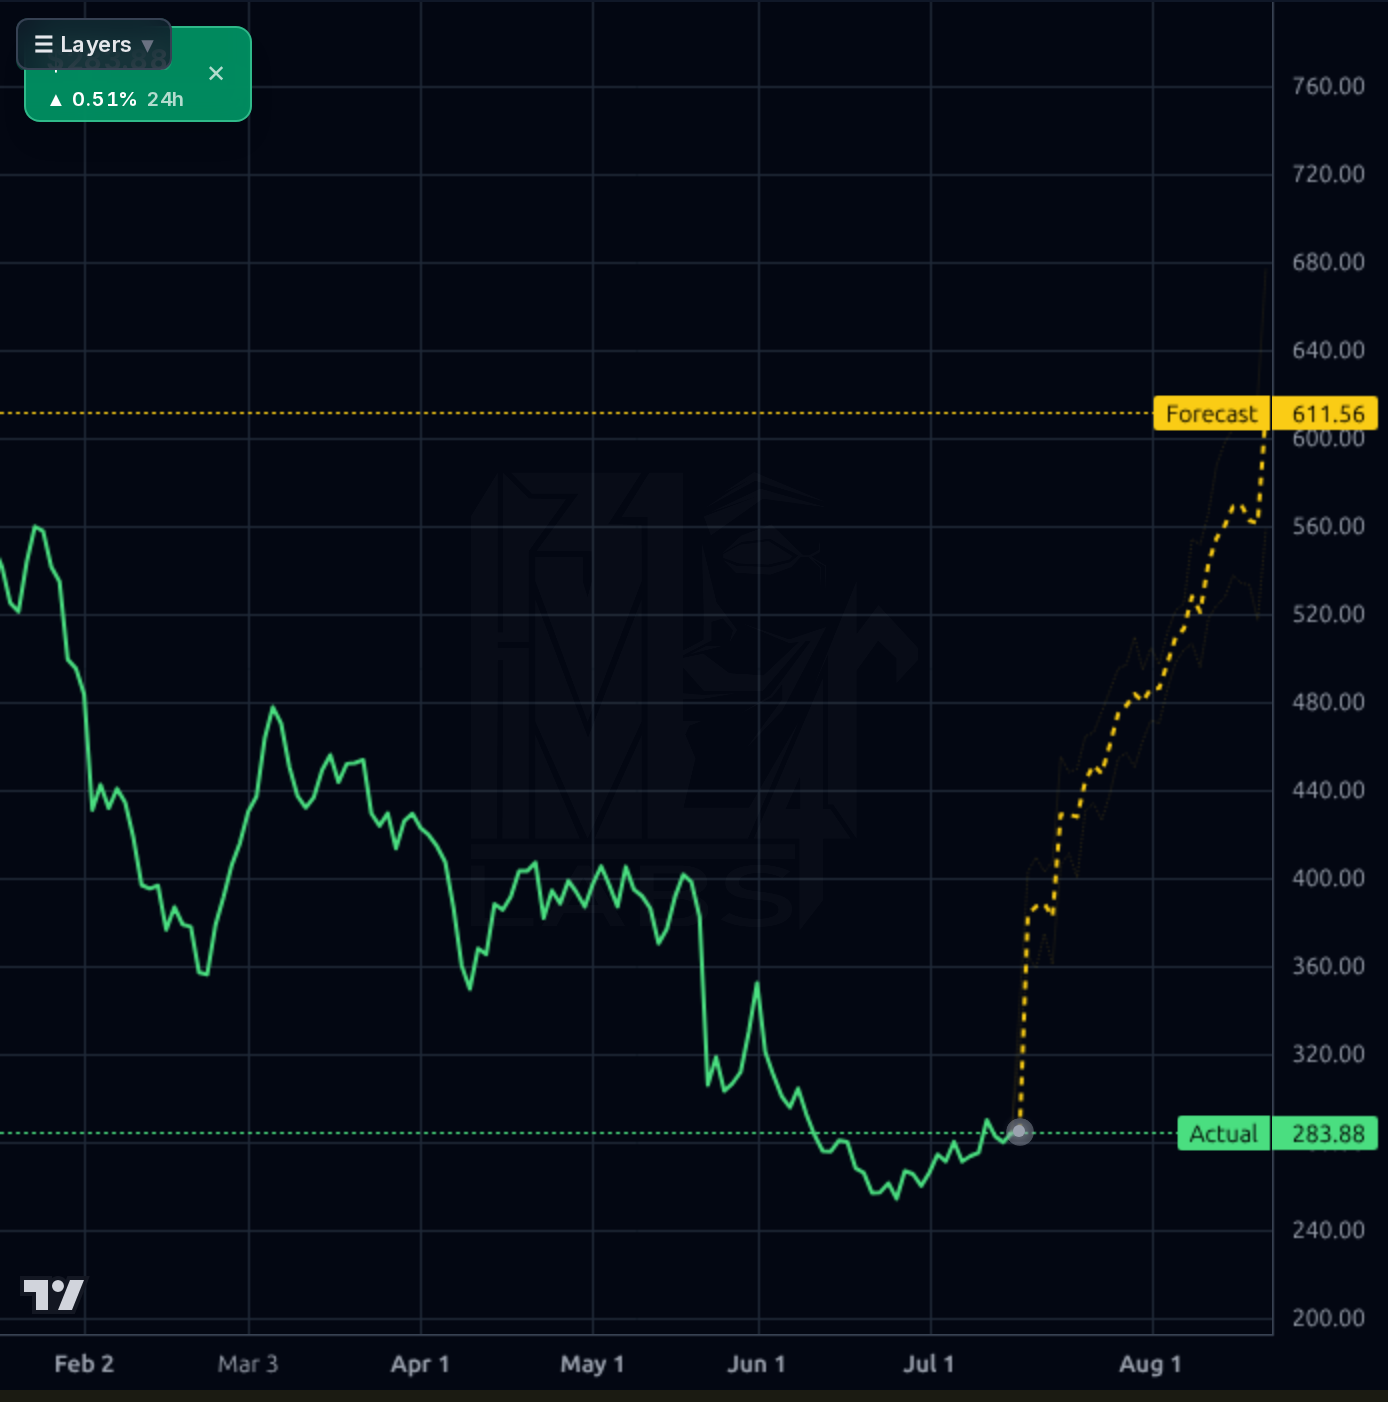
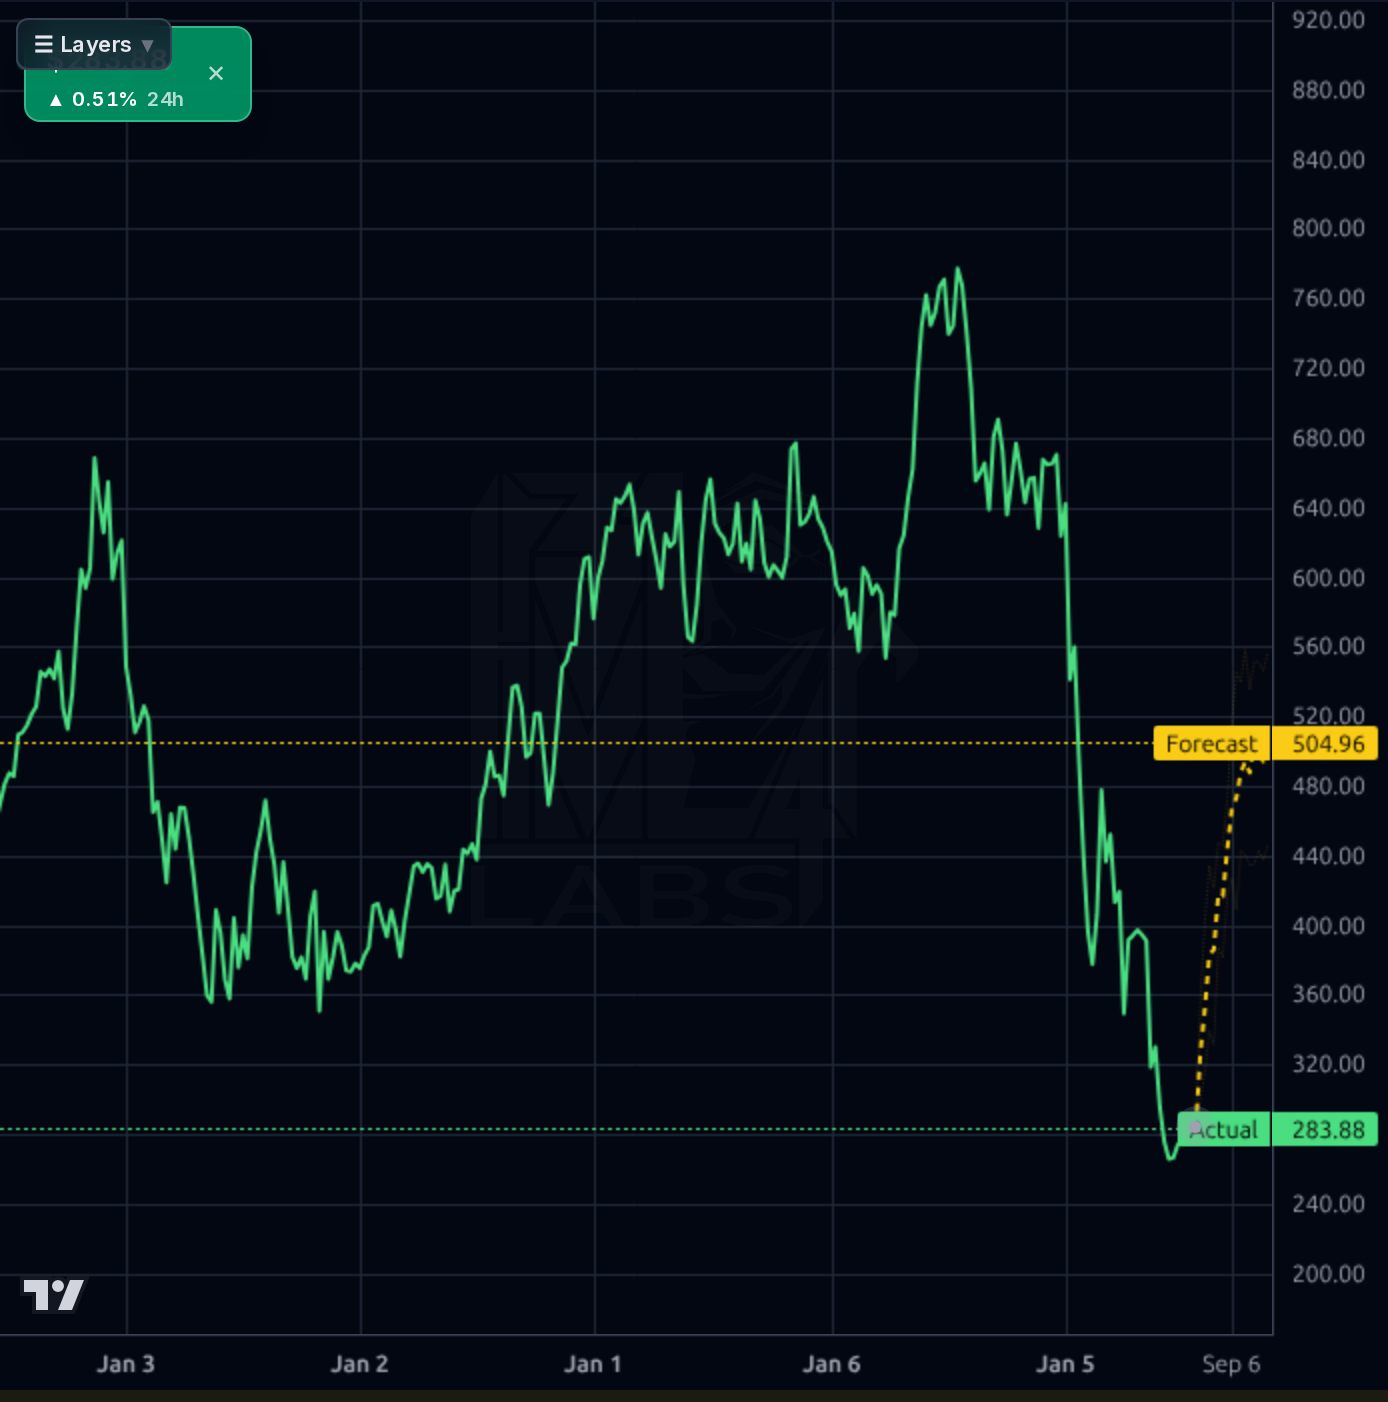
The multi-timeframe picture is a broken uptrend attempting to base. On the 1W chart, price collapsed from ~$770 to $253 in roughly two months — a violent, high-volume break. The 1D chart shows a low near $252 in early July with a modest bounce to $279.70 (+10.6% off the 52W low), still -42.8% vs SMA200 and -11.0% vs SMA50 — momentum trend is decisively down. On the 4H/1H, price is chopping in a $272-$296 range with a recent higher-low structure and Actual holding the dotted support at ~$283.88; RSI 46.9 is neutral, leaving room either way. The model's forecast is unusually aggressive: 1H points to $302, 4H to $405, 1D to $611, 1W to $505 — the internal spread ($405 vs $611 vs $505) itself signals low confidence, and calibration data shows base-case targets from prior reports currently sit ~51% above spot (systematically optimistic). I therefore treat the yellow bands as directional (up-biased) rather than magnitude-accurate. Key levels: support $270 then $252.84 (52W low, must hold); resistance $296 (mid-July high), $310-$315 (gap fill / prior consolidation), $360 (June breakdown pivot).
Signal: A cluster of Zacks upgrades within the last 24 hours — Zacks Rank moved to #2 (Buy), a 'Solid Growth Stock: 3 Reasons' piece, an ABR-consensus Buy note, and a value comparison against MSFT — indicates the sell-side is starting to warm again after the Stifel downgrade that helped catalyze the drawdown. That is a sentiment inflection, not new fundamental information. Noise: the marketing-automation industry list is not a stock-specific catalyst. There are no fresh product, guidance, or M&A headlines. The bigger unresolved catalyst is the Aug 20 fiscal Q4 print, which will re-anchor FY27 guidance and either validate the 17% headcount cut as margin-accretive discipline or confirm the growth deceleration bears fear. Congressional disclosures show two small sells in April (both < $50k range) — negligible signal. Retail sentiment on Stocktwits is uniformly bullish (100% bullish tags, though sample size is small at 9), which is a mild contrarian caution flag rather than a driver.
- Post-restructuring margin re-acceleration: the 17% workforce reduction should show up as operating-margin leverage in FY27 — Q3 already ran at 47% operating margin
- Forward EPS of $27.34 vs TTM $16.22 (+69%) implies management/consensus still expects a material earnings rebound in FY27
- Credit Karma cross-sell into QuickBooks and TurboTax customer bases — segment is the swing factor for group growth
- AI-assisted QuickBooks Live and TurboTax Live tiers offer ARPU expansion at high incremental margin given 80.8% gross margin structure
- Capital return: 30% payout ratio + 15% 3Y dividend CAGR + net-cash balance sheet supports continued buybacks at a ~10x forward multiple
- Aug 20 earnings is binary — a soft FY27 guide could send price to test $240 or lower given already-broken technicals
- Secular AI disintermediation risk to TurboTax (LLM-driven free tax prep) and QuickBooks (agentic bookkeeping) — the core reason for the multiple compression
- -65.6% from 52W high, -57.8% YTD, -42.8% vs SMA200: momentum is decisively broken and mean-reversion setups can chop for 6-12 months before resolving
- Forecast model is running systematically optimistic — prior base targets sit +51% above spot on average; do not anchor to yellow-line upside
- Insider ownership only 2.18% and two recent congressional sells (small) — no notable insider buying to signal management's own confidence at these levels
- Retail sentiment is 100% bullish in a broken stock — classic contrarian caution flag on positioning
Get AI analysis on any stock
This is one of hundreds of Kronos AI reports — scored fundamentals & technicals, bull/base/bear price targets, a multi-horizon plan, and continuously-updated forecasts across the market. Create a free account to explore them all.
Create your free account →Already a member? Sign in · Join our Discord