IOT— AI Stock Forecast & Price Targets
Published 7/2/2026 · A free sample of K3vl4r’s AI-powered analysis.
Kronos price forecasts, scored fundamentals & technicals, and a multi-horizon plan.
View the live IOT price forecast →
Samsara is a genuine ~30% growth SaaS story that just crossed into GAAP profitability with strong FCF, and the stock ripped ~24% in a week on a well-received AI product suite (Agent Studio, 360 Camera, Tracking Label) plus back-to-back $45 targets from BTIG and TD Cowen. But at ~12x sales, ~40x forward earnings, and sitting 9.9% above its 20-day SMA after a vertical move, the easy money in this leg looks taken; the model's own 1h/1d forecasts (33.5 and 35.2 vs $36 spot) call for near-term digestion even as longer bands point higher. This is a quality name to accumulate on pullbacks rather than chase.
Do not chase at $36 after a 24% weekly run with RSI 63 and price ~10% above SMA20; the model's 1h forecast ($33.47) and 1d forecast ($35.24) both point to near-term digestion. Set a starter buy zone at $33.00-34.50 (breakout retest) with 1/3 sizing; add only on a confirmed daily close above $38 (June high). Invalidation for a swing long: daily close below $32, which would negate the breakout and re-open $29. Note the 11.8% short float (6.7 days to cover) can fuel squeezes either way — expect volatility (ATR $2.06, ~6% daily vol).
1-6 month thesis: the AI product cycle (Agent Studio, 360 Camera, Tracking Label) should support 25-30% revenue growth into the Sep 3 earnings print (~63 days out), which is the key catalyst — Q2 guidance of $0.16 EPS next Q and the +30.5% sales cadence must hold. Expected return range: -15% (retest of $30-31 on any growth deceleration) to +25-30% ($44-46, converging on the $44.78 consensus target). I'd change my mind on a sub-25% revenue growth print, net retention slippage, or operating margin regressing negative — at 12x sales any deceleration gets punished severely, as the -24% distance from the $47.47 52-week high attests.
1-3 years: Samsara has a credible path to being the default operating system for physical operations (fleets, construction, field services) — a large, under-digitized TAM where its data moat compounds with every connected asset. If the company sustains ~25%+ growth (EPS next 5Y est. 26.8%) and lifts operating margin from ~1.5% toward 15-20% on a 76% gross margin base, the stock can grow into its multiple and compound to $60-75. The biggest structural risk is multiple compression: buying at 40x forward earnings means even flawless execution can deliver mediocre returns if rates or sentiment reset SaaS multiples, and 3-year holders are only up 25.6% despite the business roughly tripling revenue — proof that entry multiple has dominated returns here.
Revenue momentum is real and accelerating in absolute terms: quarterly revenue climbed sequentially from $391.5M (Jul-25) to $416.0M, $444.3M, and $478.8M in the April-2026 quarter (+30.5% Q/Q Y/Y per the snapshot, +29.6% TTM). The profitability inflection is the key change — net income swung from -$16.8M (Jul-25) to +$44.5M (Apr-26, 9.3% net margin), and EPS Q/Q printed +294%. Gross margin is elite and stable at ~76%, though operating margin is barely positive (1.5% last quarter, -0.7% TTM), meaning nearly all the P&L leverage is still ahead. Cash flow quality is the strongest pillar: FCF grew every quarter ($44.2M → $55.8M → $61.7M → $73.2M) with tiny capex (~$8M/qtr), giving ~$243M TTM FCF. Balance sheet is clean — $804M total cash vs $69M debt, working capital $566M, current ratio 1.6, and equity building ($1.21B → $1.51B over four quarters). What's broken is the price paid for it: 370x trailing P/E, 40x forward, 12.1x sales, 89x FCF, EV/EBITDA 126x. PEG of 1.48 on ~27% forward EPS growth is defensible but leaves zero room for a growth deceleration. ROE of 4.4% and ROIC 3.7% show the earnings base is still embryonic relative to the $21B market cap.
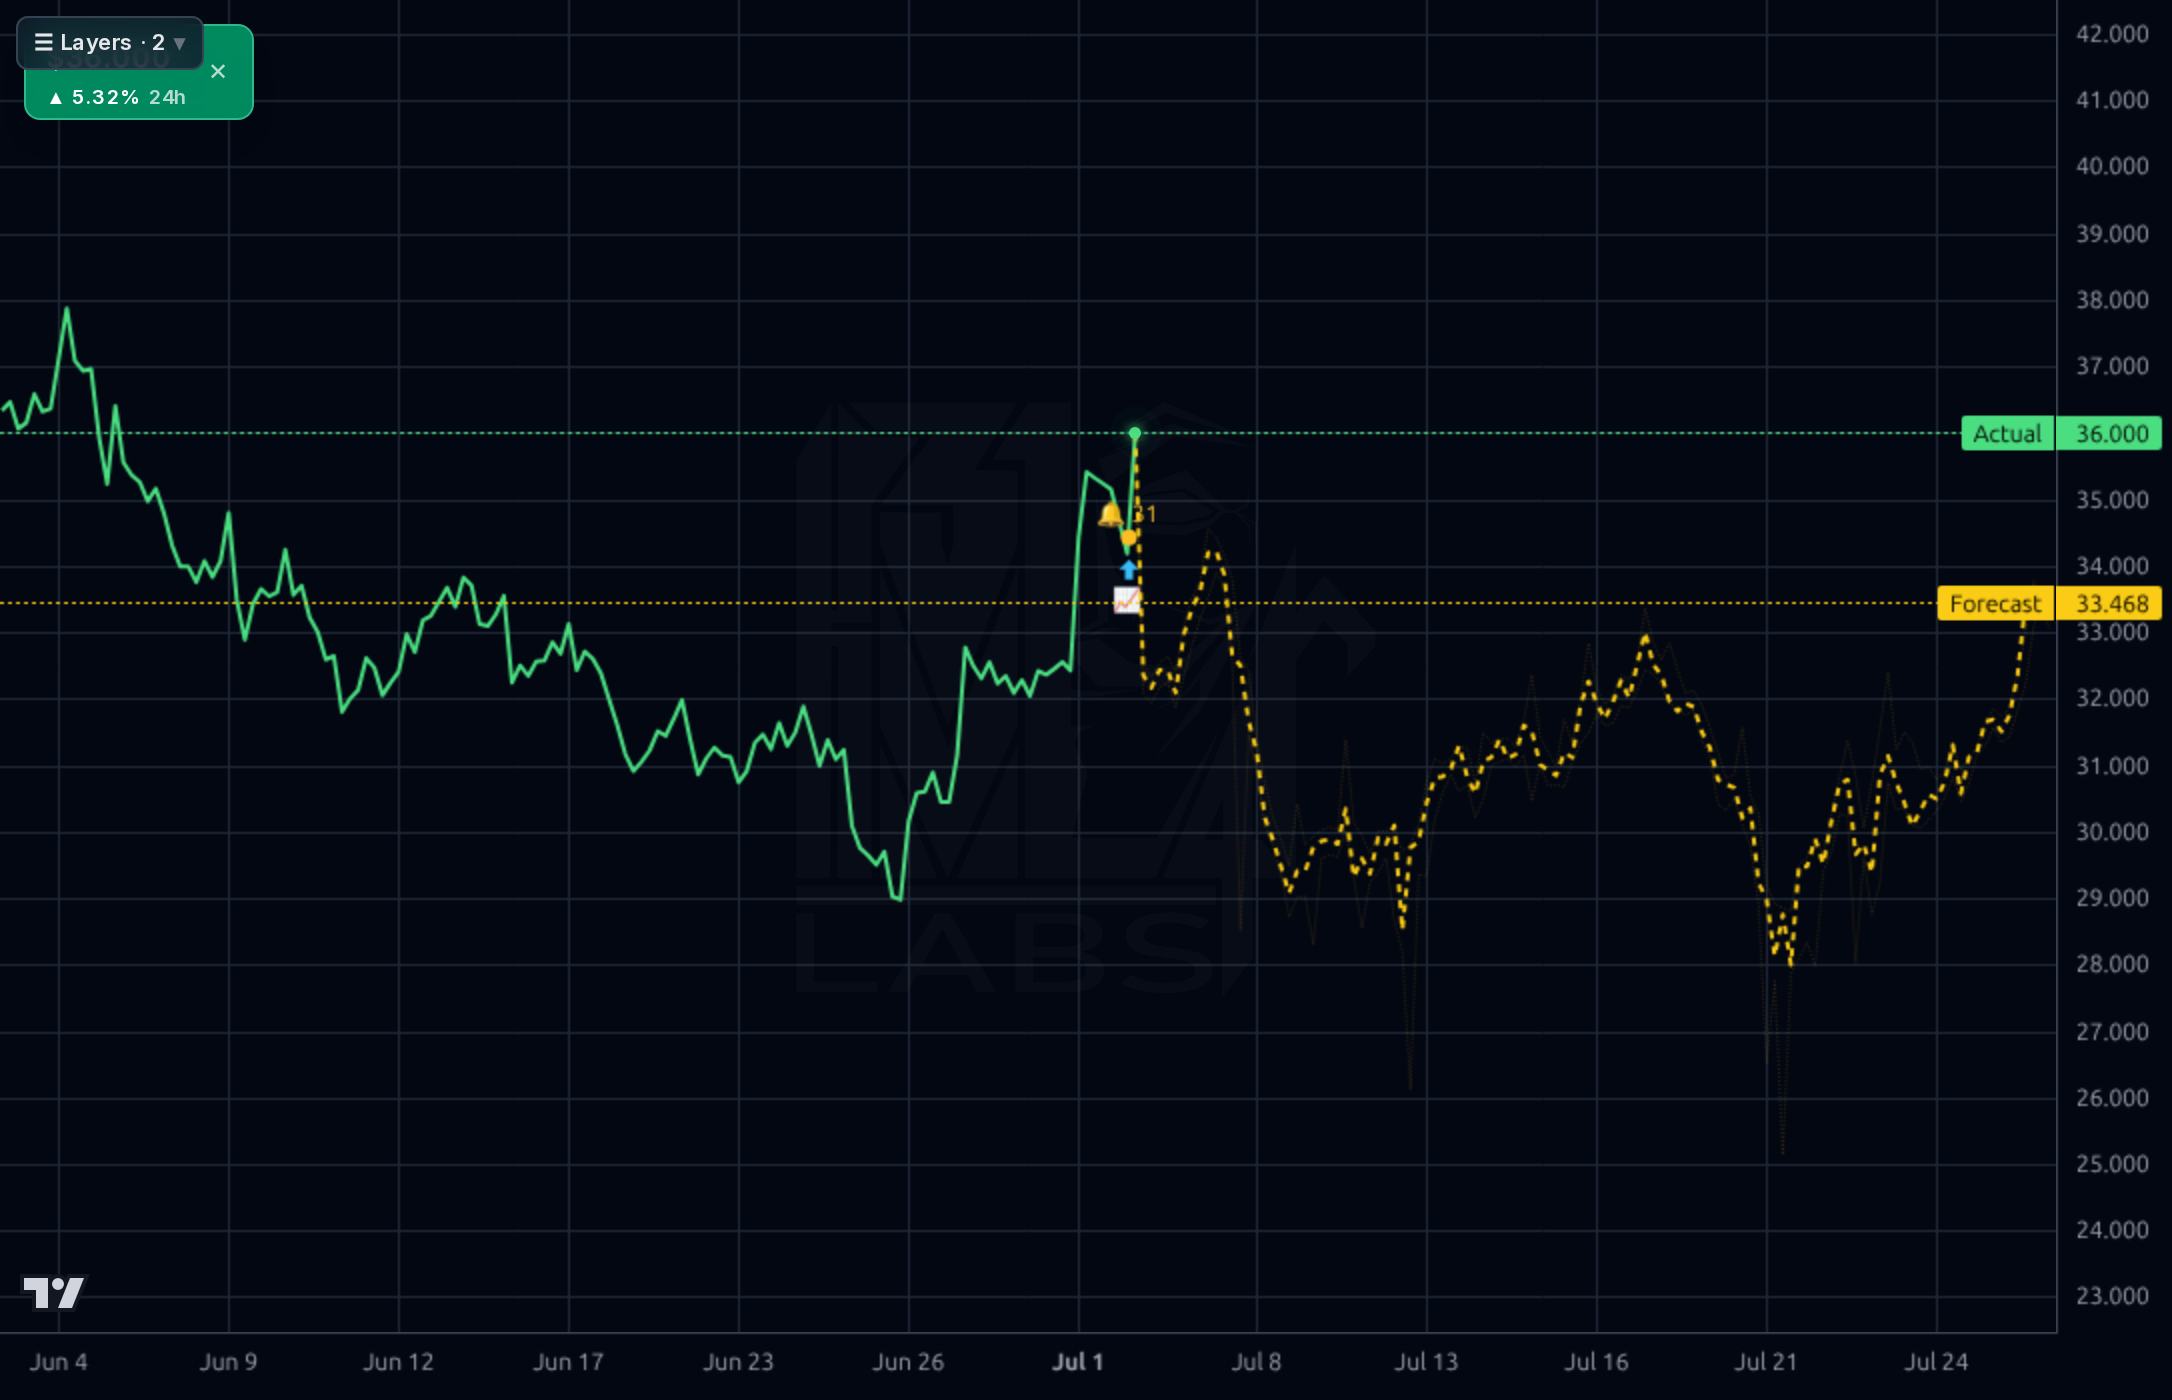
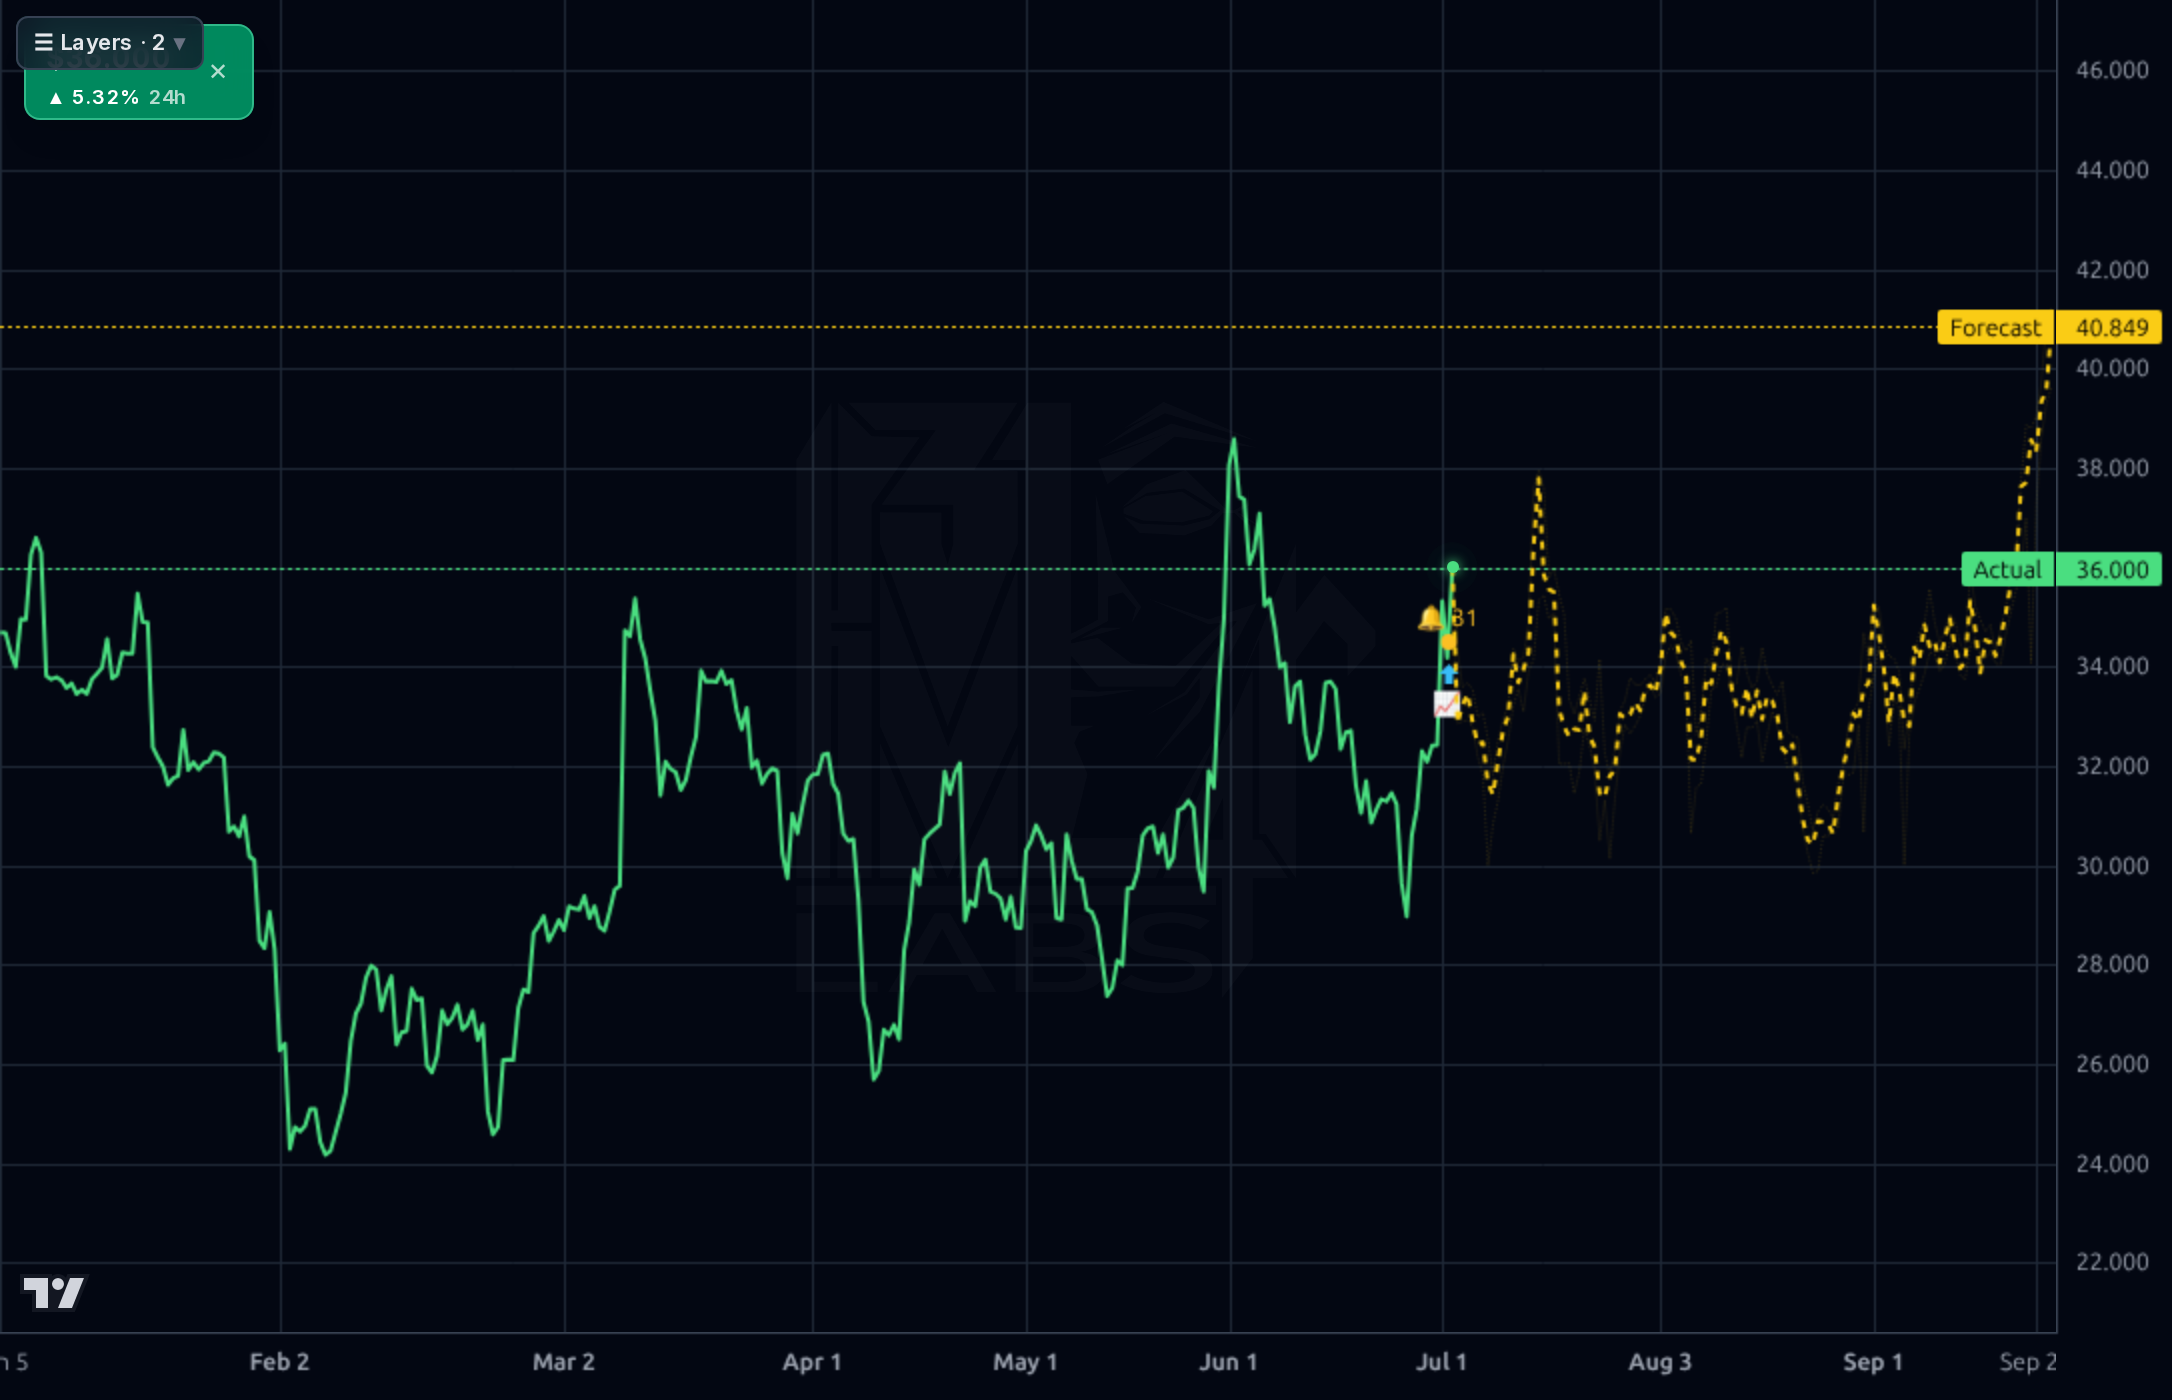
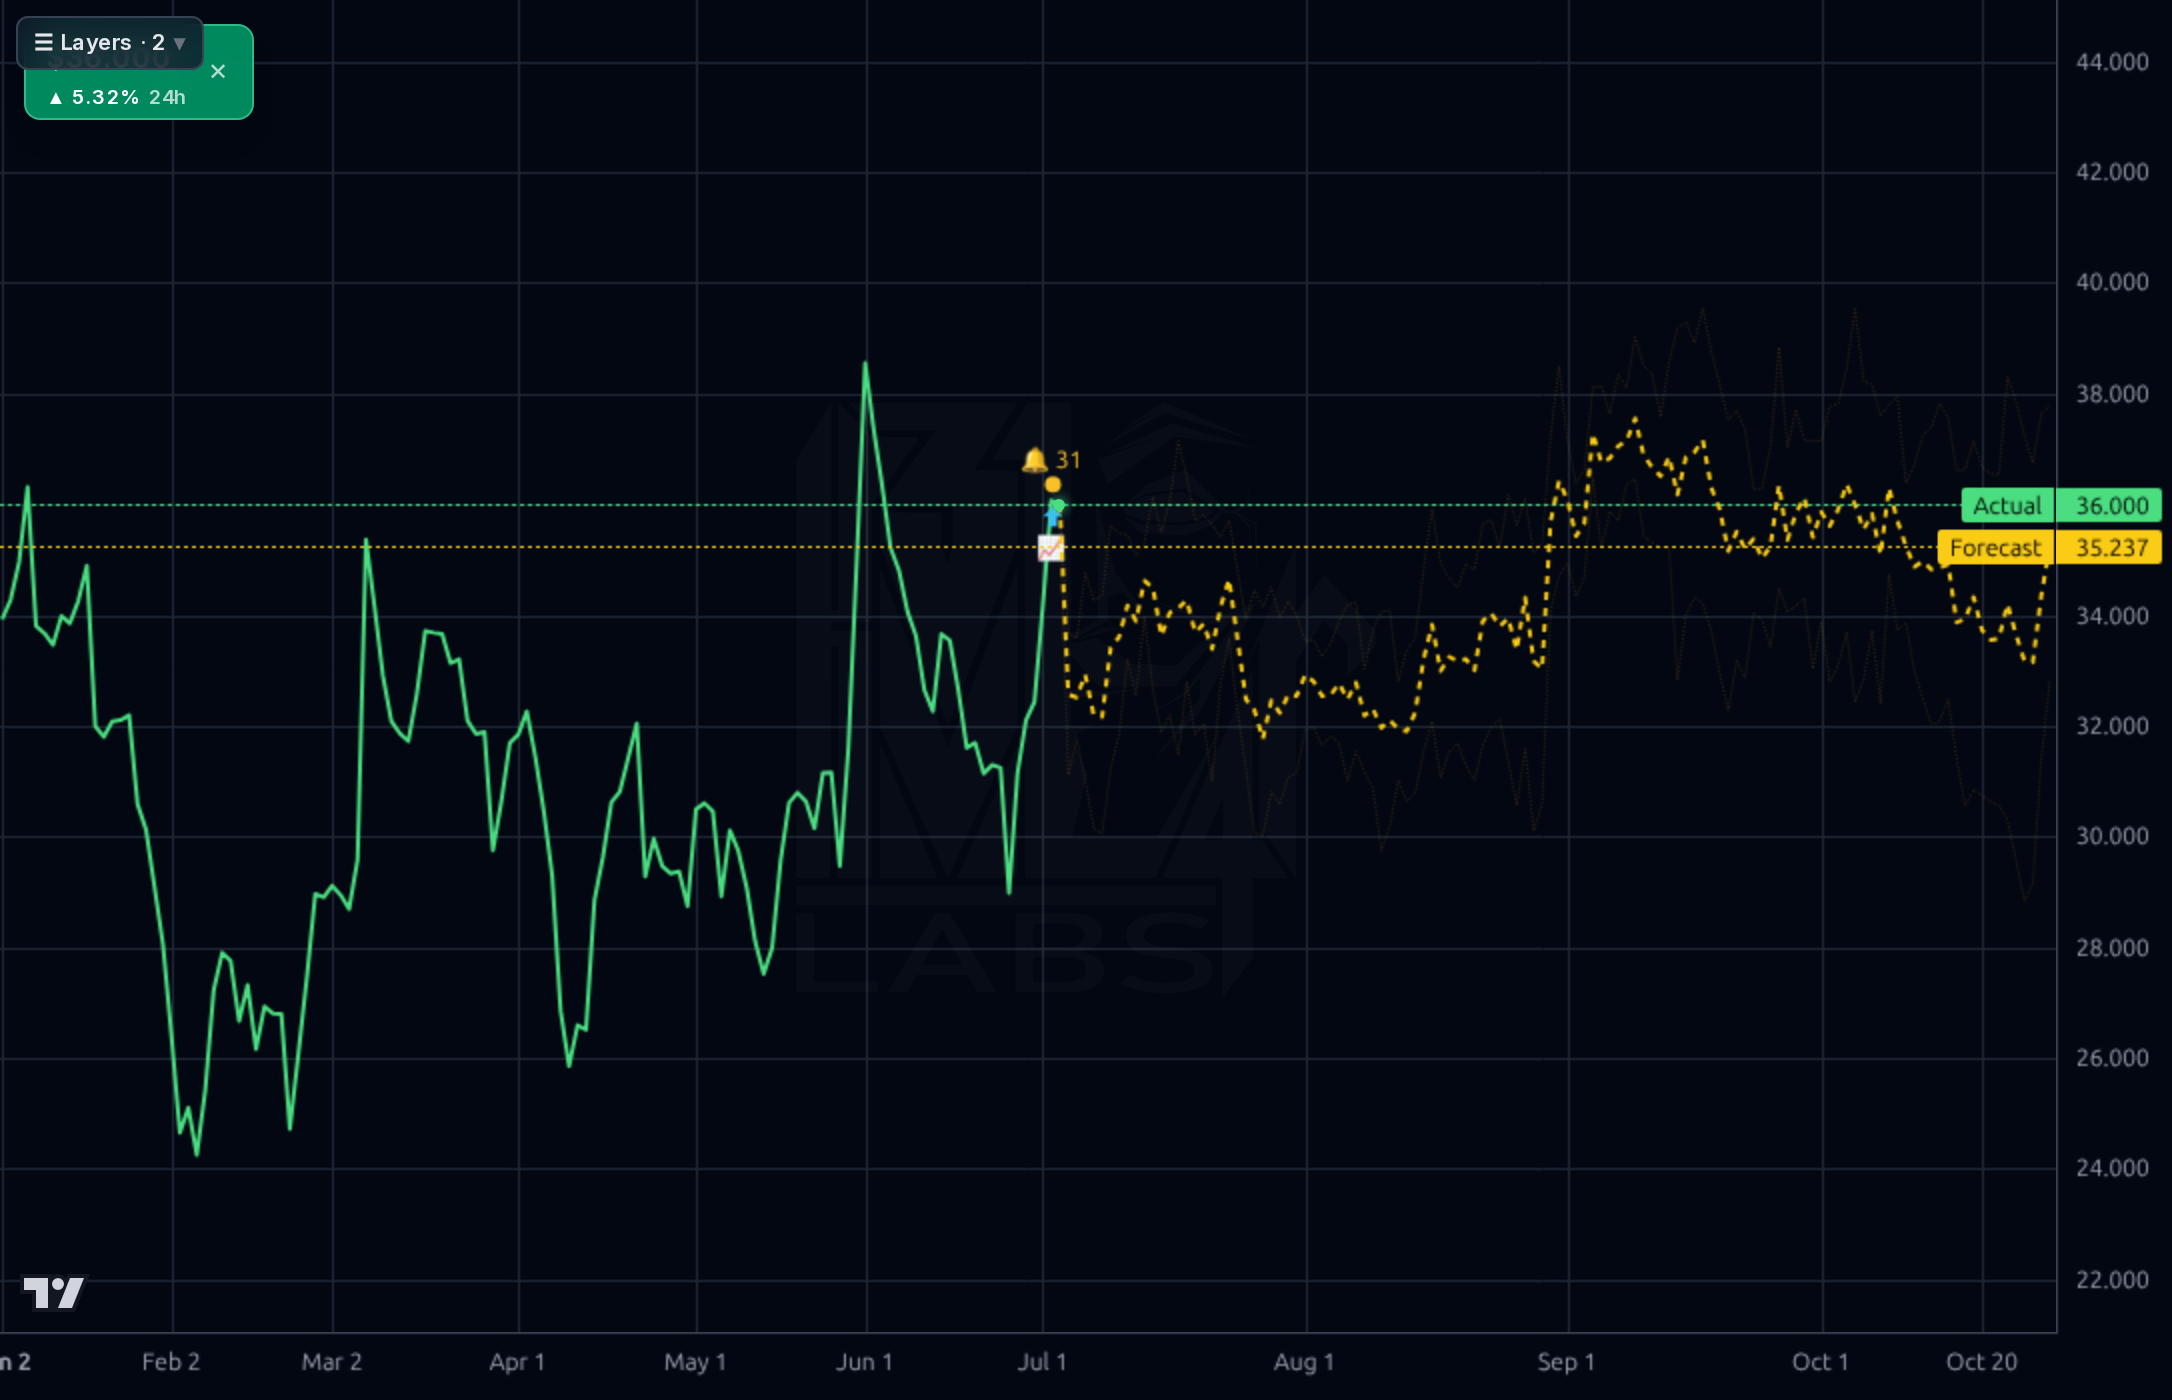
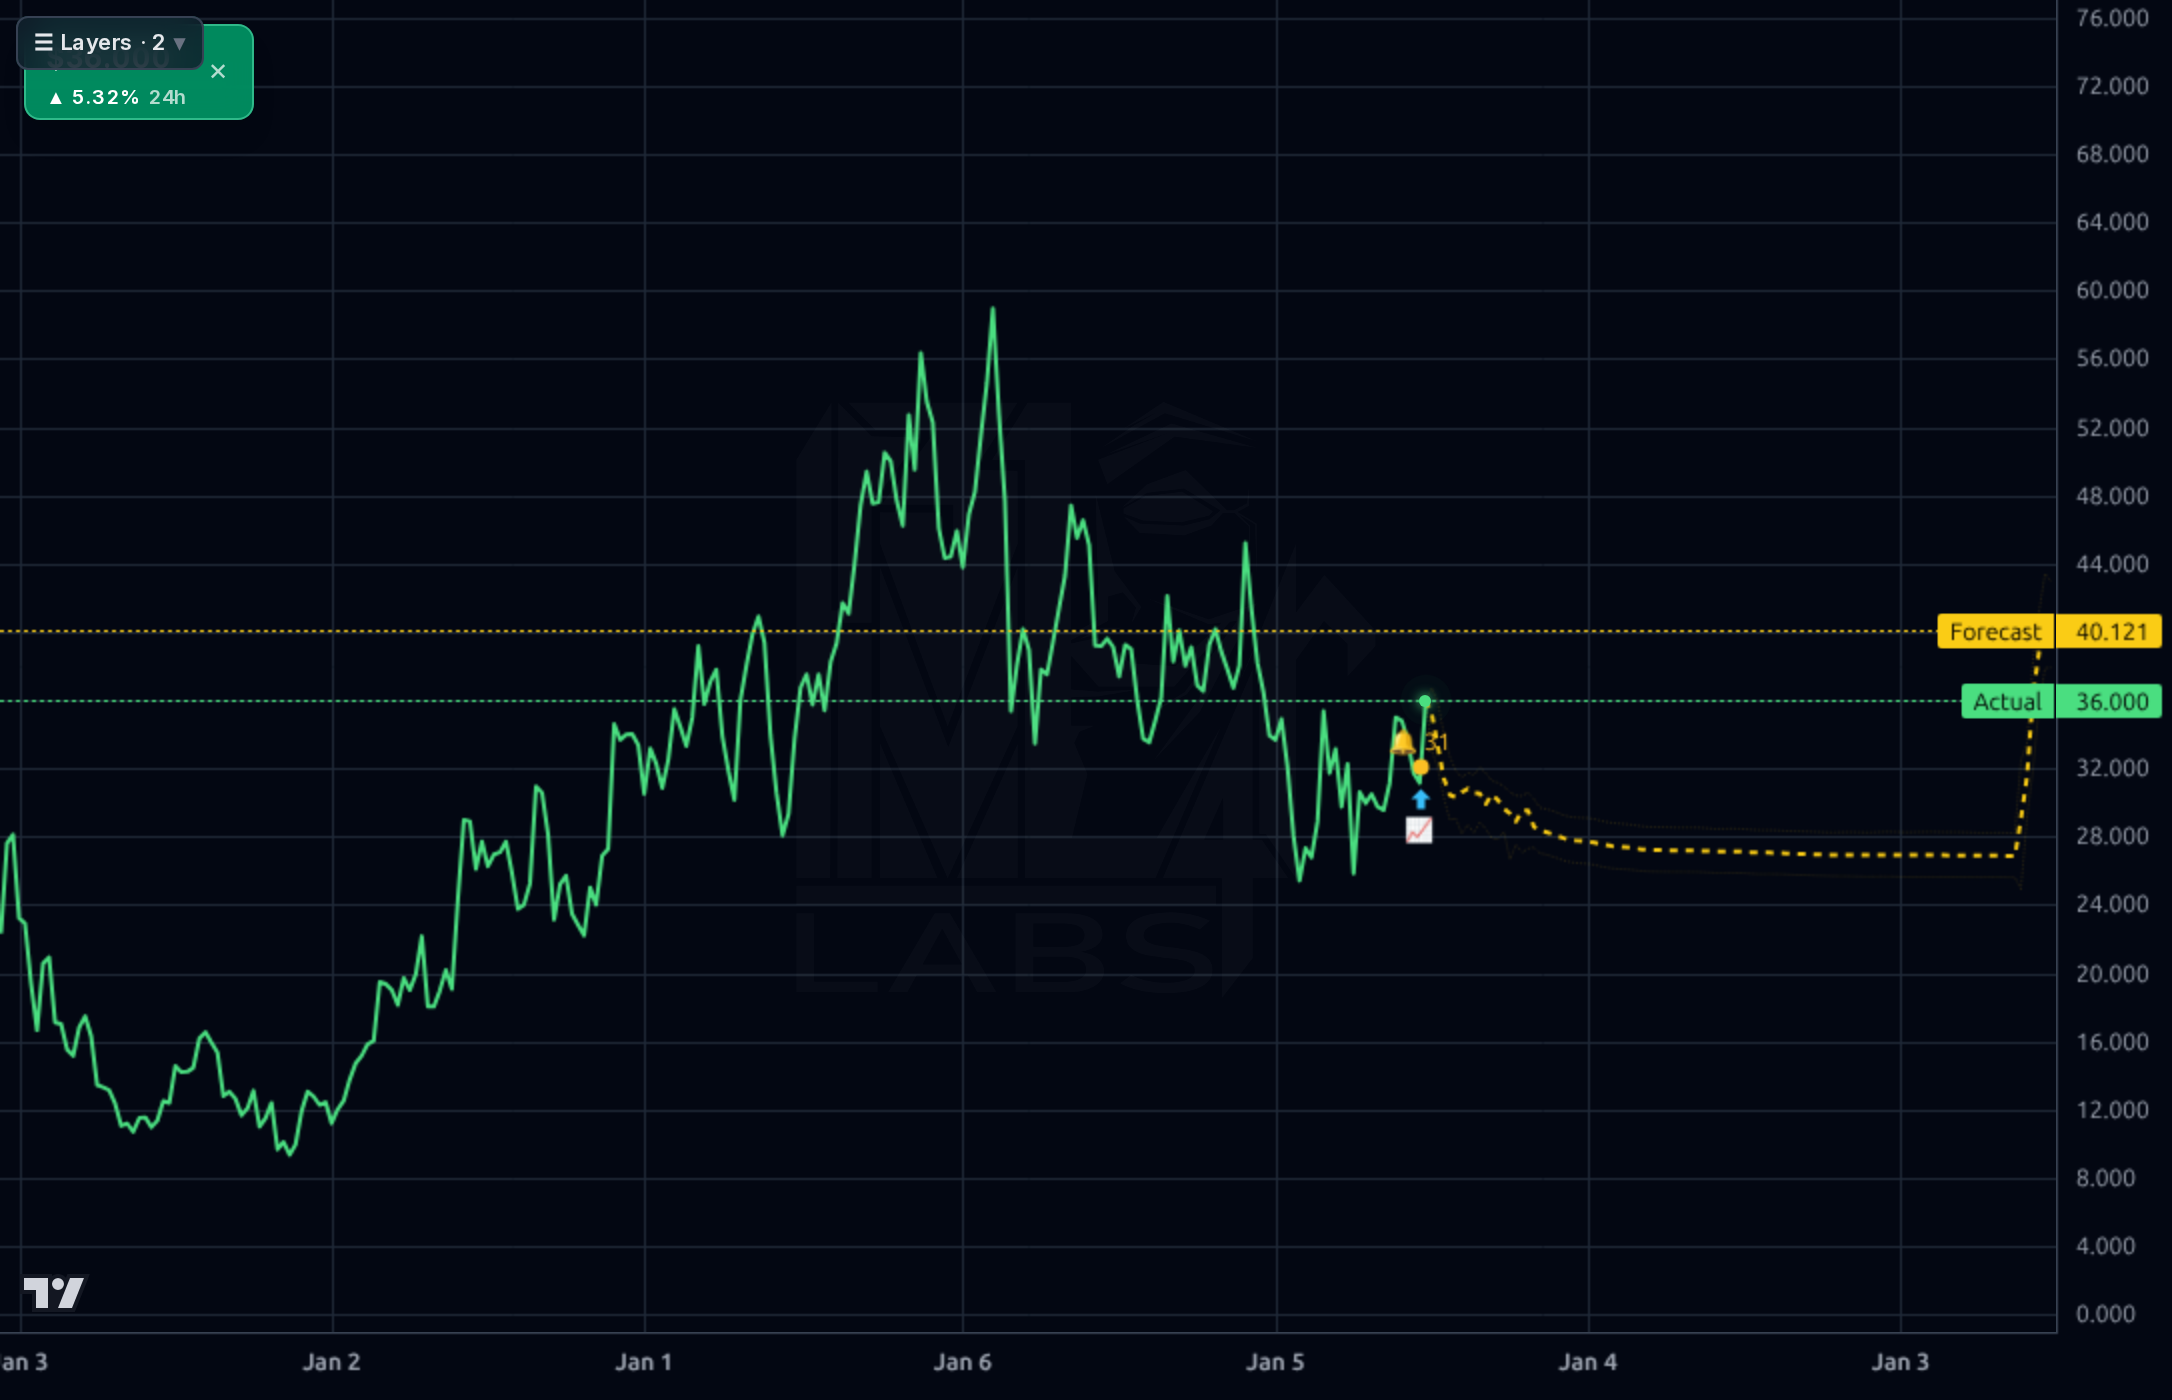
The multi-timeframe picture is a stock that just broke out of a downtrend. The daily chart shows a base between ~$24-38 since January with a sharp late-June thrust from ~$29 to $36 — reclaiming the range midpoint and closing at $36 (+5.3% on the day, +24% on the week). On the 1h chart the move is near-vertical from ~$32.5 to $36, and RSI(14) at 63 with price +9.85% over SMA20 and +13.87% over SMA50 flags short-term extension. Key levels: resistance at $38 (June swing high) then $40-41; support at $34.2 (breakout shelf), $32.5-33, then $29. The Kronos forecasts are internally mixed in a telling way: the 1h path calls for an immediate pullback to ~$33.5 with chop, the 1d forecast is flat-to-lower at $35.24 through October before recovering, while the 4h band eventually reaches $40.85 and the weekly $40.12 — i.e., digestion first, continuation later. Reliability matters here: 1d directional accuracy is 61% vs a 56% naive baseline (modest edge), but the 1wk forecast runs at 33% vs 50% baseline and should be heavily discounted — the weekly chart's odd dip-then-spike path looks like an artifact. Net read: constructive breakout, but overbought enough that chasing $36 offers poor risk/reward versus waiting for the $33-34.5 retest the short-horizon model itself projects.
The signal: Samsara's June AI product cycle is substantive, not vaporware. The Agent Studio (workflow automation), Samsara 360 Camera, and Bluetooth Tracking Label extend the platform from telematics into an 'AI layer for physical operations,' and the stock's 9.4% pop on the debut plus the Analyst/Investor Day (June 24) suggests institutions bought the narrative. Sell-side posture is firmly supportive — BTIG (June 26) and TD Cowen (June 25) both reiterated Buy with $45 targets, consistent with the consensus target of $44.78 and a 1.46 recom score. The 'Samsara Community' launch (June 22) is minor but reinforces ecosystem stickiness.
- Agent Studio AI workflow automation (June 2026 launch) — moves Samsara up the value stack from data collection to automated intervention, supporting seat/module expansion within existing fleet customers
- Samsara 360 Camera and next-gen AI dash cams — refreshes the video-safety attach cycle, the company's highest-penetration application
- Bluetooth Tracking Label — opens a new low-cost hardware SKU for shipment/asset visibility, expanding TAM beyond vehicles into supply-chain tracking
- Operating leverage inflection: net income went from -$16.8M to +$44.5M in four quarters while FCF grew each quarter to $73.2M — margin expansion is the next multi-year EPS driver (EPS next Y est. +27.7%)
- Samsara Community platform (June 22) — an ecosystem/network play that raises switching costs across physical-operations professionals
- Extreme valuation: 370x trailing P/E, 40x forward, 12.1x EV/sales, 126x EV/EBITDA — any growth miss at the Sep 3 print triggers outsized downside
- Technically extended: +24% in one week, +9.9% over SMA20, RSI 63 — mean-reversion risk that the model's own 1h/1d forecasts ($33.5/$35.2) explicitly project
- 11.8% short float / 6.7 days to cover — sophisticated money is positioned against the valuation; squeezes cut both ways
- Razor-thin operating margin (1.5% last quarter, -0.7% TTM) — the profitability story is one soft quarter from reversing
- Simply Wall St. DCF flags shares trading above intrinsic value even after only a 25.6% 3-year return — long-run multiple compression is the base case if growth slows
- Competitive pressure in fleet telematics (Geotab, Motive, Verizon Connect) could erode pricing on the core telematics module
- Retail sentiment is 100% bullish in the sample with the stock up 24% on the week — a contrarian crowding caution
- Model reliability is weak at longer horizons (1wk directional accuracy 33% vs 50% naive) — the bullish weekly forecast band should not anchor targets
Get AI analysis on any stock
This is one of hundreds of Kronos AI reports — scored fundamentals & technicals, bull/base/bear price targets, a multi-horizon plan, and continuously-updated forecasts across the market. Create a free account to explore them all.
Create your free account →Already a member? Sign in · Join our Discord