JBL — AI Stock Forecast & Price Targets
Published 7/14/2026 · A free sample of K3vl4r’s AI-powered analysis.
Kronos price forecasts, scored fundamentals & technicals, and a multi-horizon plan.
View the live JBL price forecast →
Jabil sits at $321.96 after a sharp 30-day drawdown of ~9%, with RSI at 37 and price ~10% below both SMA20/50 despite still being +19% above SMA200. Fundamentals remain compelling (17.8% TTM sales growth, 66% ROE, forward P/E 19.3, PEG 0.71, analyst consensus 1.67 with $442 target), but leverage is extreme (D/E 2.94) and the medium/long-term forecast bands are notably bearish — creating a tactical bounce setup inside a broader consolidation.
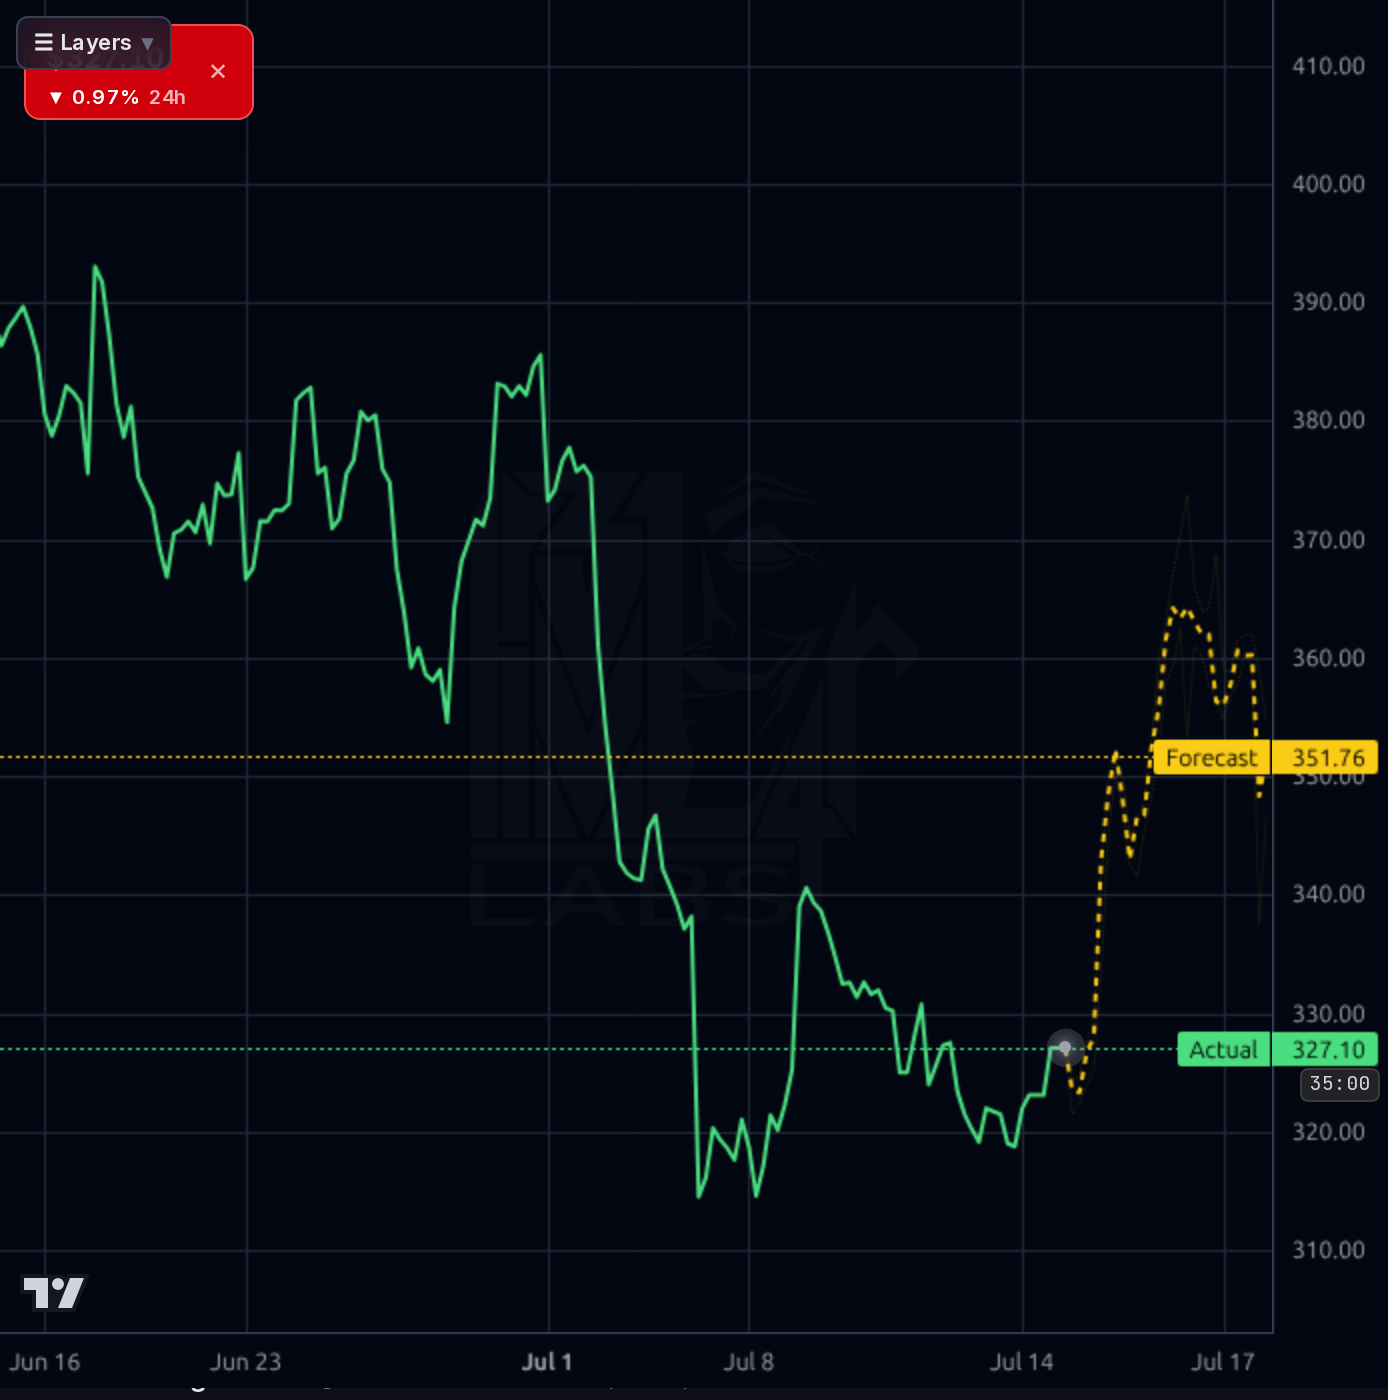
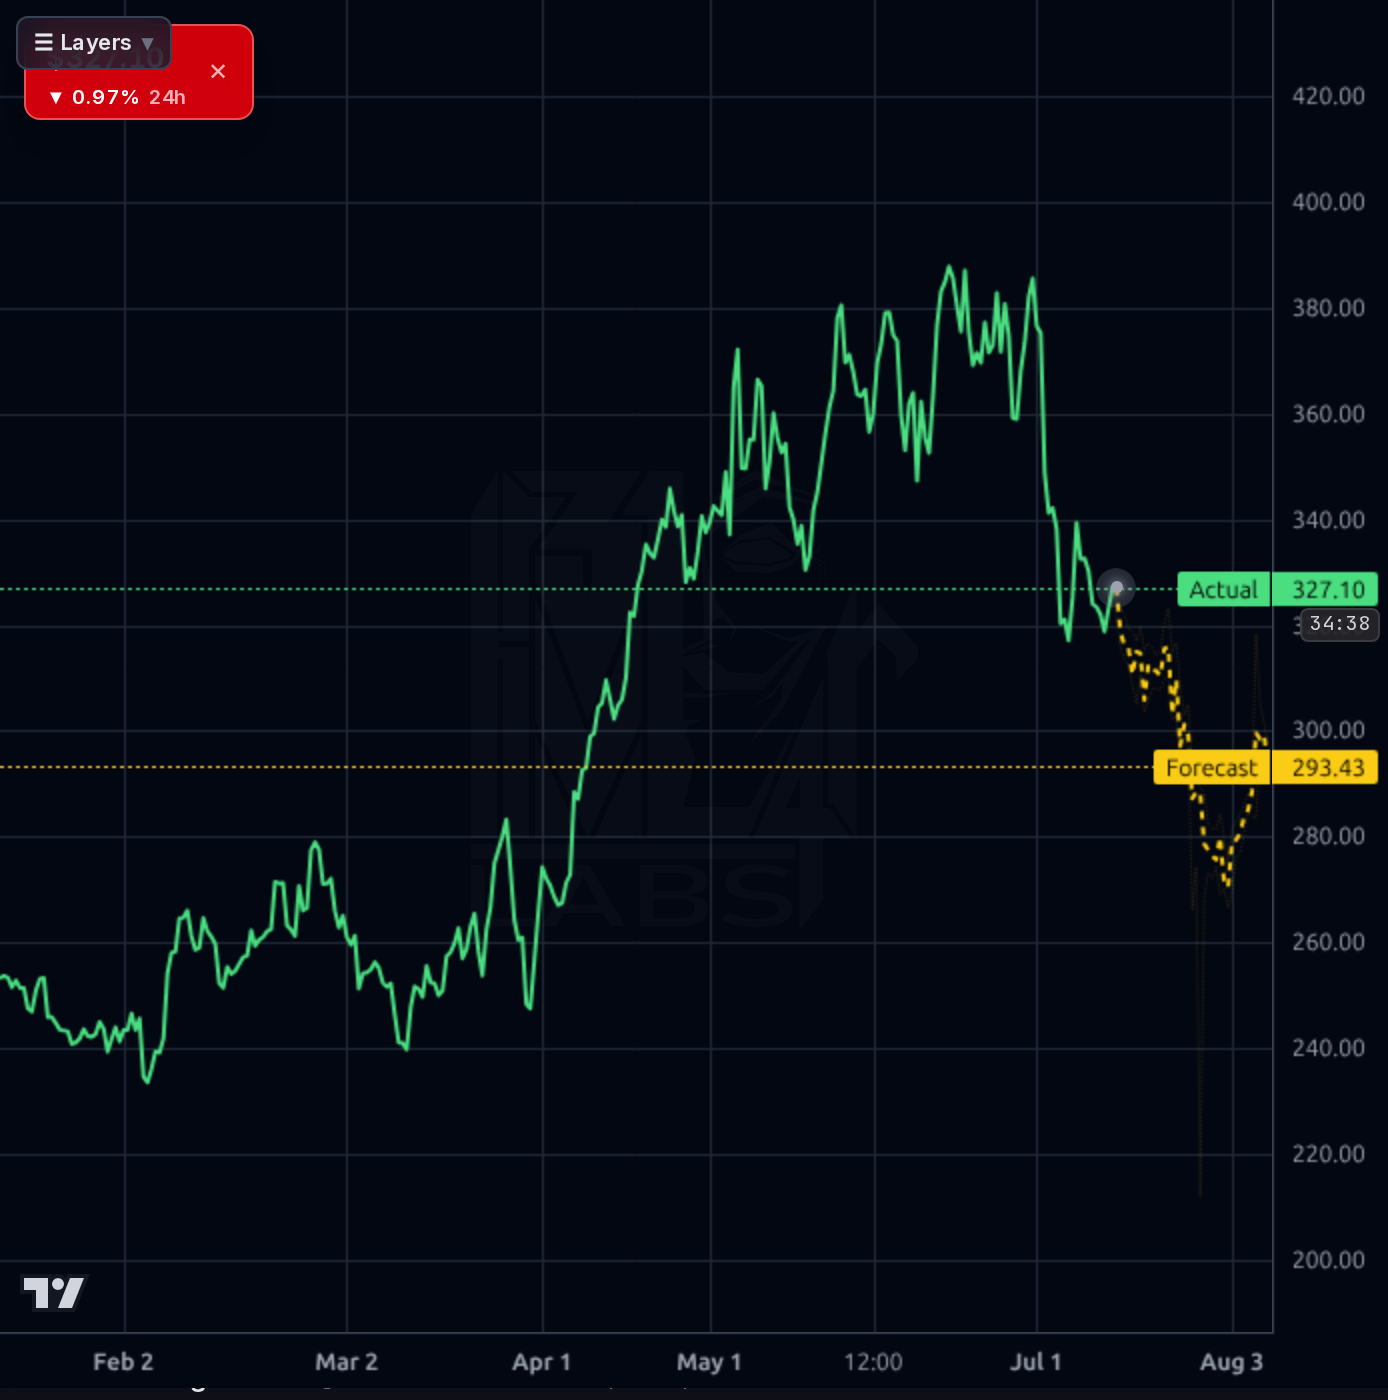
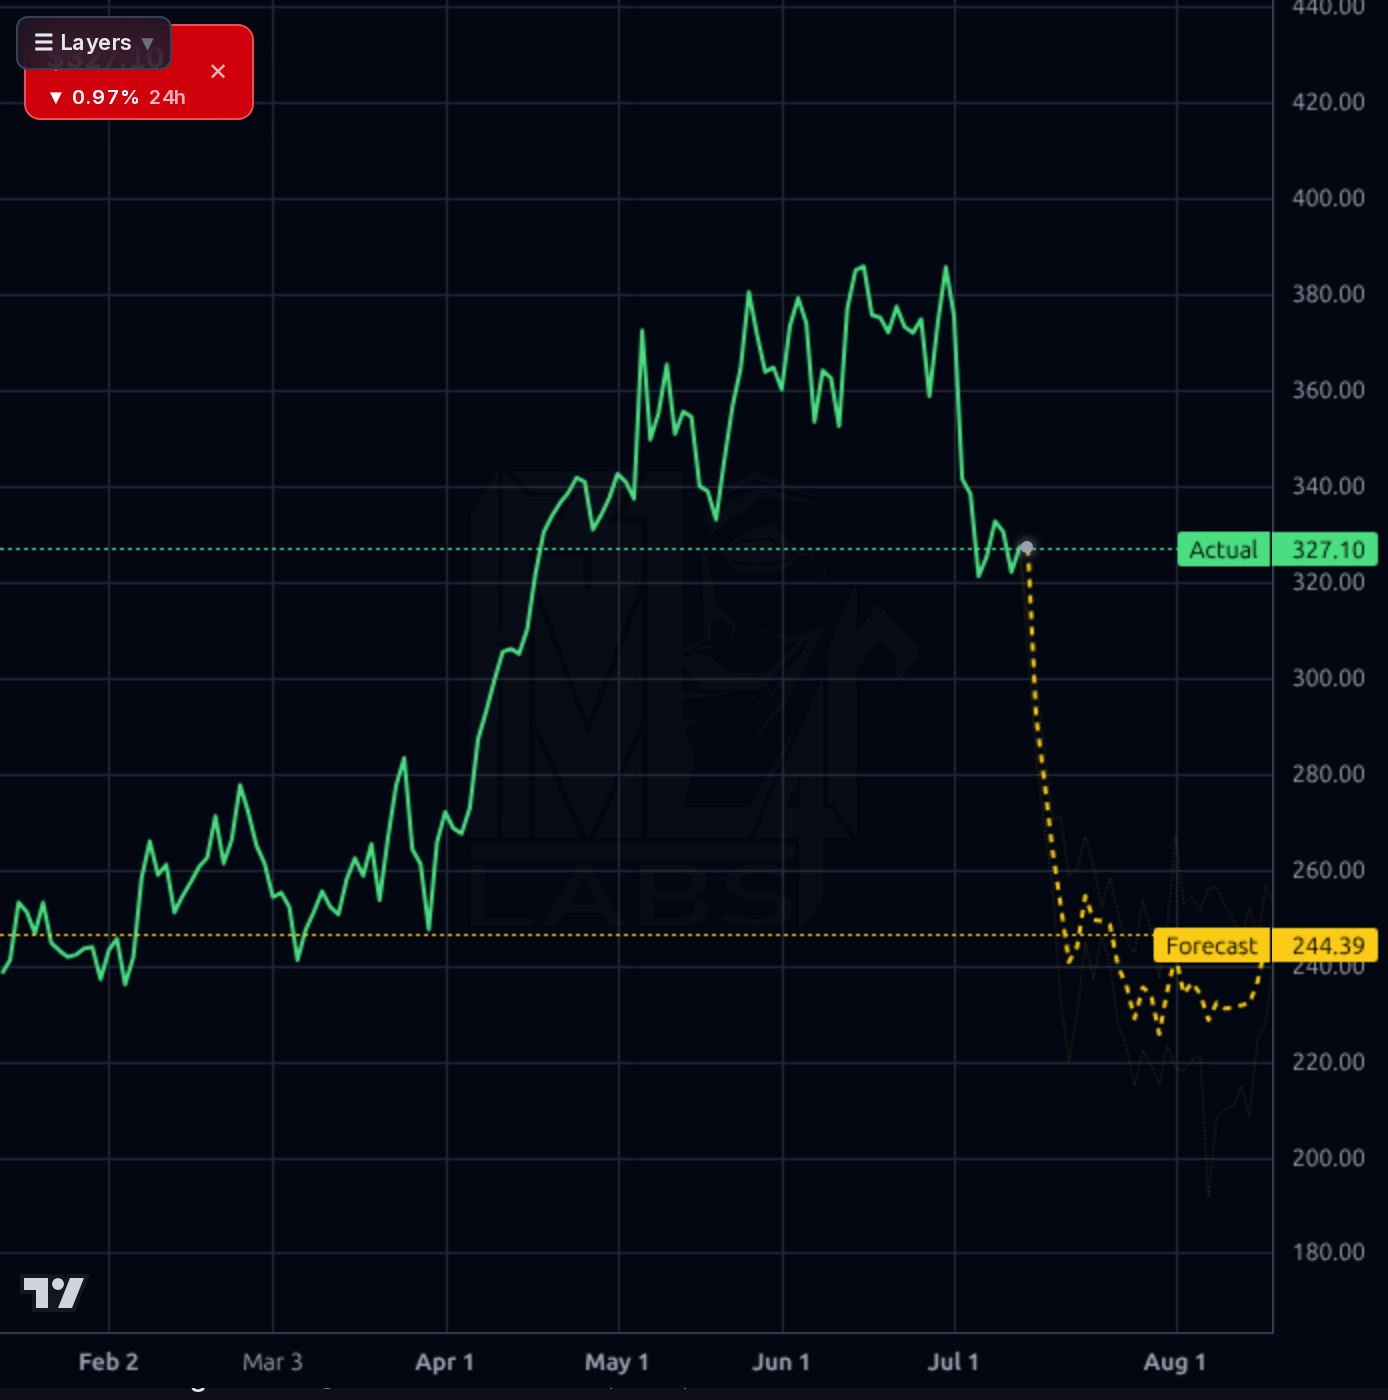
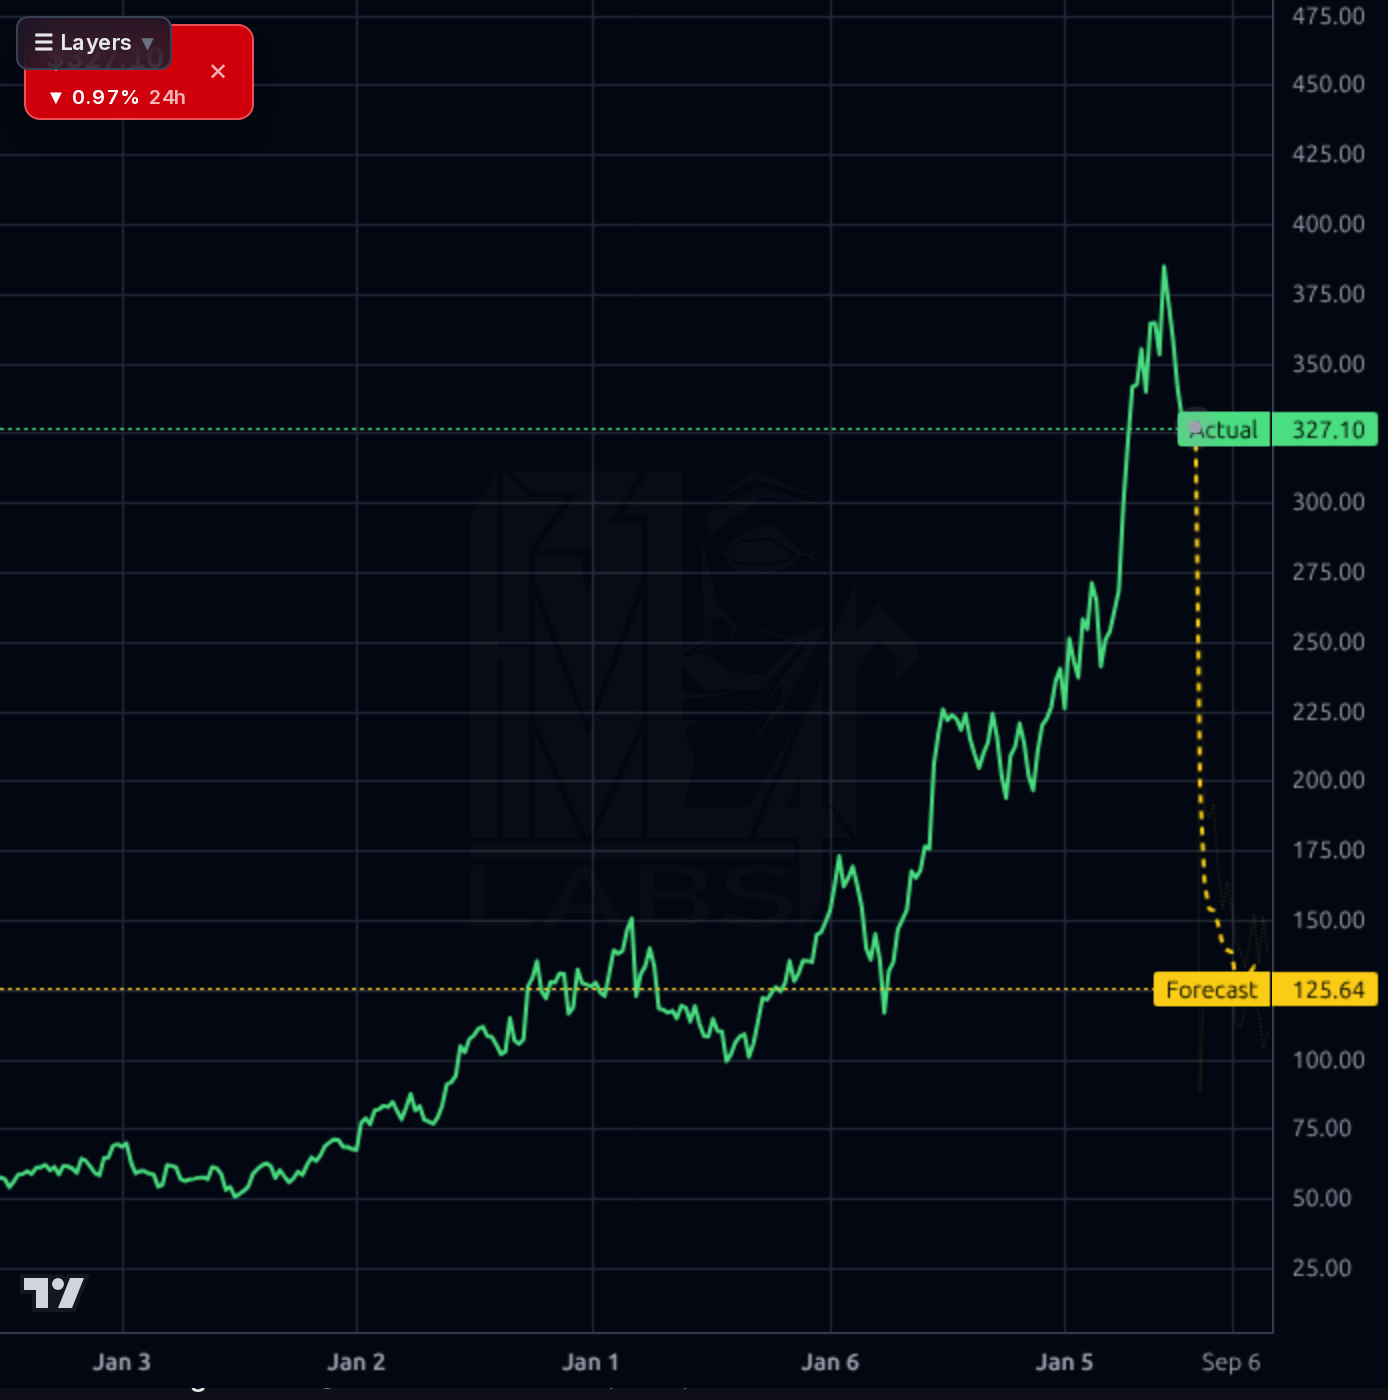
1-4 week view: Tactical long into oversold conditions. RSI 37 + price 10% below SMA20/50 + no negative catalyst + reflex bounce on 1h chart argue for a trade toward $345-360 (the 1h forecast cluster). Entry $318-323, stop below $312 (invalidates the double-bottom around $317), target 1 $345, target 2 $360. Size at half normal position given the extreme divergence between short-term bullish and longer-horizon bearish forecast bands.
1-6 month view: Constructive on fundamentals (revenue re-acceleration, EPS growth estimates raised twice in 45 days, analyst consensus 1.67 with $442 target), but respect the technical damage — a rebuild toward the prior $385-400 range likely requires a fresh catalyst (June 17 earnings). Base case return range +8-15% to $345-370. Change of mind: a weekly close below $300 would break the SMA200 uptrend, and a guide-down on the next print would materially damage the PEG-based thesis.
1-3 year view: Structural bull case rests on Jabil being a picks-and-shovels beneficiary of AI infrastructure buildout and healthcare device onshoring, with the Marshall County capacity expansion and datacenter infrastructure investments ($119M+) supporting a higher-margin mix. The biggest structural risk is the balance sheet: $3.9B debt vs. $1.3B equity means any prolonged capex cycle downturn or rate shock hits harder than at peers. If margins can trend from 5% toward 6%+ while revenue compounds high-single-digits, the stock has room to $500+; if the AI capex cycle rolls, it's a cyclical name that could give back 30-40%.
Revenue is re-accelerating: quarterly revenue climbed from $8.25B (Aug-25) to $8.75B (May-26), with Q/Q sales growth of 11.8% and Y/Y TTM sales +17.8% — a clear inflection driven by AI infrastructure and healthcare exposure. Gross margin held ~9.0-9.5% and operating margin recovered to 5.2% in the latest quarter, while net income of $275M was the strongest of the last four quarters. Cash flow is healthy: TTM FCF of $1.21B against $34B revenue, with the latest quarter delivering $351M FCF despite $184M capex tied to Marshall County-style expansion. The weak spots are the balance sheet and quality-of-equity metrics: stockholders' equity has actually shrunk to $1.32B while total debt sits at $3.89B (D/E 2.94), driving a headline ROE of 66% that is more leverage than operational excellence. Current ratio 0.98 and negative working capital of -$353M signal aggressive capital allocation (buybacks — the $902M program just completed) rather than a fortress balance sheet. Valuation is mixed: trailing P/E 40 is rich, but forward P/E 19.3 and PEG 0.71 look reasonable if EPS growth (next Y +31%, 5Y +27%) materializes.
Across timeframes the picture is a strong uptrend now digesting: the weekly chart shows a parabolic move from ~$100 to $428 peak with price now $321, the daily shows a break of near-term structure with a lower high around $340 and price sitting near prior support ~$320-325, the 4h shows a clear head-and-shoulders-like top with declining highs, and the 1h shows a capitulation low near $317 with a modest reflex bounce. RSI at 37, SMA20 -10.5%, SMA50 -10.1% place the stock in short-term oversold territory while SMA200 remains +18.8% (uptrend intact). The forecast bands are worth calling out but not obeying blindly: the 1h band projects a mean-reversion pop to ~$351, the 4h band bleeds to $293, the daily to $244, and the weekly to $125 — the latter two are extreme given a MAPE of 33-40% and directional accuracy that only matches the naive baseline. Key levels: support $317-320 (recent low) then $300 psychological; resistance $340 (broken shelf), $360-365 (short-term forecast cluster), then $385-390.
The recent newsflow is neutral-to-constructive but light on hard catalysts. Simply Wall St. and Yahoo highlight the stock as potentially undervalued on DCF grounds after the 5-year 7x return, and reference the completed $902M share repurchase plus a broad omnibus shelf registration (debt, preferred, common, warrants) — the shelf is dilutive-optionality, not an active raise, but worth monitoring given the leverage profile. Zacks flagged JBL in value screens using P/S and PEG. The only insider action is a small $32k sale by an EVP on 7/6, which is immaterial. SEC 8-K activity is limited to the June 17 earnings filing. Net-net: no negative surprise driving the pullback, so the drawdown looks technical/positioning-driven rather than fundamentals-driven, which supports a mean-reversion tilt.
- AI infrastructure buildout — $119M+ dedicated datacenter infrastructure facility investment referenced in recent coverage supports the Intelligent Infrastructure segment.
- Marshall County facility expansion continues to add capacity for high-margin advanced computing and AI supercomputer platforms.
- Healthcare & regulated industries — medical device manufacturing scaling into a secular onshoring/reshoring tailwind.
- EPS estimate upgrades: next-year EPS growth raised from 18.6% → 25.9% → 31.0% over 45 days, indicating sell-side conviction is building.
- Just-completed $902M buyback signaling management confidence and providing per-share EPS support even at flat net income.
- Debt/Equity 2.94 with shrinking book equity — leverage-driven ROE is a red flag if margins soften.
- Longer-horizon forecast bands imply meaningful downside ($244 on daily, $125 on weekly) — even if MAPE is high, the directional signal is bearish.
- Current ratio 0.98 and negative working capital of -$353M leave little cushion if the AI capex cycle slows.
- Gross margin only 9% — a thin buffer; any input cost or pricing pressure flows straight through.
- Stock is up 45% YTD and 464% over 5 years — momentum crowding risk with 3.02% short float still modest, meaning limited squeeze support on further downside.
- Omnibus shelf registration creates dilution optionality that could be exercised if leverage becomes problematic.
- Extreme social/retail chatter (pump-style messages in the sentiment data) suggests some froth in the retail crowd.
Get AI analysis on any stock
This is one of hundreds of Kronos AI reports — scored fundamentals & technicals, bull/base/bear price targets, a multi-horizon plan, and continuously-updated forecasts across the market. Create a free account to explore them all.
Create your free account →Already a member? Sign in · Join our Discord