JEF— AI Stock Forecast & Price Targets
Published 6/12/2026 · A free sample of K3vl4r’s AI-powered analysis.
Kronos price forecasts, scored fundamentals & technicals, and a multi-horizon plan.
View the live JEF price forecast →
Jefferies trades at $61.66, near 52-week highs ($71.04) and roughly 20x trailing EPS, with Oppenheimer just raising its target to $87 ahead of what it expects to be a strong fiscal Q2. However, the Kronos AI model forecasts mean-reversion toward $48-53 across daily/weekly horizons, and recent quarterly results show decelerating net income ($252M → $215M → $175M) and a sharp swing to -$1.74B operating cash flow in Q1 FY26, suggesting the market has already priced in a capital-markets recovery that is not yet showing up in the numbers.


Tactically cautious into the Oppenheimer-flagged Q2 print. Stock is extended after a $36→$62 run and the Kronos model targets $53 on the 1d horizon. I would not chase here; wait for either (a) a pullback to the $54-56 zone to initiate, or (b) a confirmed breakout and hold above $65 on heavy volume post-earnings. Invalidation for any long is a daily close below $52. Position size small (1/3 of intended) given event risk.
1-6 month thesis hinges on whether the IB/ECM recovery thesis priced into the forward P/E of 13.6 actually materializes in reported EPS. If Q2/Q3 confirm a return toward the Aug'25 run-rate of $250M+ net income, fair value drifts toward Oppenheimer's $87. If margins keep slipping as they did the last two quarters, the stock re-rates down to $48-52. Expected return range: -15% to +25%. Catalysts: fiscal Q2 print, M&A announcement volumes, IPO calendar, Fed path. Mind-change triggers: two consecutive quarters of net margin >8%, or conversely sustained negative operating cash flow.
Jefferies is a credible mid-tier global investment bank that has taken share from bulge-bracket competitors over the past decade, with optionality from the asset management buildout. Multi-year drivers: continued share gains in advisory, scaling of the Leucadia-era alternative asset platforms, and capital return ($2.68% yield plus buybacks). Biggest structural risk is cyclicality — capital markets revenue is highly correlated to deal volumes and a recession or sustained higher-for-longer rate regime would compress both fees and trading. Secondary risk: the balance sheet is leveraged (debt/equity 343%), so a credit shock would hit book value disproportionately.
Revenue has been choppy but trending up sequentially ($2.49B in May'25 → $2.91B Aug → $2.95B Nov → $2.87B Feb'26), consistent with a gradual IB/capital-markets recovery. The problem is the bottom line: net income peaked at $252.5M in Aug'25 and has fallen two consecutive quarters to $175.2M (Feb'26), with net margin compressing from 8.7% to 6.1%. Gross margin is stable around 56-57% and operating margin near 41%, but EBITDA also slipped from $1.25B to $1.12B. Balance sheet shows $74.4B assets against $63.7B liabilities and only $10.6B equity — debt/equity reported at 343% reflects the leveraged nature of a broker-dealer, and total debt rose to $25.9B from $23.0B a year ago while cash dropped to $12.0B from $14.0B. Cash flow is lumpy and weak in quality: operating cash flow was -$1.74B last quarter and -$978M two quarters before that; only Nov'25 was strongly positive. Trailing P/E of 20.7 vs forward P/E of 13.6 implies analysts expect a meaningful earnings rebound — that gap is the entire bull case. Dividend yield of 2.68% provides some carry.
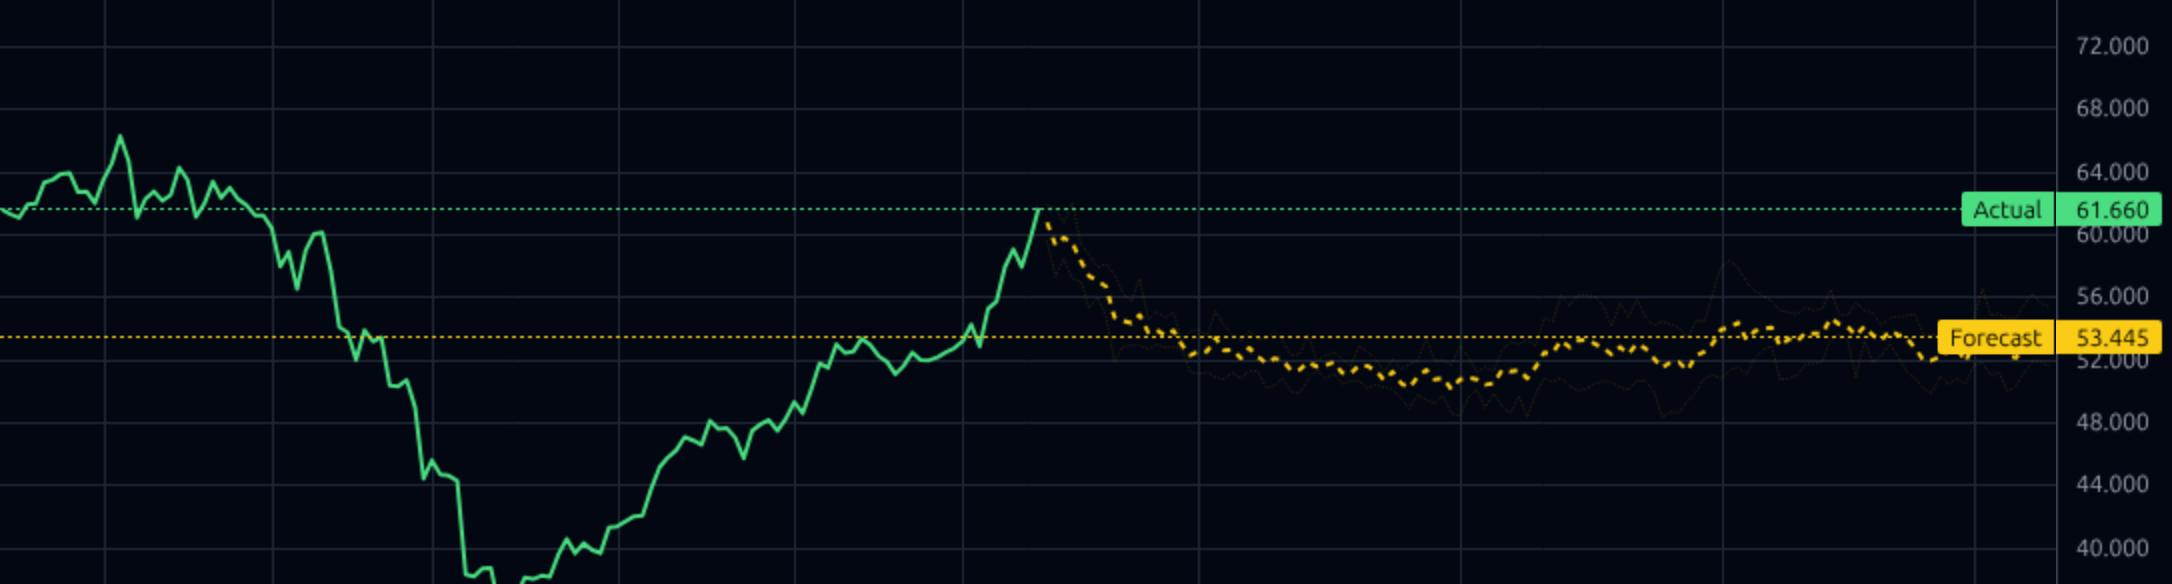
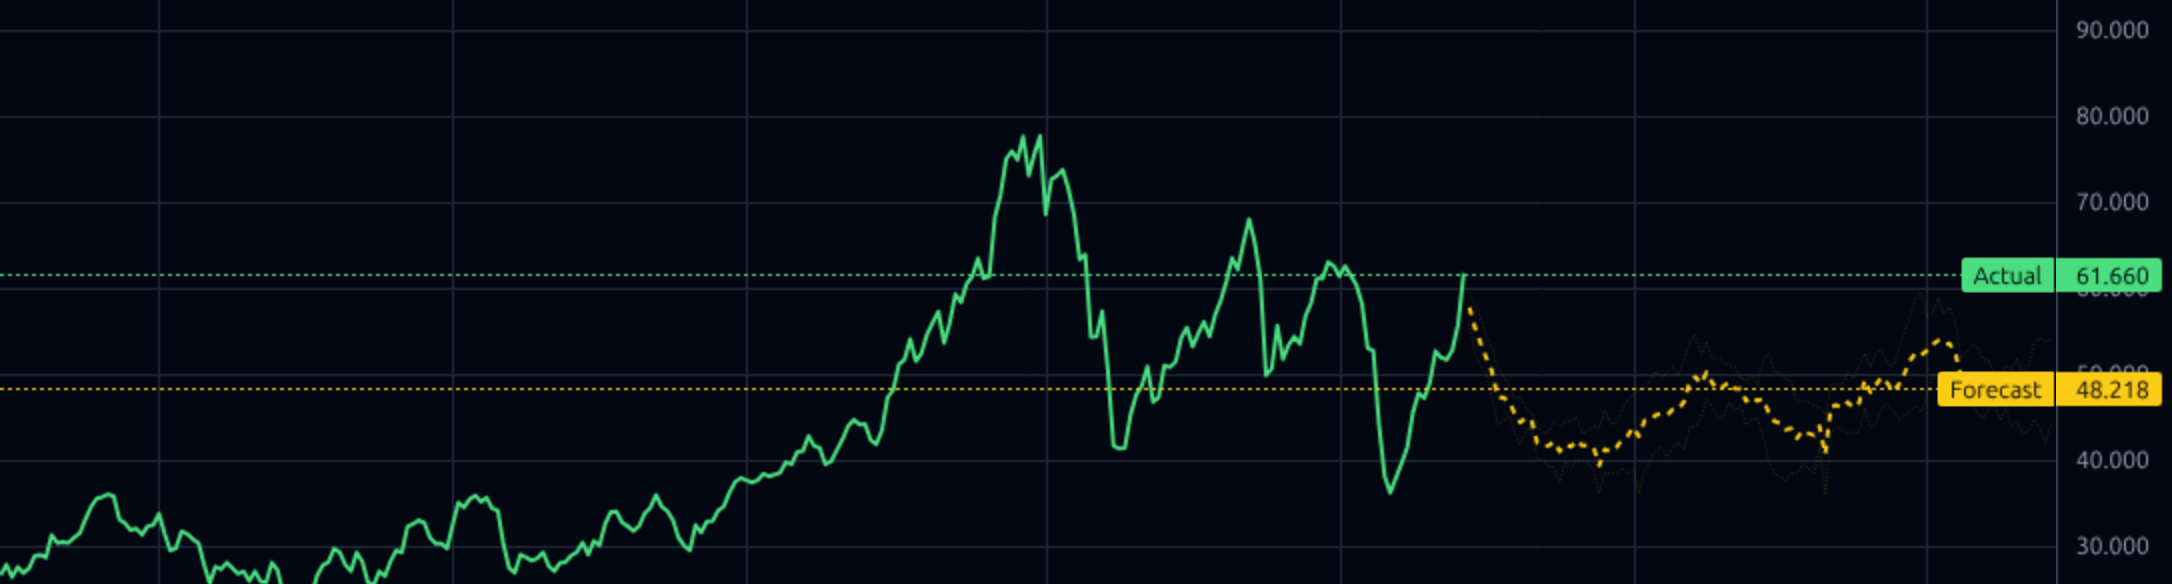
The 1d and 1wk charts show JEF rallied sharply from a ~$36 trough back to $61.66, recovering most of the drawdown from the prior $78 peak but still ~13% below the 52-week high of $71.04. Price is pressing into clear overhead supply in the $62-71 zone. The Kronos forecast band is notably bearish across timeframes: 1d forecast points to $53.45 (-13%) and 1wk to $48.22 (-22%), both well below current price and roughly aligning with the prior consolidation shelf around $48-52 which is the logical support. Momentum has been strong but the model is calling for mean reversion after the vertical move. The supplied near_term_bullish probability of 0.20 corroborates the cautious technical setup. Key support: $52 (forecast cluster), then $40 (recent low). Key resistance: $65 then $71.
The signal: Oppenheimer reiterated Outperform and raised its price target from $72 to $87, calling for a 'strong' fiscal Q2 driven by favorable investment banking conditions — this is a direct positive catalyst into the upcoming print and explains the recent rally. Jefferies is also active as a sell-side voice (downgrading Redwire, raising Navan's target to $26), which is sentiment-neutral for JEF itself but reflects continued deal-flow engagement. The noise: broader market headlines on CFTC sports betting litigation, Iran deal speculation, and a SpaceX IPO are macro context only. The Truist analyst-divergence article is sector-adjacent but not JEF-specific. Net: news flow skews positive into earnings, but it is largely sell-side optimism on a stock that has already moved.
- Fiscal Q2 2026 earnings, which Oppenheimer expects to be 'strong' on favorable IB conditions — near-term catalyst that justified the PT raise from $72 to $87
- Sequential revenue recovery already visible: $2.49B (May'25) → $2.87B (Feb'26), consistent with a thaw in capital markets activity
- Asset Management segment expansion across alternative strategies provides a less cyclical fee stream to complement IB
- Active league-table participation evidenced by sell-side activity (Navan PT hike to $26, Redwire coverage) signals deal-flow engagement and underwriting pipeline
- Forward EPS of $4.53 vs trailing $2.98 implies consensus expects ~52% earnings growth — execution on that would re-rate the stock
- Net income has declined two consecutive quarters ($252M → $215M → $175M) despite stable revenue — margin compression undermines the recovery narrative
- Operating cash flow swung to -$1.74B in the latest quarter; cash flow quality is poor and lumpy
- Stock is up ~70% from the recent $36 low and Kronos AI forecasts $53 (1d) and $48 (1wk), implying 13-22% downside to model fair value
- Trailing P/E of 20.7 is rich for a cyclical broker-dealer; valuation depends entirely on the forward EPS rebound materializing
- Debt/equity of 343% and total debt rising to $25.9B leaves limited margin for error in a credit or rate shock
- Capital markets cyclicality: any stall in M&A/IPO activity or recession risk directly hits both advisory fees and trading revenue
- Near-term bullish probability supplied at only 0.20 — model and momentum disagree
Get AI analysis on any stock
This is one of hundreds of Kronos AI reports — scored fundamentals & technicals, bull/base/bear price targets, a multi-horizon plan, and continuously-updated forecasts across the market. Create a free account to explore them all.
Create your free account →Already a member? Sign in · Join our Discord