JRSH — AI Stock Forecast & Price Targets
Published 7/14/2026 · A free sample of K3vl4r’s AI-powered analysis.
Kronos price forecasts, scored fundamentals & technicals, and a multi-horizon plan.
View the live JRSH price forecast →
JRSH is a post-earnings momentum breakout with genuinely improving fundamentals: Q4 EPS of $0.12 crushed the -$0.01 consensus, revenue grew 46.6% Y/Y to $42.9M, and Q1 guidance ($47.5-48.3M vs $42.3M est) implies acceleration — all on a forward P/E of ~9-10.5x, PEG 0.34, P/B 0.93 and a 4.2% dividend yield. The AI forecast is uniformly bearish (projecting $3.10-3.93 across timeframes), but its realized directional accuracy trails the naive baseline on both 1d (60% vs 65%) and 1wk (50% vs 67%) with a 31% MAPE, so it should be heavily discounted. The stock is consolidating ~14% below its $5.47 52-week high with the Aug 11 earnings print as the next binary catalyst; the setup favors patient accumulation rather than chasing.
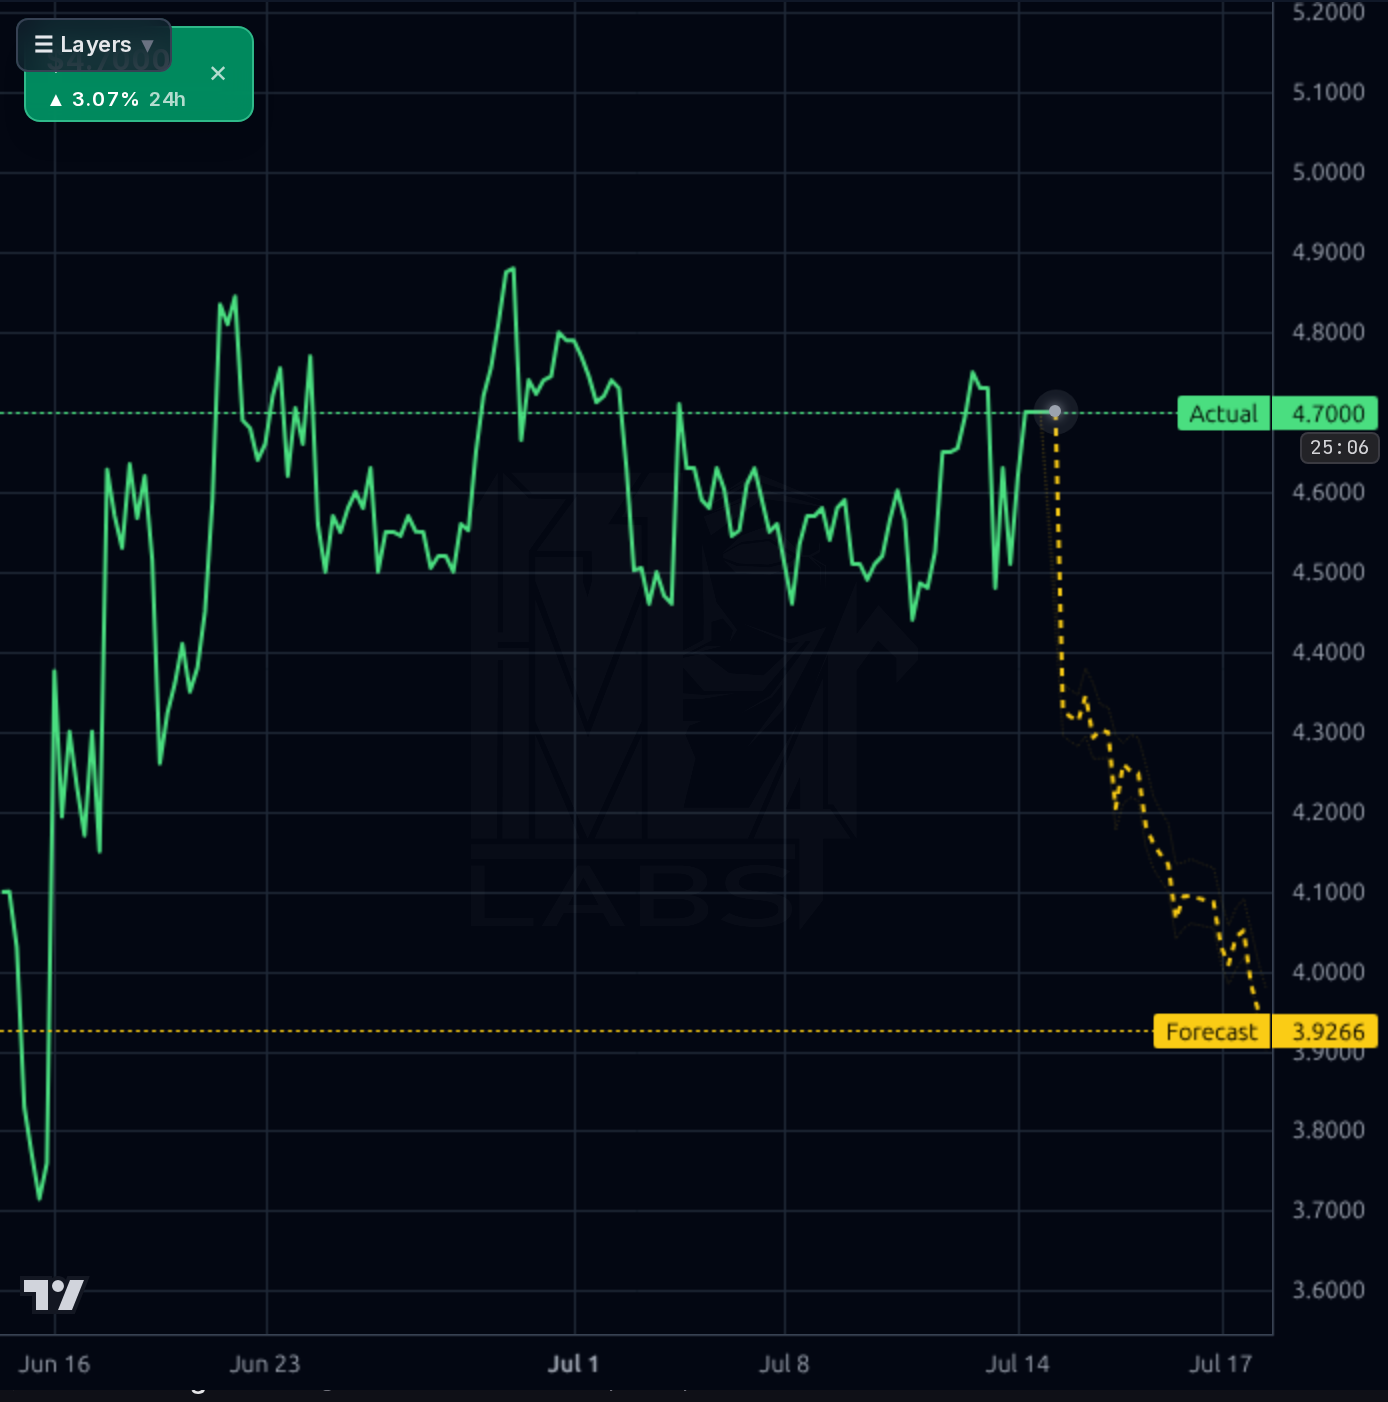
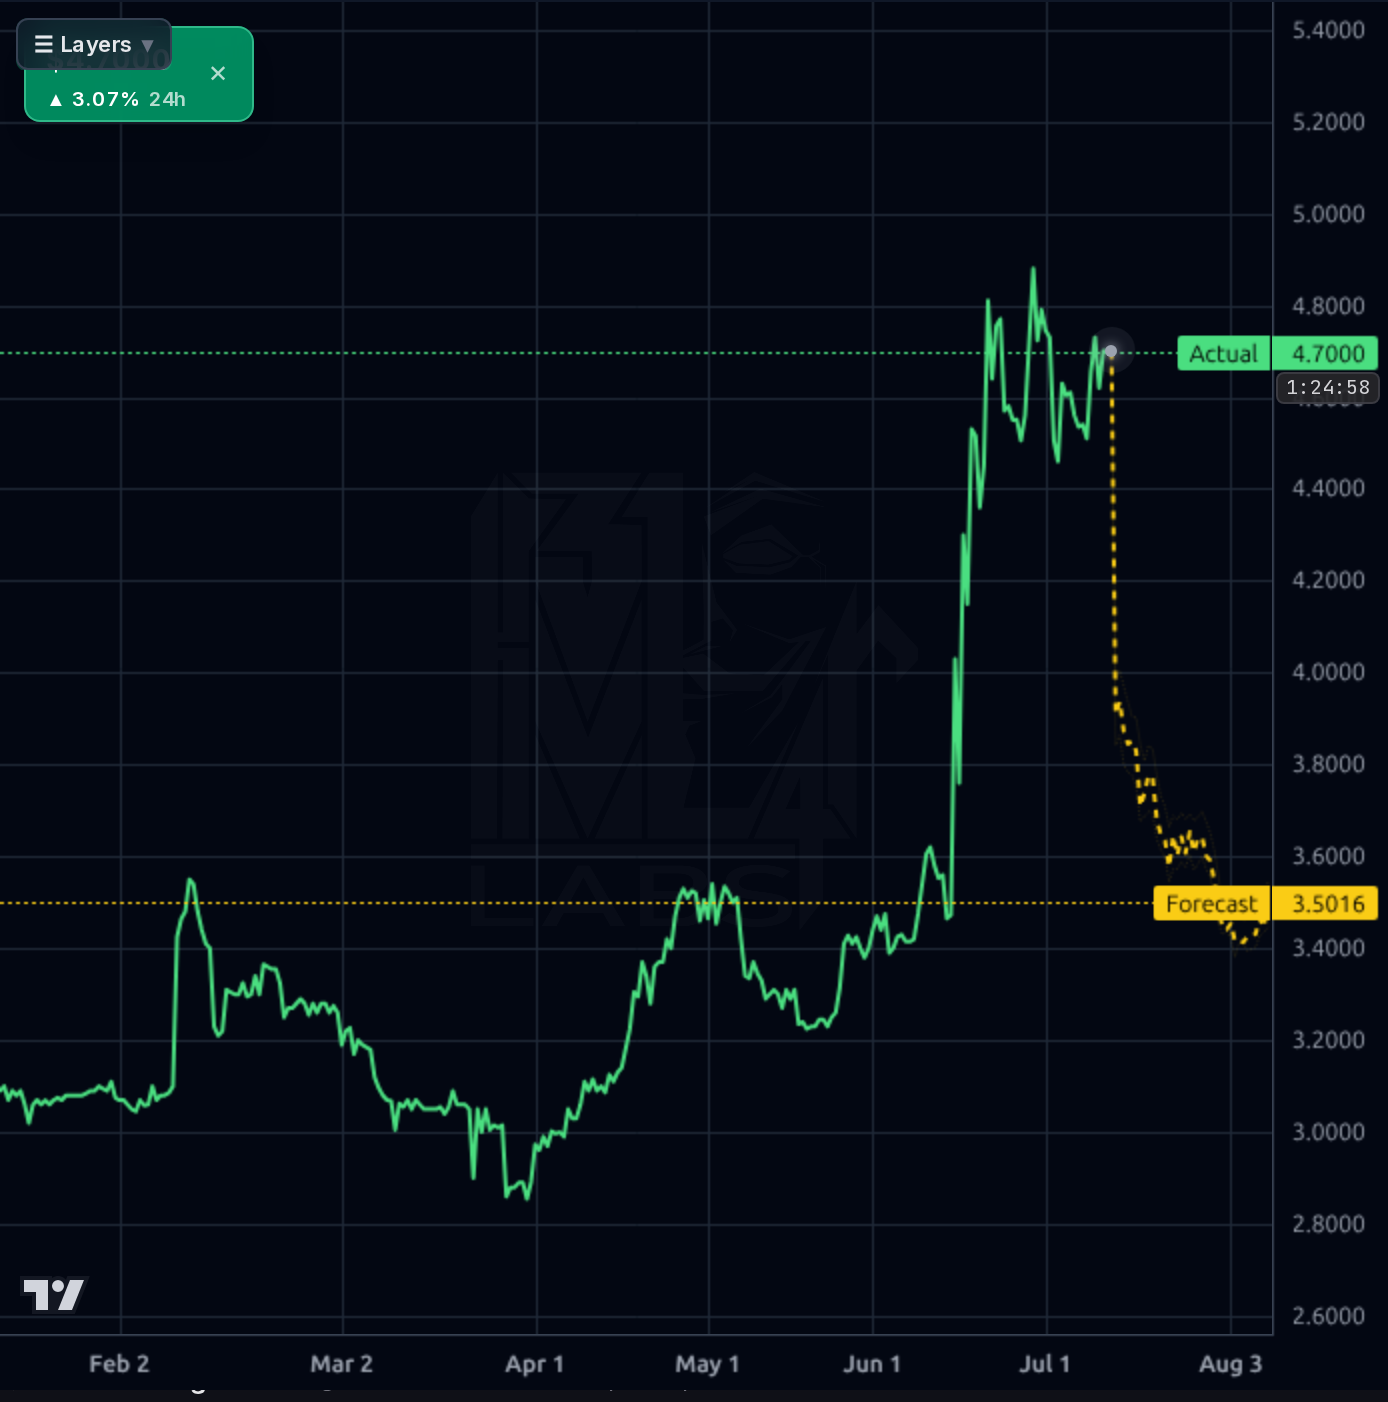
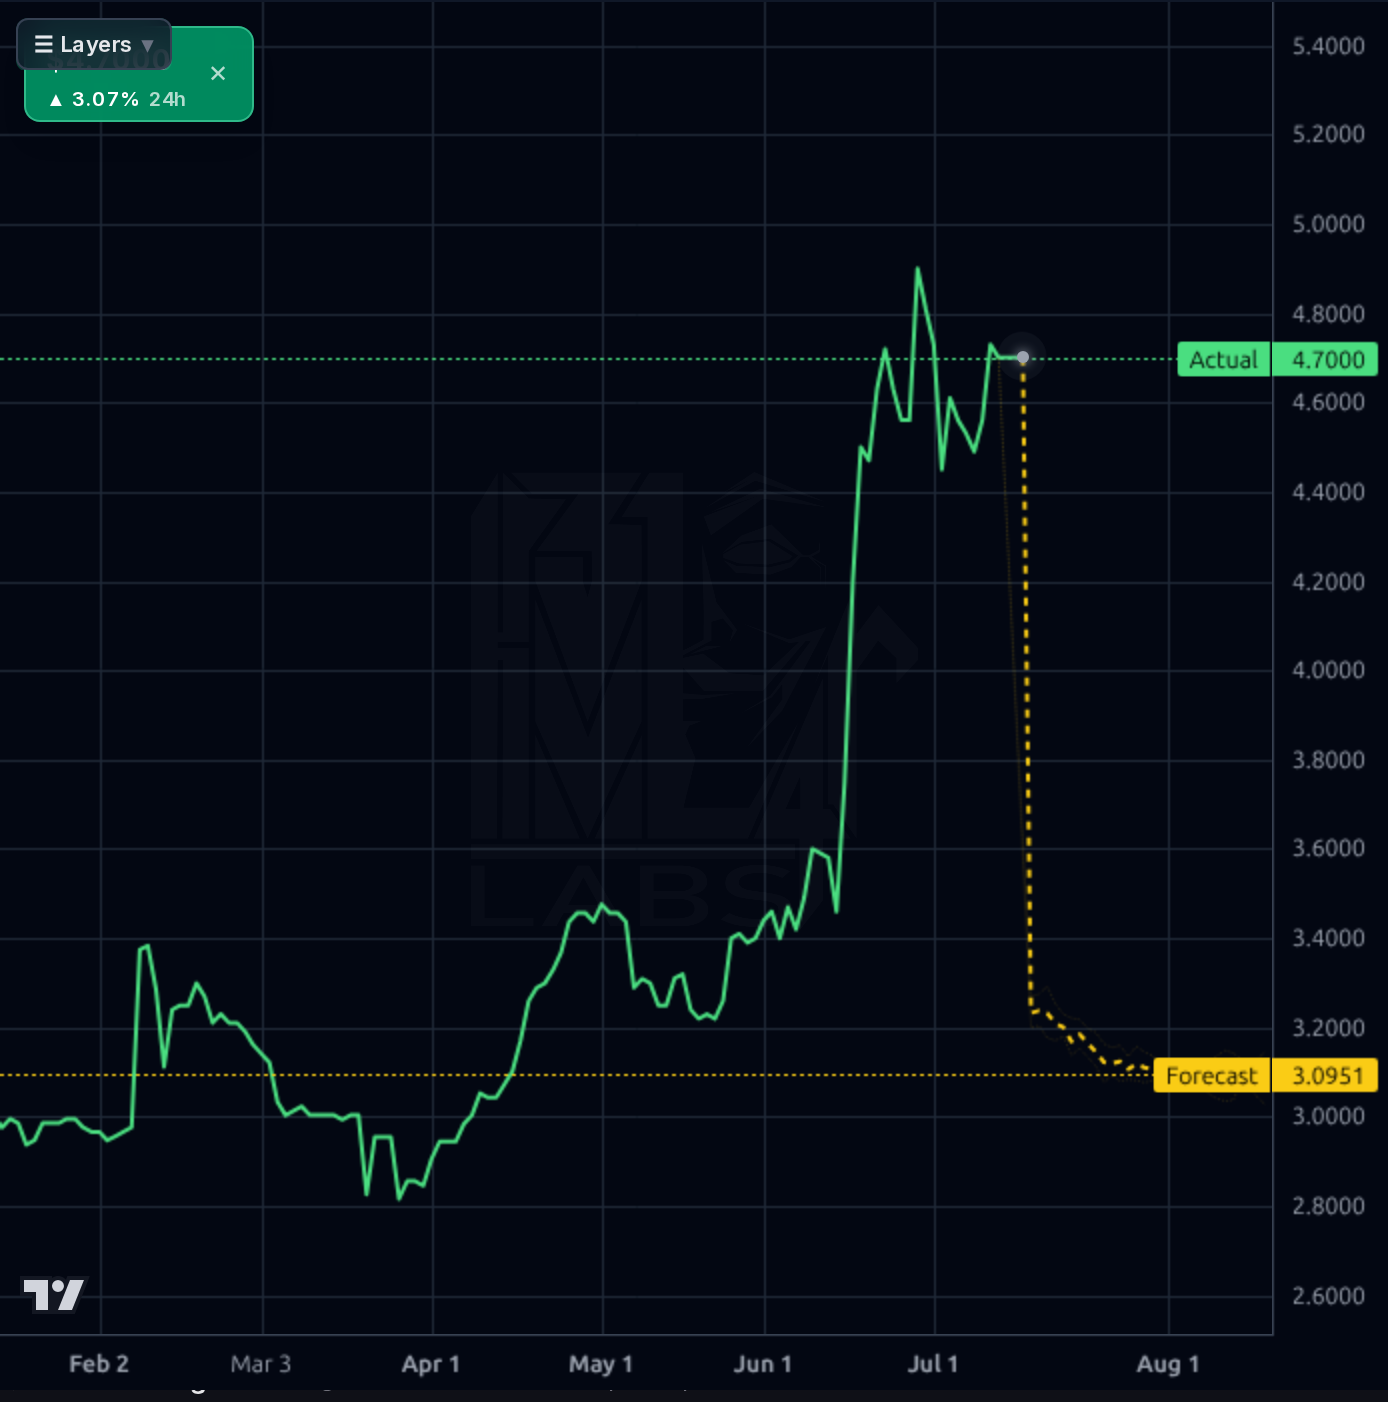
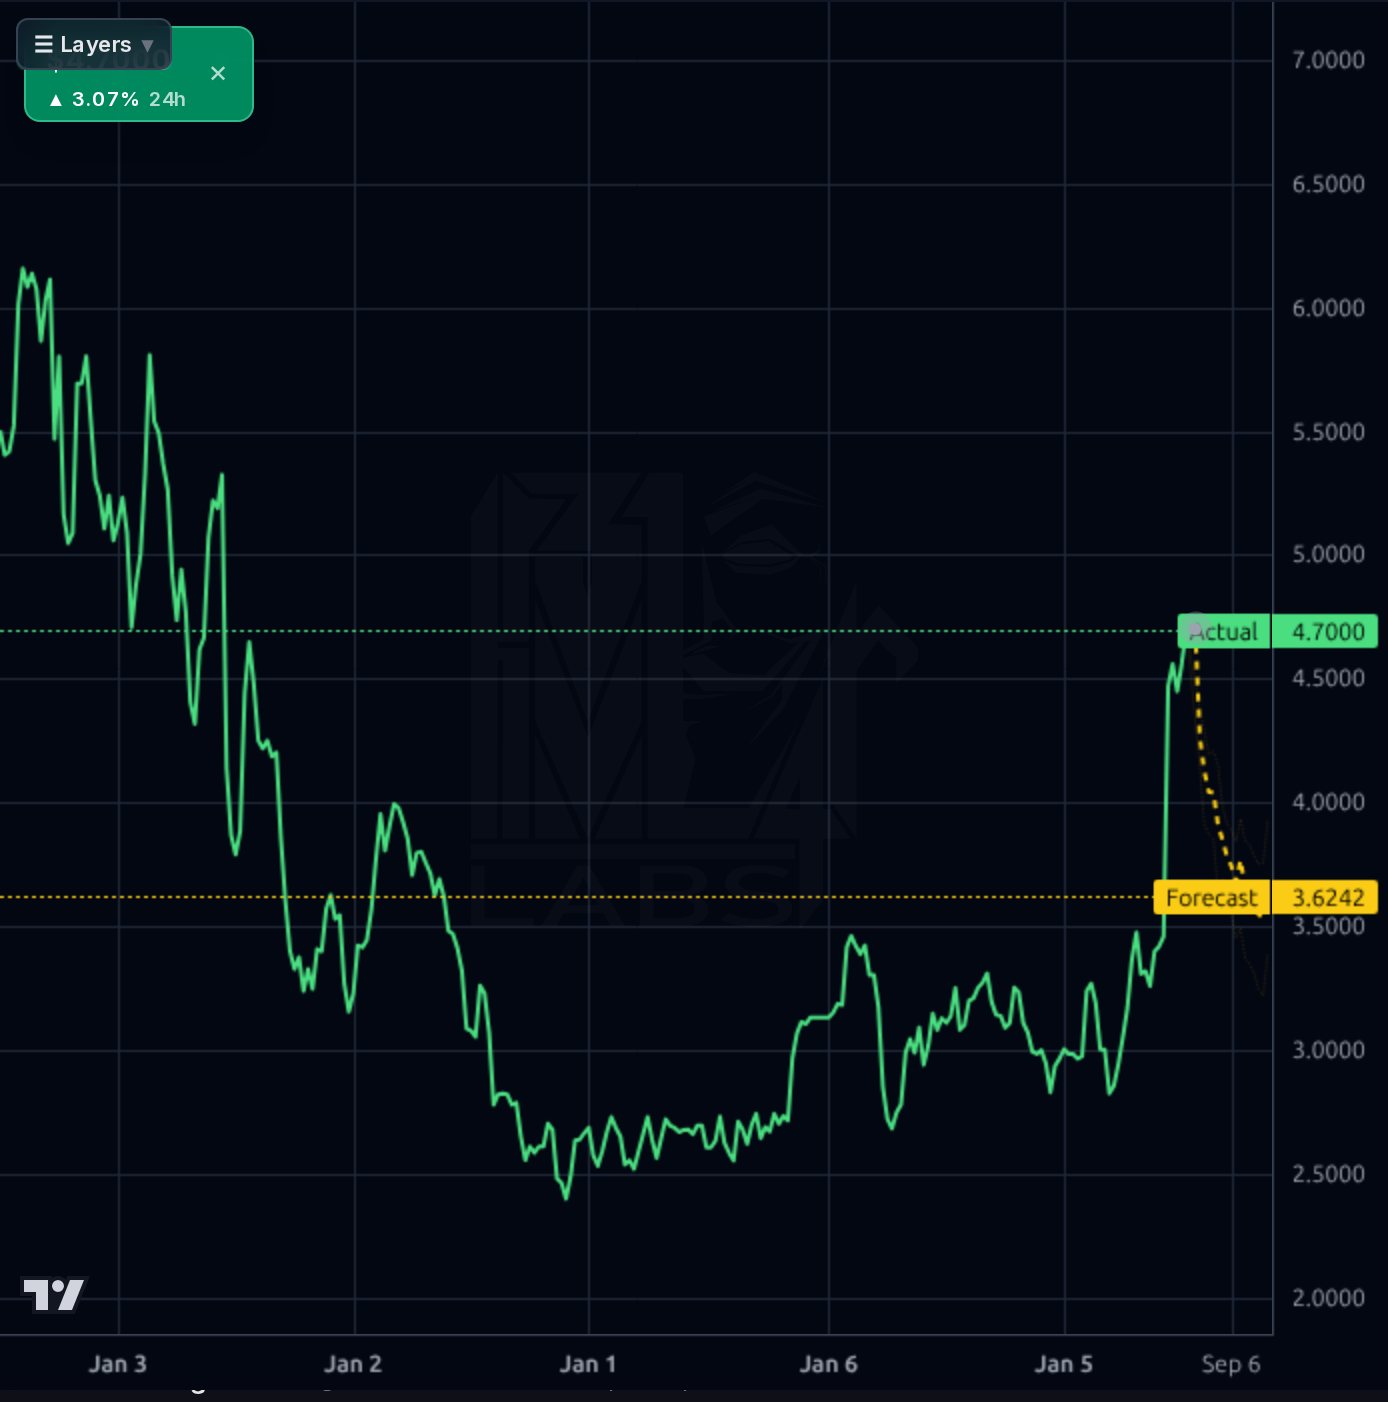
1-4 weeks: this window runs directly into the Aug 11 earnings print (~28 days), a binary event on a 4.4% daily-volatility micro-cap — do NOT size a full swing position into it. Explicit earnings stance: hold only a starter/half position through the print. Tactically, accumulate a starter (≤1% of portfolio; float is only 5.7M shares and Rel Volume 0.24, so use limits) on dips into $4.40-4.50 support; add nothing above $4.90 pre-earnings. Invalidation: a daily close below $4.30 breaks the consolidation floor and opens the gap-fill toward $4.00/$3.60 that the AI forecast is pointing at — step aside there. Pre-earnings target is a retest of $4.90-5.10 only.
1-6 months: the thesis is a re-rating story — if Q1 (Aug 11) prints within the guided $47.5-48.3M range and gross margin holds ≥16%, the stock is trading at ~9x forward EPS with 40%+ EPS growth, a 4.2% yield, and below book value, which supports a move through $5.47 toward $6.00-6.80. Expected return range roughly -20% (gap-fill on a guide-down or margin miss) to +40% (clean beat-and-raise). Catalysts: Aug 11 Q1 results, capacity expansion updates, any US tariff resolution affecting Jordan-sourced apparel (Jordan's FTA status is a competitive advantage if reciprocal tariffs hit Asian competitors). I would change my mind on: revenue guidance cut, gross margin compression below 15%, dividend cut, or a daily close below $3.90.
1-3 years: JRSH is a competent, conservatively financed (net cash-positive equity, D/E 0.13) contract manufacturer whose terminal value depends on whether it can convert its Jordan tariff-advantaged position and customer wins into structurally higher volumes with 17%+ gross margins. If forward EPS of $0.53 grows at even half the projected 30% 5Y rate, a 12-14x multiple supports $8-10 over 3 years while paying a 4% yield. The biggest structural risks: single-region manufacturing concentration in a geopolitically fragile area, customer concentration typical of contract apparel, and permanently thin margins that leave no cushion in a consumer downturn. Note 5Y performance is still -32.5% — this business has burned long-term holders before; the position deserves ongoing skepticism, not buy-and-forget treatment.
Revenue has climbed sequentially for four straight quarters ($39.6M → $42.0M → $41.8M → $42.9M) with the March-2026 quarter up 46.6% Y/Y, and gross margin has improved each quarter from 15.4% to 17.1%. Net margin remains thin (3.7% in Q4, 2.1% TTM) — this is a low-margin apparel contract manufacturer, not a software business — but operating income more than doubled Y/Y and TTM EPS of $0.27 against $0.53 forward EPS implies near-doubling of profitability. Importantly, the prior dossier's characterization of 'extreme leverage (D/E > 13x)' is WRONG and must be corrected: total debt is $8.6M against $64.8M of stockholders' equity (D/E ~0.13), with $10.8M cash, current ratio 2.70, and enterprise value ($58M) below market cap. Cash flow is lumpy (Q4 OCF +$6.0M, FCF +$1.8M after $4.2M of expansion capex; TTM FCF slightly negative at -$2.8M) reflecting working-capital swings and deliberate capacity investment, not distress. The 74.6% dividend payout ratio is high for a thin-margin cyclical but is covered on forward estimates. Valuation is undemanding: 0.36x sales, 5.8x EV/EBITDA, 0.93x book, PEG 0.34 — the market is pricing meaningful skepticism despite the beat and guidance raise.
The 1d and 4h charts show a violent regime change: after months of $2.85-3.50 basing, the June 15 earnings gap took the stock from ~$3.50 to a $4.90 spike, and it has since consolidated in a $4.40-4.90 range — a constructive high-tight flag rather than a failed spike. Price sits +5.3% above SMA20, +23.3% above SMA50 and +42.1% above SMA200 with RSI 65.5 — extended but not overbought, and the ChartMill note confirms it passes the Minervini trend template. Key levels: support at $4.40-4.50 (consolidation floor / 1h swing lows), then the $4.00 round number and gap zone toward $3.60; resistance at $4.90 (post-earnings high) then the $5.47 52-week high. The Kronos forecast is aggressively bearish on every timeframe — 1h to $3.93, 4h to $3.50, 1d to $3.10, 1wk to $3.62 — essentially calling a full gap-fill. However, the model's own scorecard shows it is BEATEN by the naive baseline on both scored horizons (1d: 60% vs 65%; 1wk: 50% vs 67%) with a 31% 1d MAPE, meaning it has systematically failed to handle this post-gap regime; the forecast reads like mean-reversion bias against a structural re-rating and deserves a heavy discount, though it does flag legitimate gap-fill risk if the Aug 11 print disappoints.
The signal is concentrated in the June 15 earnings cycle: Q4 EPS of $0.12 beat the -$0.01 consensus by a wide margin, revenue of $42.9M beat $36.2M estimates by 18.5%, full-year revenue hit a record $166.3M, and — most importantly for forward value — management guided Q1 sales to $47.5-48.3M versus a $42.3M street estimate, a ~13% guide-up that implies continued 20%+ Y/Y growth. The earnings call flagged capacity expansion plans (visible in the $4.2M Q4 capex) alongside margin pressure and geopolitical risk, consistent with a Jordan-based manufacturer navigating tariff dynamics; the recent 10-K risk-factor update noted new bank facilities, a mortgaged property loan, and US reciprocal-tariff exposure. The July 6 ChartMill piece flagging Minervini trend-template compliance is derivative momentum coverage, not new information.
- Q1 FY2027 sales guided to $47.5-48.3M vs $42.3M consensus — a ~13% guide-up implying continued ~20%+ Y/Y growth into the Aug 11 print
- Capacity expansion underway: $4.2M capex in the March quarter (vs <$0.5M in prior quarters) plus new bank facilities disclosed in the 10-K to fund it
- Gross margin improving four quarters running (15.4% → 17.1%), giving operating leverage on 46.6% revenue growth (Q4 operating income up >2x Y/Y)
- Forward EPS of $0.53 vs $0.27 TTM implies near-doubling of earnings; PEG of 0.34 means growth is not yet priced
- Potential relative tariff advantage: Jordan-based, duty-favored manufacturing vs Asian competitors amid US reciprocal-tariff escalation flagged in company risk disclosures
- Binary Aug 11 earnings event: 4.4% daily volatility micro-cap with a large unfilled gap from $3.50 — a miss likely triggers the gap-fill the AI forecast projects (~$3.10-3.60)
- Structurally thin margins (2.1% TTM net) — a few points of input-cost or pricing pressure erases profitability entirely
- Geopolitical/supply-chain concentration in Jordan; US reciprocal-tariff regime explicitly cited in updated 10-K risk factors
- Micro-cap liquidity trap: $60M cap, 5.7M float, 50% insider ownership, only 9% institutional — exits are expensive in a drawdown, and Rel Volume of 0.24 shows interest already fading
- 74.6% dividend payout ratio on lumpy cash flow (TTM FCF -$2.8M) — a dividend cut would break the income-support leg of the thesis
- Momentum crowding: +52.6% in a quarter, +31.8% in a month, single-analyst $6 target and 100%-bullish (spam-heavy) retail chatter — sentiment is one-sided
- AI forecast is bearish across ALL four timeframes; even discounted for its sub-baseline accuracy, unanimity flags real mean-reversion risk in the post-gap consolidation
Get AI analysis on any stock
This is one of hundreds of Kronos AI reports — scored fundamentals & technicals, bull/base/bear price targets, a multi-horizon plan, and continuously-updated forecasts across the market. Create a free account to explore them all.
Create your free account →Already a member? Sign in · Join our Discord