KBH — AI Stock Forecast & Price Targets
Published 7/31/2026 · A free sample of K3vl4r’s AI-powered analysis.
Kronos price forecasts, scored fundamentals & technicals, and a multi-horizon plan.
View the live KBH price forecast →
KB Home (KBH) shows resilience in its cyclical housing business with recent price recovery from $51 to $56.35, supported by strong fundamentals including 4.9% profit margins and a 12.6% short float. However, the stock faces near-term headwinds from weak quarterly earnings growth (-27.27% sales Q/Q) and elevated debt-to-equity (52.64x), while technicals indicate consolidation around $56 with Kronos AI forecasts suggesting a narrow range between $55.270 and $57.914.
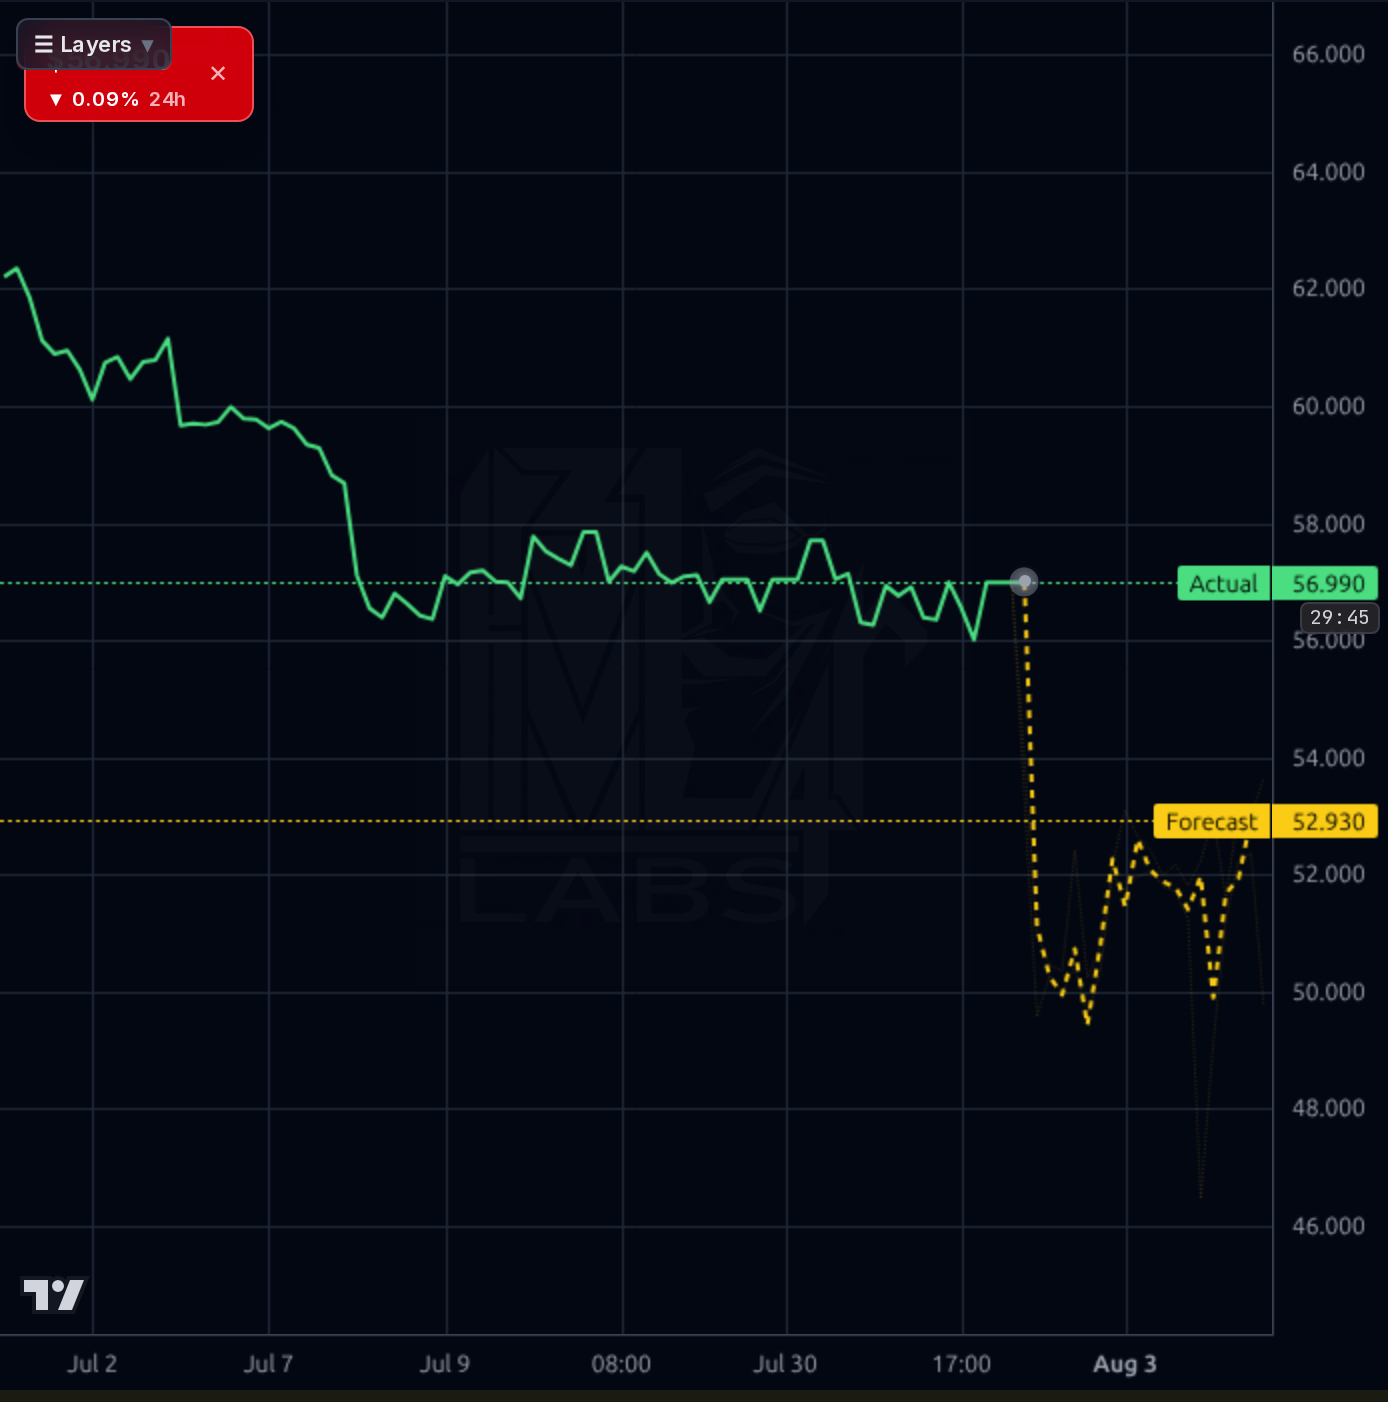
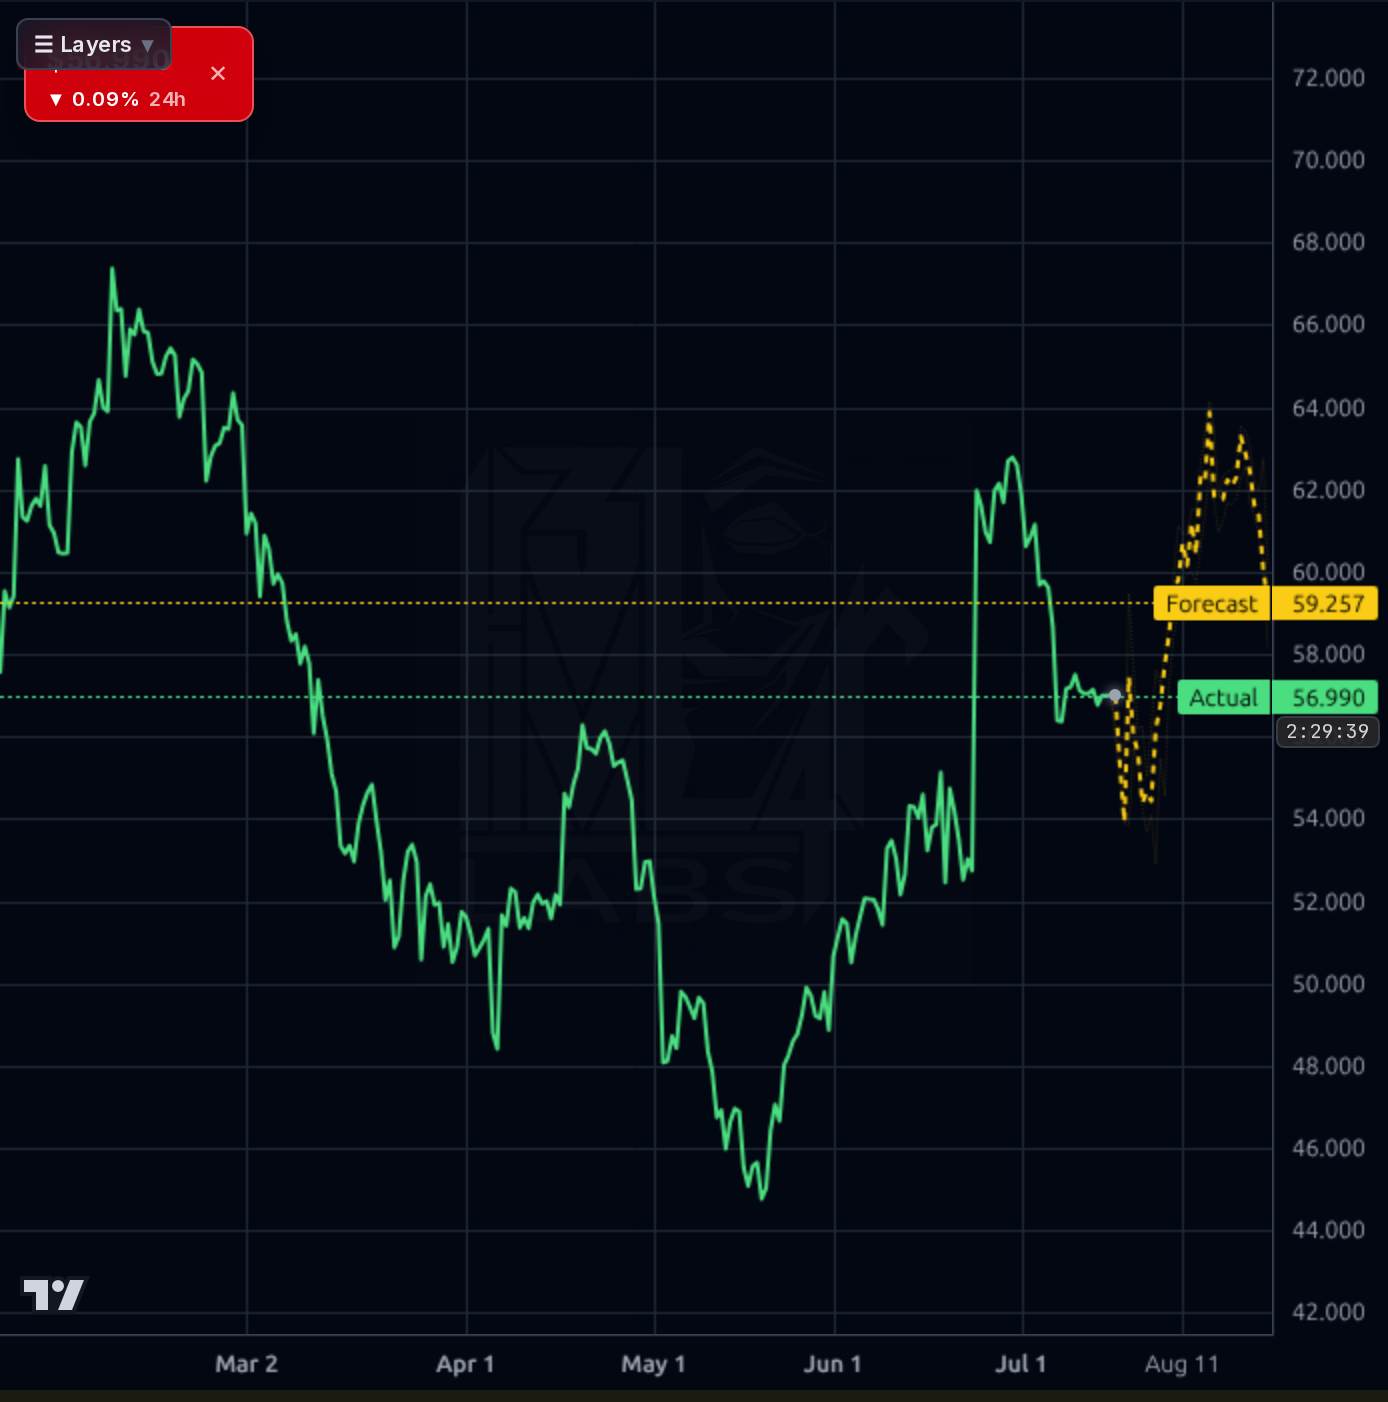
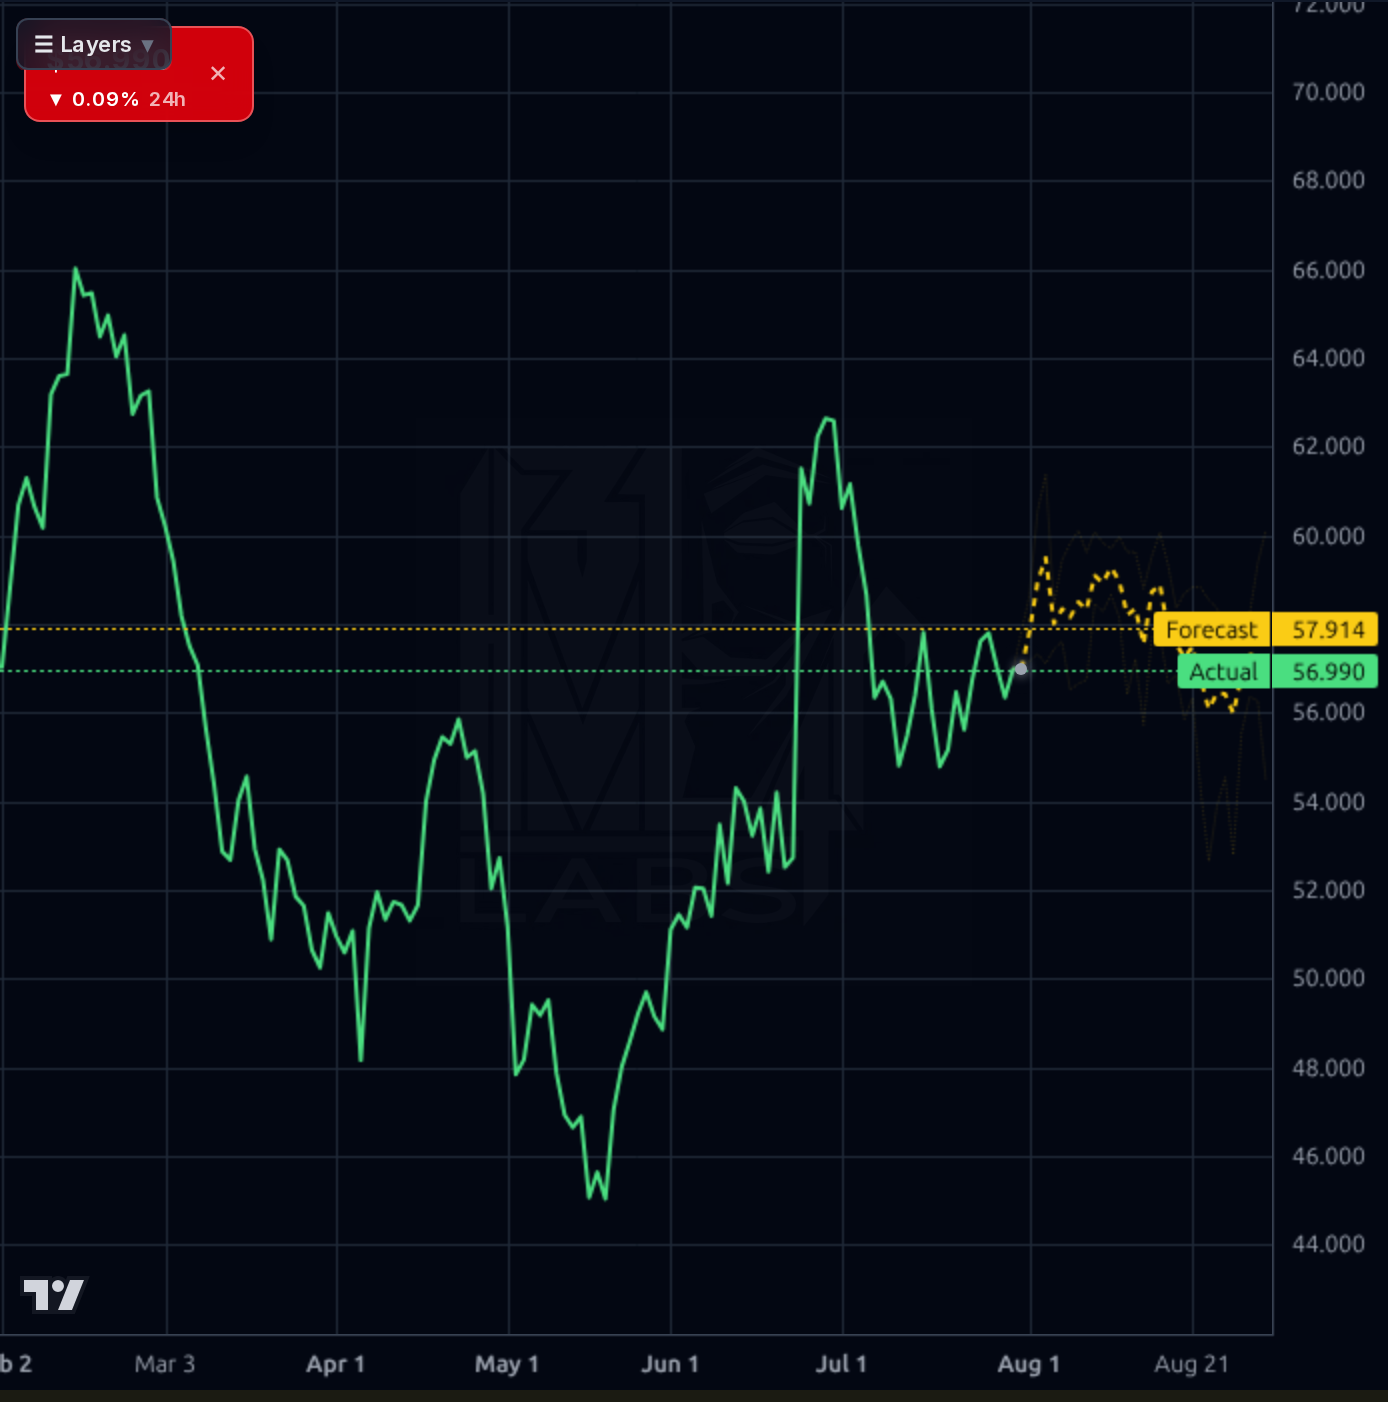
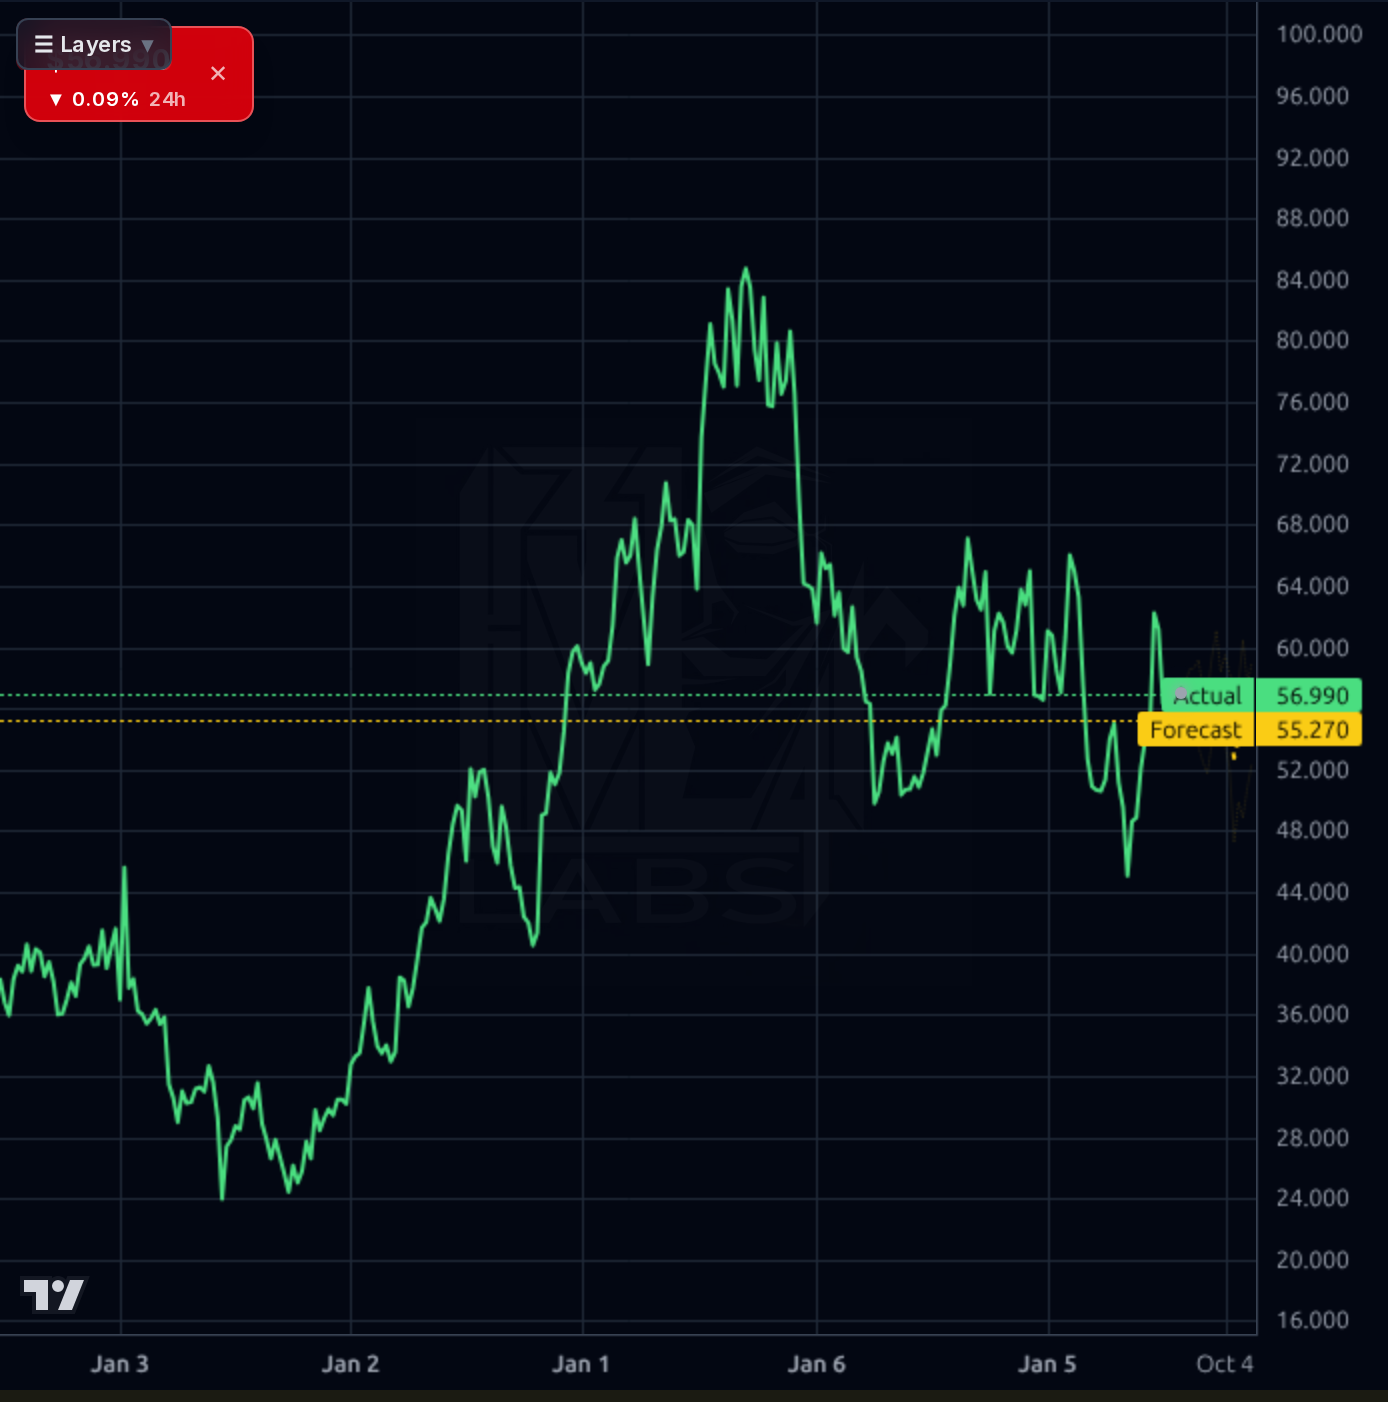
Hold near $56.35; break below $44.03 invalidates the uptrend. Target: $58.67 (current target), but monitor for insider selling and weak earnings growth. Invalidation level: $52.91 (derived from 52W Low).
Wait for Q3 earnings to confirm recovery; if sales grow >-10% from current levels, re-enter at $44.03. Catalysts include housing demand rebound or M/I Homes' success. Risk of continued margin compression remains.
Long-term potential hinges on housing market stabilization and new home construction growth. Structural risk is high due to interest rate sensitivity; if rates rise further, the stock could face renewed pressure. Terminal value depends on normalized margins (17-18%) and debt reduction.
Revenue has declined significantly (-27.27% Q/Q) amid cyclical pressures, though gross margins remain robust at 17.02%. The company maintains a strong balance sheet with $3.27 cash per share and a current ratio of 6.80, but debt-to-equity stands at 52.64x, indicating high leverage. Operating cash flow has been volatile (-$125M in Q2), though free cash flow remains positive ($290M). The dividend yield (1.75%) is attractive but may face pressure if earnings continue to decline.
The chart shows a consolidation phase around $56 with the Kronos AI forecast band tightly clustered between $55.27 and $57.91, indicating low volatility. Support at $54.03 (52-week low) is critical; breaking above $58.67 (target price) would signal a bullish breakout. The 20-day SMA (-0.90%) suggests short-term weakness, while the 50-day SMA (+3.00%) indicates longer-term stability. Recent insider selling by CEO McGibney and Chairman Mezger ($1.1M + $4.9M) adds caution.
Recent news highlights KB Home's cyclical challenges: Q2 sales fell -27.27% YoY, while M/I Homes reported stronger growth (+15% new contracts). The stock has recovered from a low of $44 to $56.35, but the 12.6% short float and insider selling suggest caution. The Kronos AI forecast band ($55.27-$57.91) aligns with the current price, indicating limited upside momentum.
- M/I Homes' record Q2 contracts (+15% sales) suggest housing demand resilience despite higher mortgage rates
- Elevated debt-to-equity ratio (52.64x) increases vulnerability to interest rate hikes
- Cyclical downturn in housing market could extend earnings decline beyond current levels
Get AI analysis on any stock
This is one of hundreds of Kronos AI reports — scored fundamentals & technicals, bull/base/bear price targets, a multi-horizon plan, and continuously-updated forecasts across the market. Create a free account to explore them all.
Create your free account →Already a member? Sign in · Join our Discord