KRMN— AI Stock Forecast & Price Targets
Published 7/3/2026 · A free sample of K3vl4r’s AI-powered analysis.
Kronos price forecasts, scored fundamentals & technicals, and a multi-horizon plan.
View the live KRMN price forecast →
Karman is a fast-growing space/missile-defense supplier (TTM sales +44%, Q/Q +51%, pipeline tripled to ~$3B) that has been cut in half from its $118 high after an $854M secondary and a Citi price-target cut to $76. The stock is basing above ~$54-56 with strong recent momentum (+21.8% on the week) and the Kronos model is aggressively bullish across timeframes, but the valuation (245x trailing, 61x forward P/E), 2.14x debt/equity, negative free cash flow, and an Aug 6 earnings binary argue for scaling in rather than chasing. Accumulate on dips with the June low near $44-46 as thesis invalidation.
1-4 weeks: small starter long (quarter to third of intended position) on a confirmed close above $55, adding on a reclaim of $60-61 (secondary pricing level). The model's 1-4 day directional accuracy (70-100%) supports near-term upside, and short float of 9.38% (3.1 days to cover) adds squeeze fuel toward $62-66. Do NOT hold full size into the Aug 6 earnings print (~34 days out) — it is a binary event; any target here is pre-earnings only. Invalidation: a close back below $50 kills the bounce; below $47 exit entirely. Take partial profits into $62-66 pre-earnings.
1-6 months: constructive. Thesis is backlog/pipeline conversion ($3B pipeline vs $522M TTM revenue) driving 40-50% revenue growth with stable ~15% operating margins, re-rating the stock toward the Citi $76 target as the secondary overhang digests. Expected return range: -20% to +45% ($45 to $80). Catalysts: Aug 6 earnings (need OCF improvement and backlog-to-revenue conversion evidence), new hypersonics/missile-defense contract awards, further hedge fund accumulation. What changes my mind: FCF deteriorating further, another sponsor secondary below $55, gross margin slipping under 38%, or debt rising again without revenue acceleration.
1-3 years: attractive secular positioning — sole/critical supplier content in hypersonics, strategic missile defense, and space launch, markets with multi-year budget tailwinds. If Karman compounds revenue ~30% (in line with its 27.7% 3-yr sales CAGR) and net margin expands from 5.7% toward 10%+, EPS could reach $1.50-2.00 by 2028, supporting $90-120+. The biggest structural risks are the sponsor-controlled ownership (TCFIII overhang and eventual full exit), the 2.14x leverage in a rising-capex business that doesn't yet self-fund, and dependence on U.S. defense appropriations cycles. This is a hold-through-volatility name only if cash conversion inflects positive within 4-6 quarters.
Top-line momentum is genuine: quarterly revenue stepped from $115.1M (Jun-25) to $121.8M, $134.5M, and $151.2M (Mar-26), a ~31% sequential ramp in four quarters, with gross margin steady around 40-42% and operating margin in the 14-18% band. But quality lags growth. Net margin is thin (~5.2-5.7%), TTM EPS is only $0.23, and cash generation is weak: operating cash flow was just $0.2M in the March quarter, free cash flow was -$7.2M, and TTM FCF is roughly -$40M. The balance sheet has levered up materially — total debt jumped from $587M to $867M in the March quarter against $405.7M of equity (D/E 2.14, LT D/E 2.11) and only $73.8M of cash, presumably funding capacity/backlog. Current ratio of 3.53 gives working-capital cushion, but ROE of 7.9% and ROIC of 2.38% mean returns don't yet cover the cost of that capital. Valuation prices in flawless execution: 249x trailing P/E, 61x forward, 14.3x sales, 54.6x EV/EBITDA — the only redeeming metric is a PEG of 1.20 given ~51% projected 5-year EPS growth. The May secondary (14M shares at $61) was selling stockholders cashing out (TCFIII sponsor overhang), not primary capital, which explains part of the -32% quarterly performance. This is a growth story with fragile financial quality: what's working is demand and margin stability; what's broken is cash conversion and leverage.
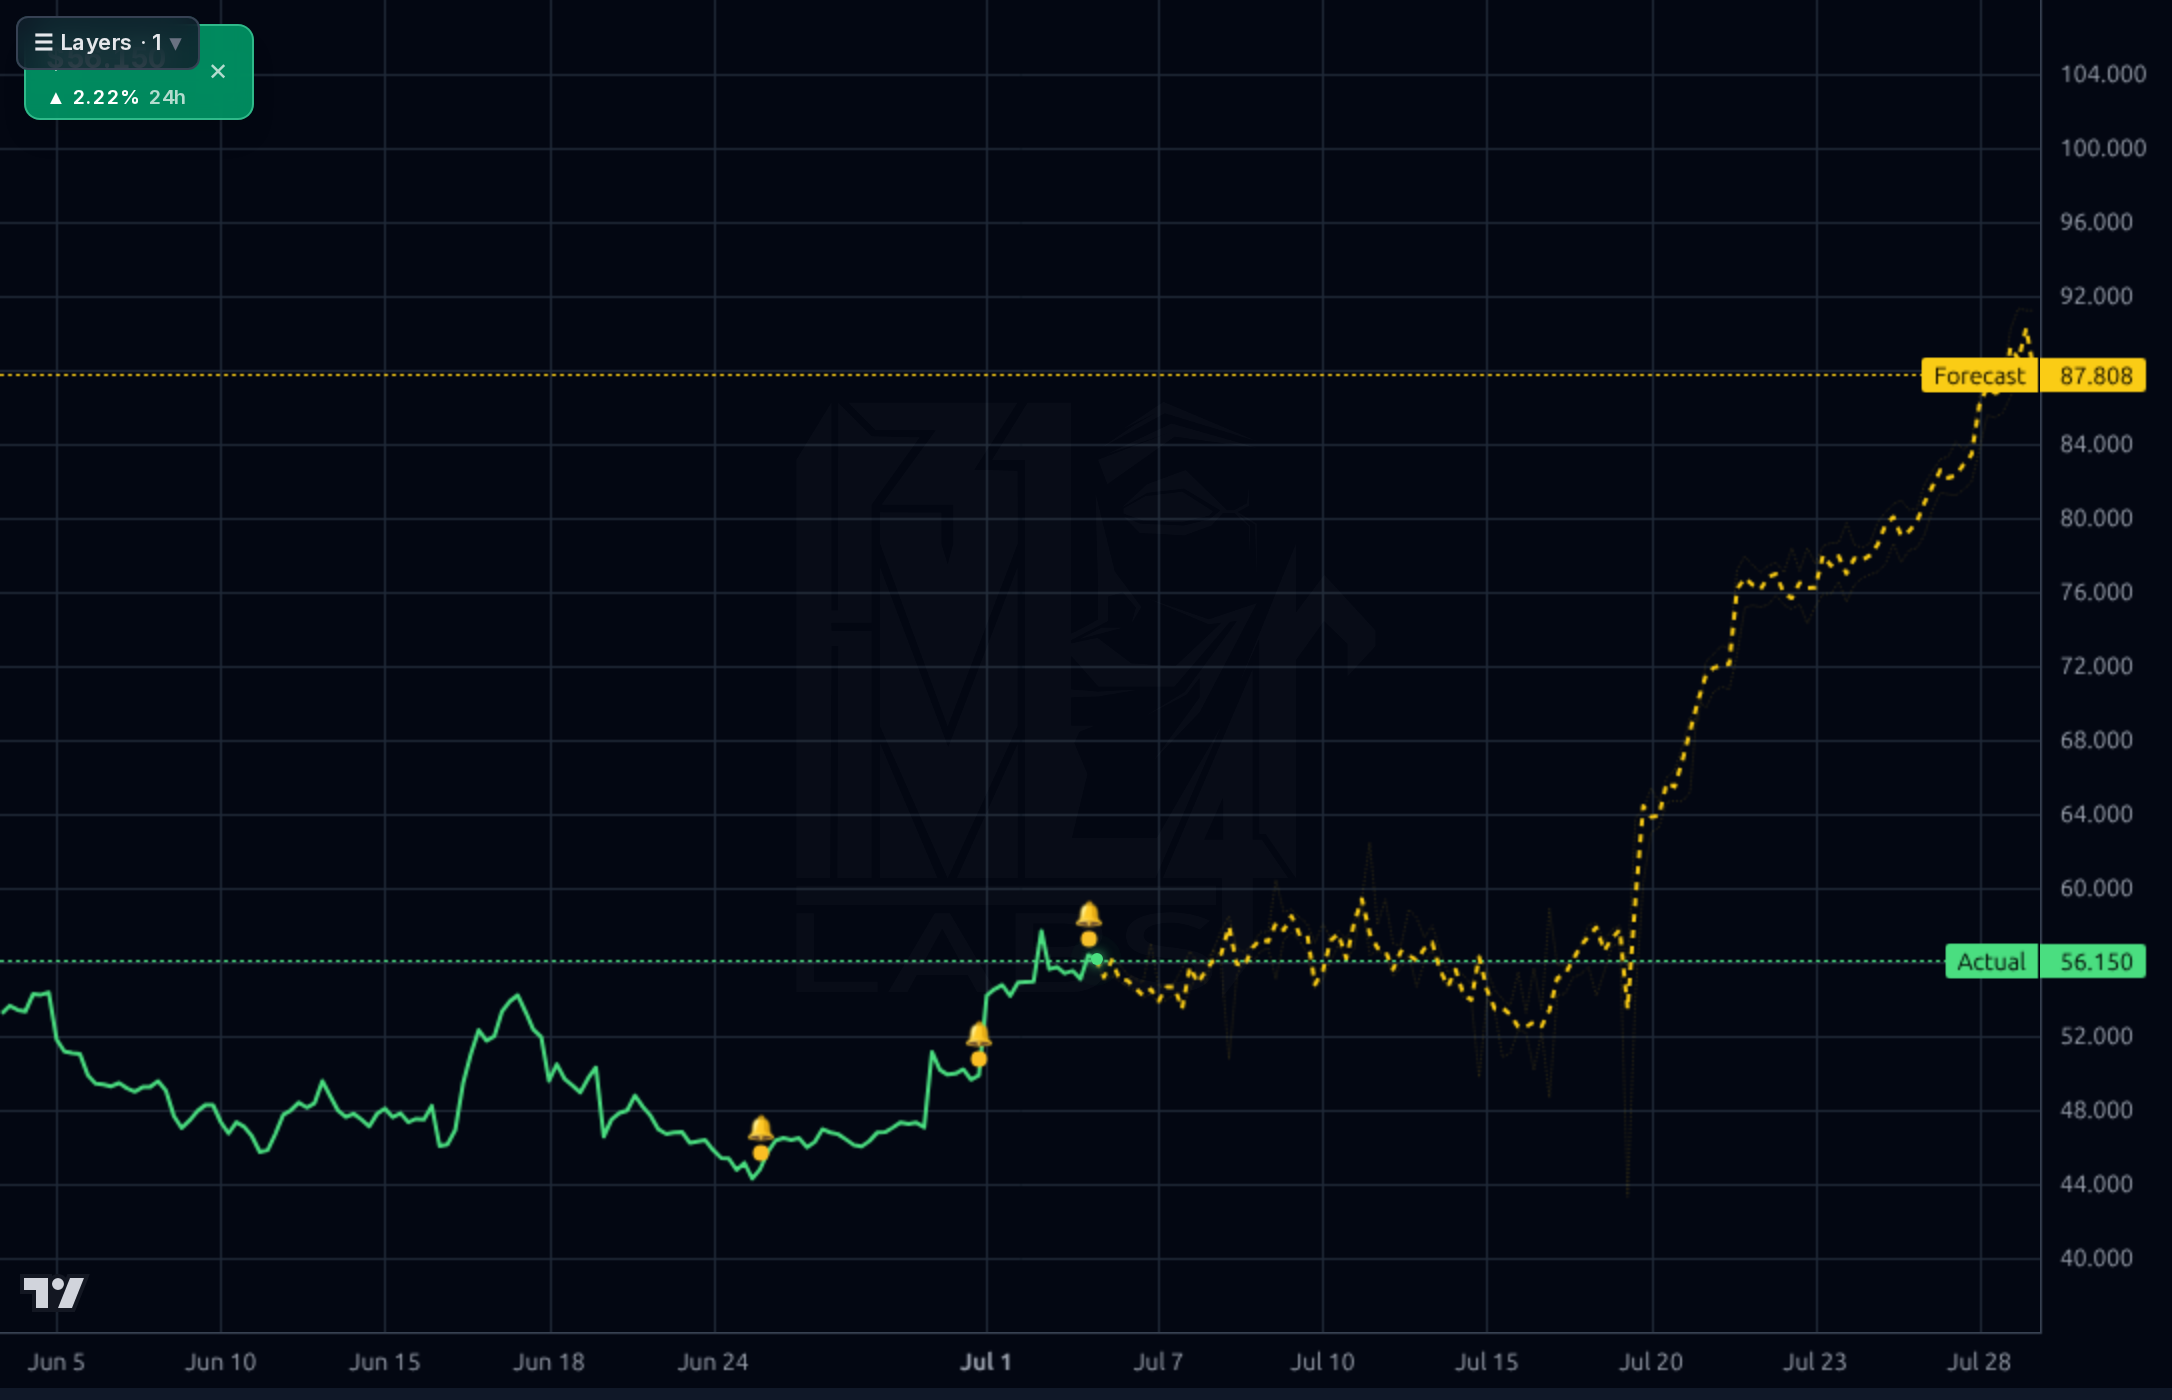
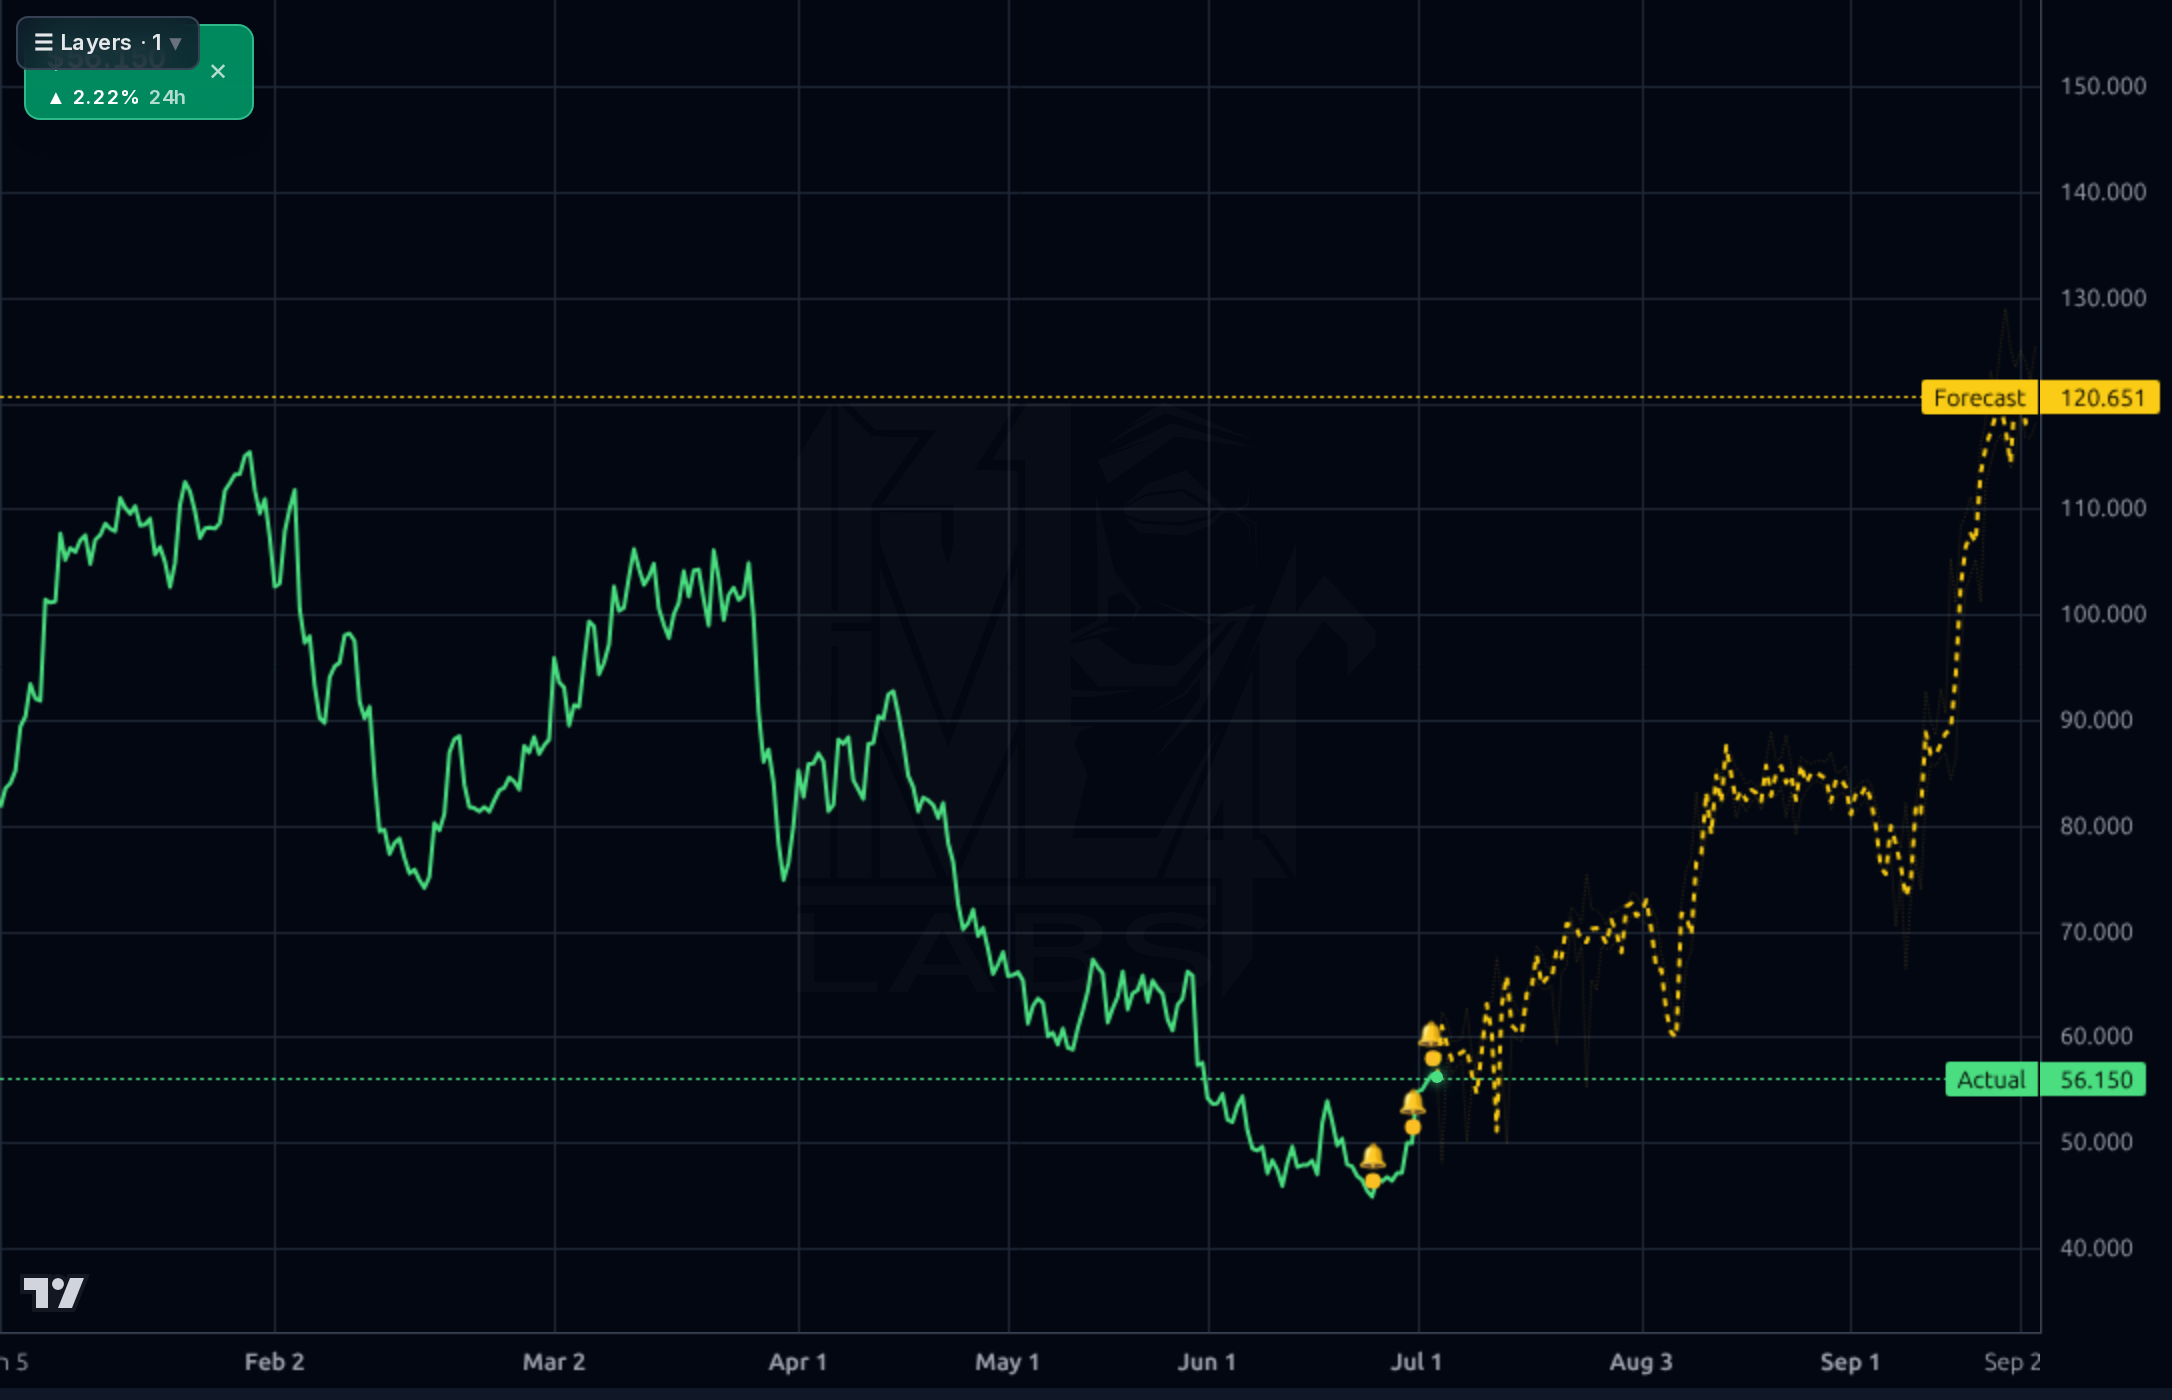
The daily/weekly charts show a brutal H1-2026 downtrend from ~$115 (February) to the June low near $44-46 (52-wk low $43.49), followed by a sharp V-bounce to $56.15 — price is +14.2% above the 20-day SMA but still -3.5% below the 50-day and -26.7% below the 200-day, so this is a countertrend rally inside a bear structure until ~$60-62 (the secondary pricing at $61 and prior breakdown zone) is reclaimed. Momentum is constructive but not overbought: RSI 55.9, +21.8% on the week, +2.6% on the day, with elevated volume (1.17x relative). Key support: $54-55 (retail is watching a $55 close), then $50, then the $44-46 invalidation zone. Resistance: $60-61, then $70-72, then the $76 Citi target. The Kronos forecasts are uniformly and aggressively bullish — 1h to ~$87.8, 4h to ~$120.7, 1d/1wk to ~$72 — but must be heavily discounted: realized 1d accuracy is strong only at 1-4 day horizons (100%/80%/70%/78% vs baseline) and collapses to 14-38% at 6-8 days (well below the ~65-71% naive baseline), with 13% MAPE overall. So the model's near-term upward bias is credible; its magnitude at multi-week horizons (the $88-120 prints) is not reliable and should be treated as directional noise. Net read: bottoming pattern with confirmed short-term upward momentum, needing a $61+ reclaim to convert to a trend change.
Signal: (1) Citigroup maintained Buy but cut its target from $97 to $76 on Jul 1 — analyst conviction intact (street Recom 1.45, consensus target $103.50) but marked-down expectations; (2) the May 29 disclosure that the active pipeline reached ~$3B versus ~$1B in March 2025 is the single most important fundamental datapoint, validating the hypersonics/missile-defense/space demand thesis; (3) the upsized $854M secondary at $61 (14M shares, all selling stockholders) created the supply overhang that drove the -32% quarter, and the sponsor (TCFIII) retains more stock to sell — a persistent technical headwind; (4) hedge fund ownership rose from 36 to 43 funds in Q1, and institutional ownership sits at 77.9% with +21.7% institutional transactions, showing smart-money accumulation into weakness.
- Active pipeline tripled to ~$3B as of May 2026 (vs ~$1B in March 2025) — nearly 6x TTM revenue of $522.6M, per the May 29 company disclosure
- Hypersonics and strategic missile defense content: mission-critical payload protection, interstage, and propulsion systems on programs benefiting from record defense budgets
- Revenue ramp already visible: $115.1M → $151.2M quarterly over four quarters (+51% Y/Y in Q1), with EPS Q/Q +262% and consensus EPS growth of ~60% next year / ~51% over 5 years
- Space & launch market exposure alongside defense — diversifies program risk across three end markets named in the company description
- Institutional sponsorship building: hedge fund holders up from 36 to 43 in Q1 2026, 77.9% institutional ownership, +21.7% institutional transactions
- Capacity investment (debt raised to $867M, capex $7.4M last quarter) positions the company to convert the $3B pipeline into backlog and revenue
- Extreme valuation: 249x trailing / 61x forward P/E, 14.3x sales, 54.6x EV/EBITDA — any growth miss triggers violent de-rating (already -52% from the high)
- Negative free cash flow (TTM ~-$40M, OCF barely breakeven at $0.2M last quarter) while carrying $867M debt vs $73.8M cash (D/E 2.14)
- Sponsor overhang: TCFIII/selling stockholders just sold $854M at $61; further secondaries cap rallies
- Aug 6 earnings binary — prior EPS surprise was -9.4%, so execution risk into the print is real
- Low returns on capital (ROIC 2.38%, ROE 7.9%) don't yet justify the leverage taken on
- 9.38% short float cuts both ways — squeeze fuel now, but signals informed bearish positioning on valuation
- Kronos model unreliability beyond ~5 days (directional accuracy 14-38% at 6-8 day horizons, below baseline) — its $88-120 multi-week forecasts should not anchor targets
- Defense appropriations/program timing risk; revenue concentration in U.S. government-adjacent end markets
- Stock remains -26.7% below its 200-day SMA — long-term downtrend not yet reversed; this could still be a bear-market rally
Get AI analysis on any stock
This is one of hundreds of Kronos AI reports — scored fundamentals & technicals, bull/base/bear price targets, a multi-horizon plan, and continuously-updated forecasts across the market. Create a free account to explore them all.
Create your free account →Already a member? Sign in · Join our Discord