LHX — AI Stock Forecast & Price Targets
Published 7/14/2026 · A free sample of K3vl4r’s AI-powered analysis.
Kronos price forecasts, scored fundamentals & technicals, and a multi-horizon plan.
View the live LHX price forecast →
LHX trades at $288.69, down 23.9% from its 52-week high of $379.23, despite a string of high-visibility contract wins (18 AMDT3 missile-tracking satellites for Space Force, FAA aircraft tracking through 2045) that materially de-risk the multi-year backlog. Forward P/E of 21.1x is reasonable for a defense prime with 13.7% projected 5-year EPS growth, but a negative Q1 FCF (-$194M), $11.4B total debt, and a binary earnings print on July 29 argue for measured accumulation rather than aggressive buying. The setup favors patient entry near current levels with pre-earnings discipline.
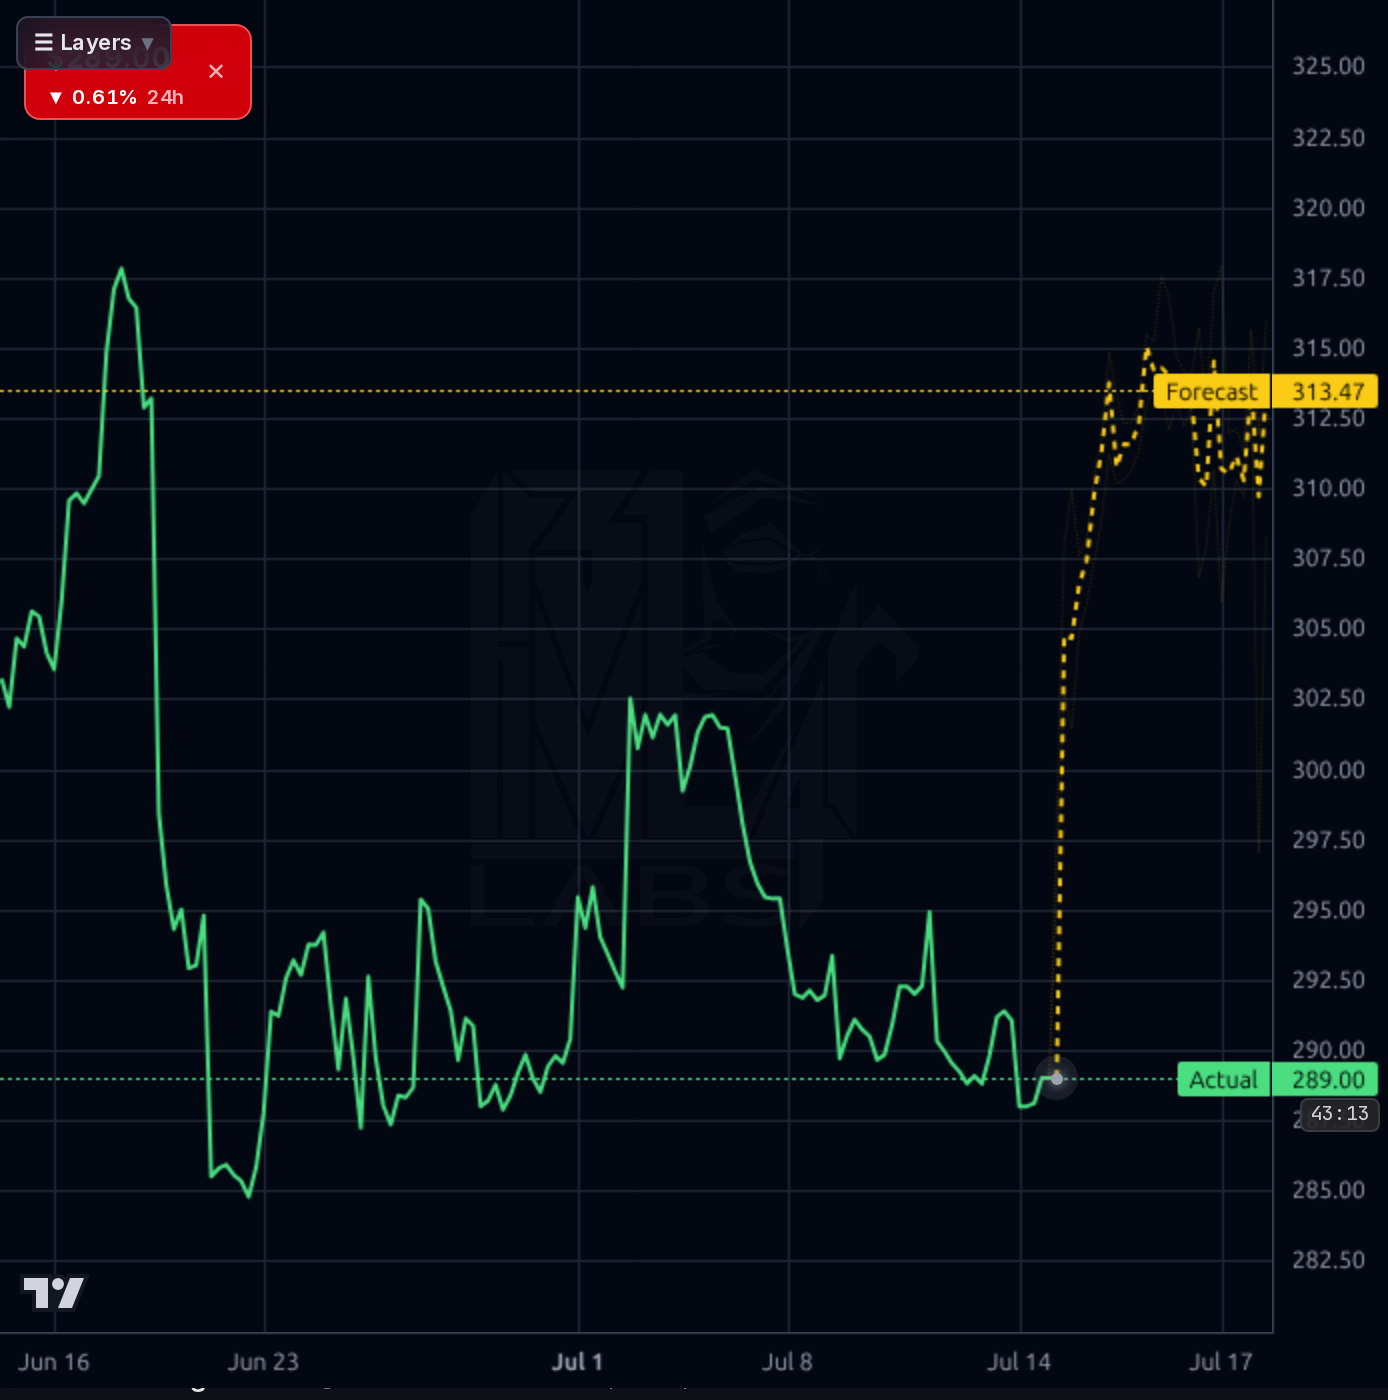
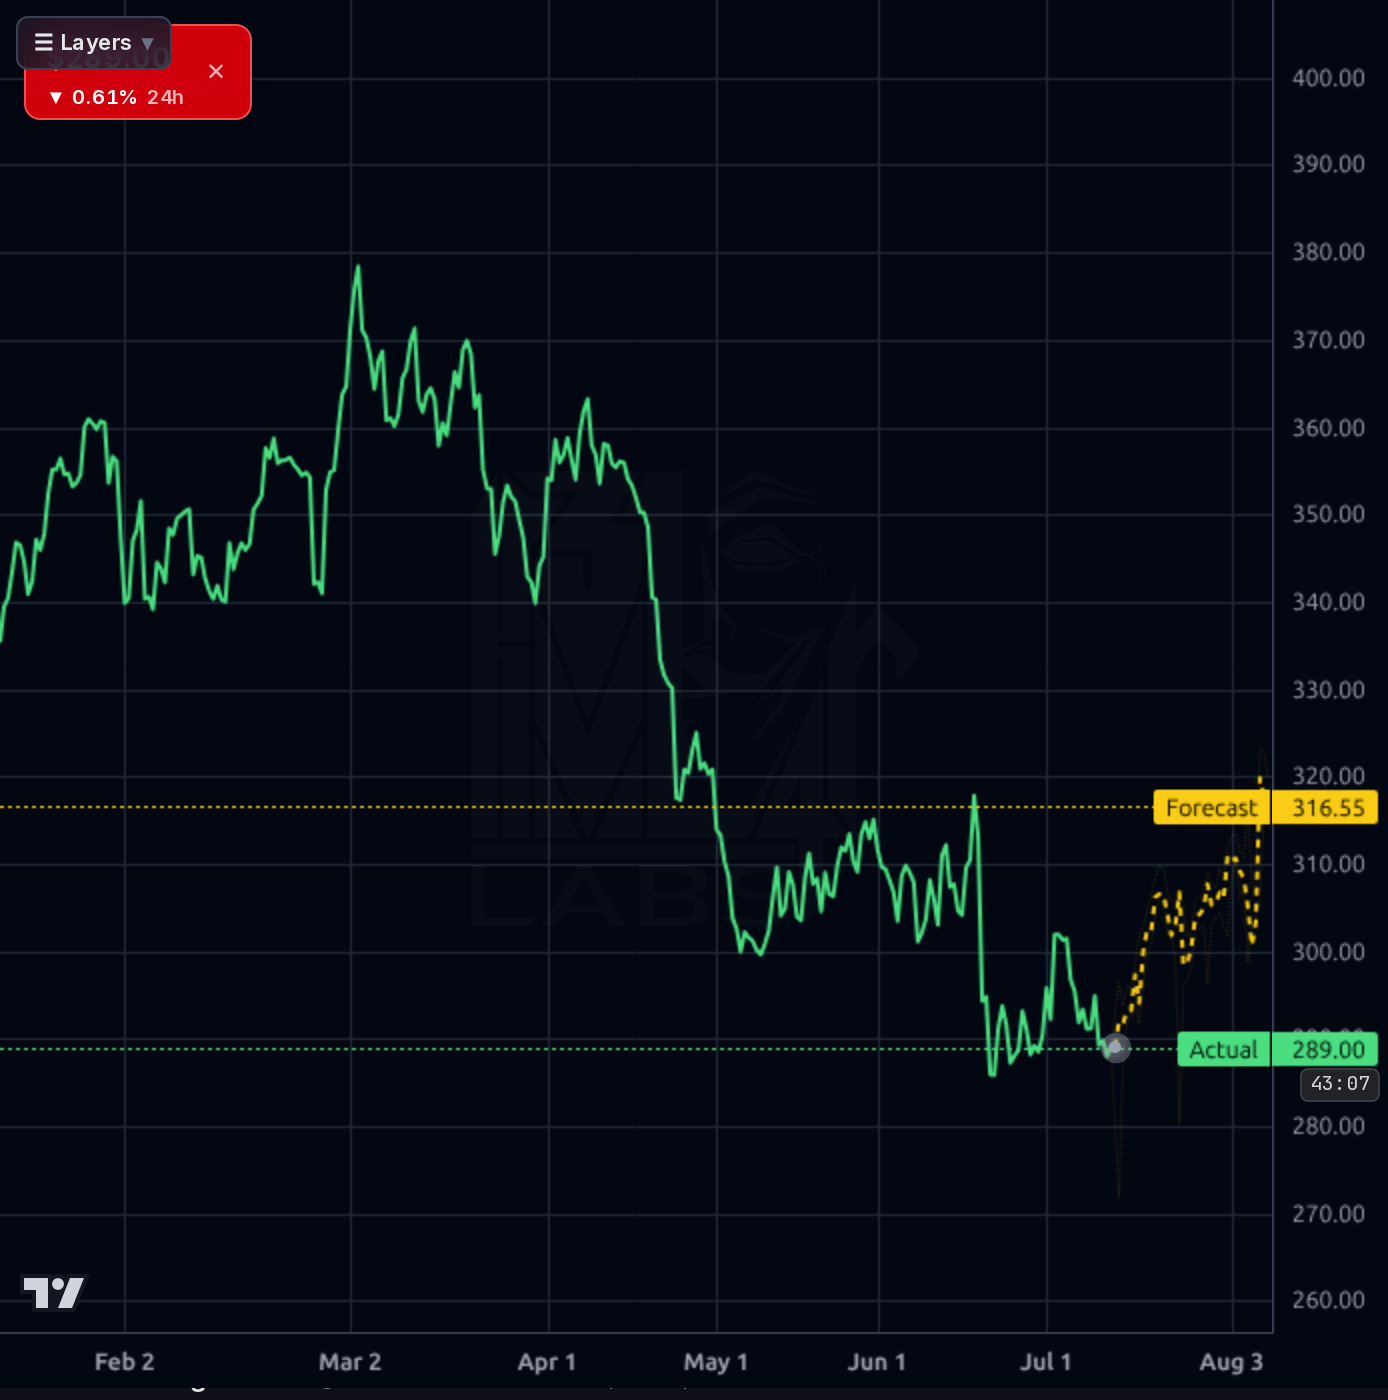
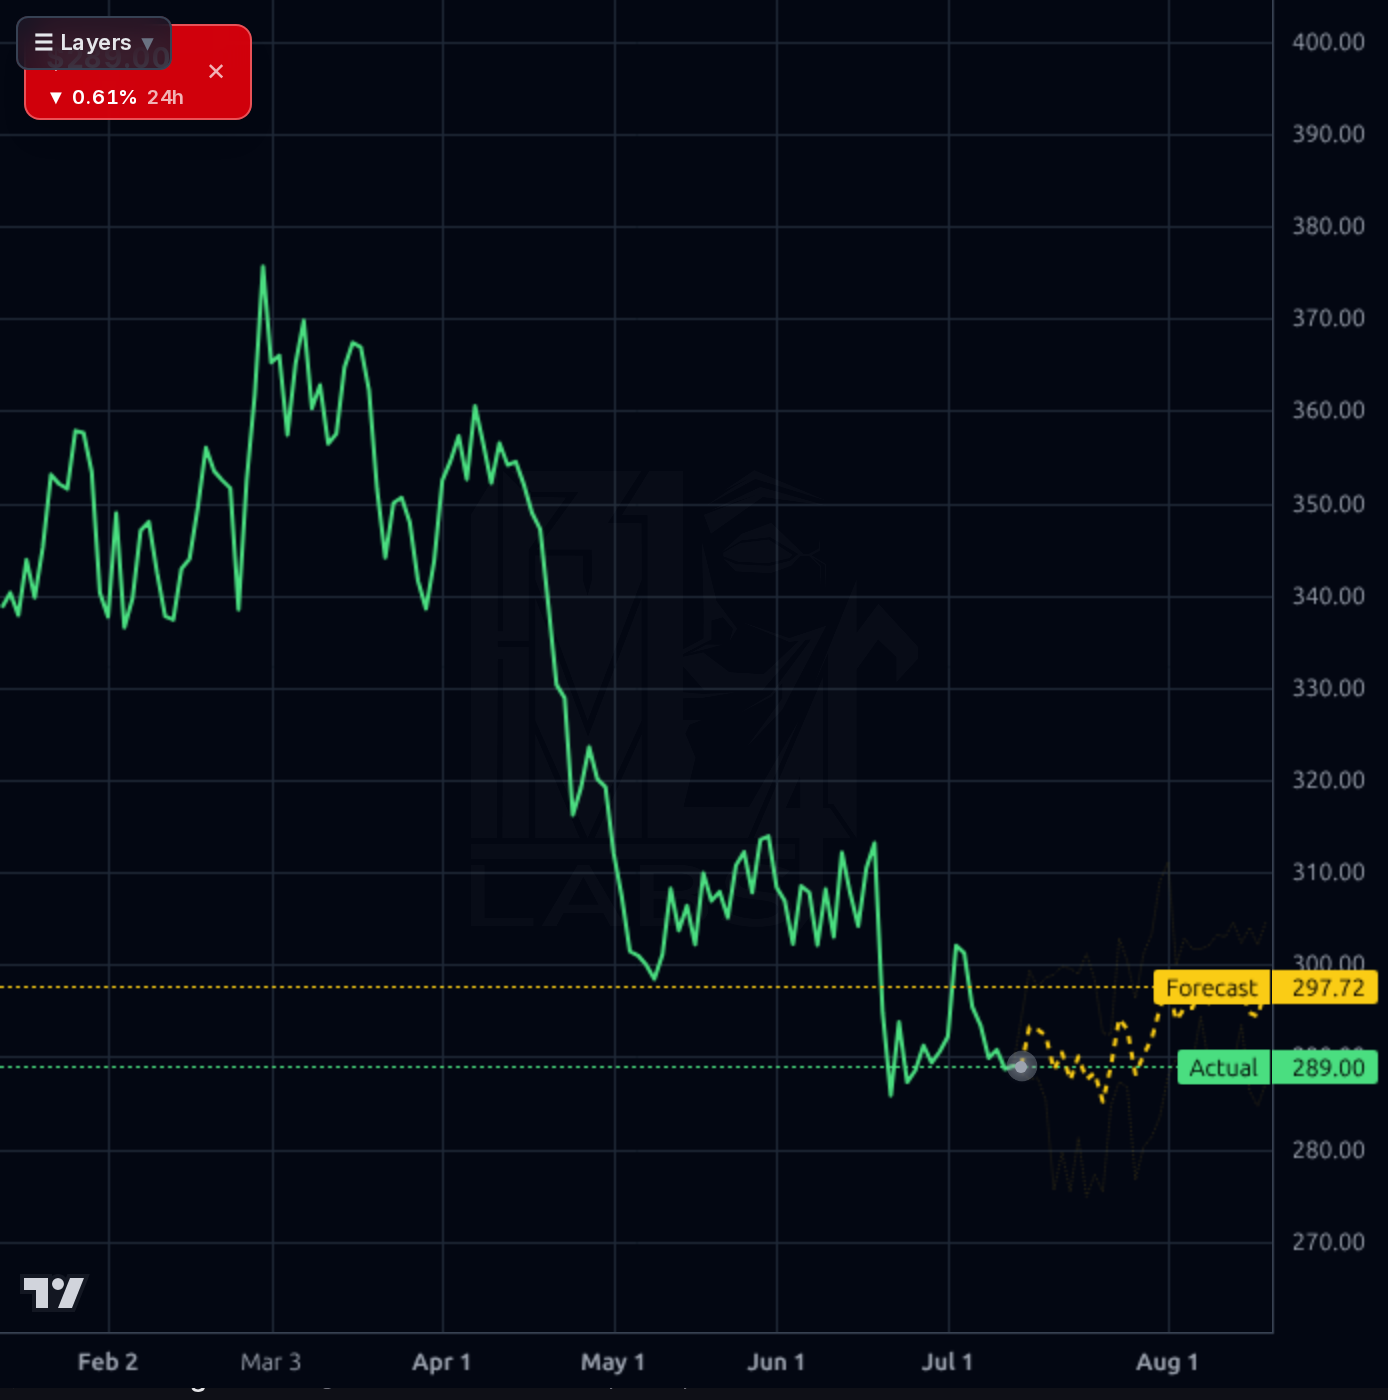
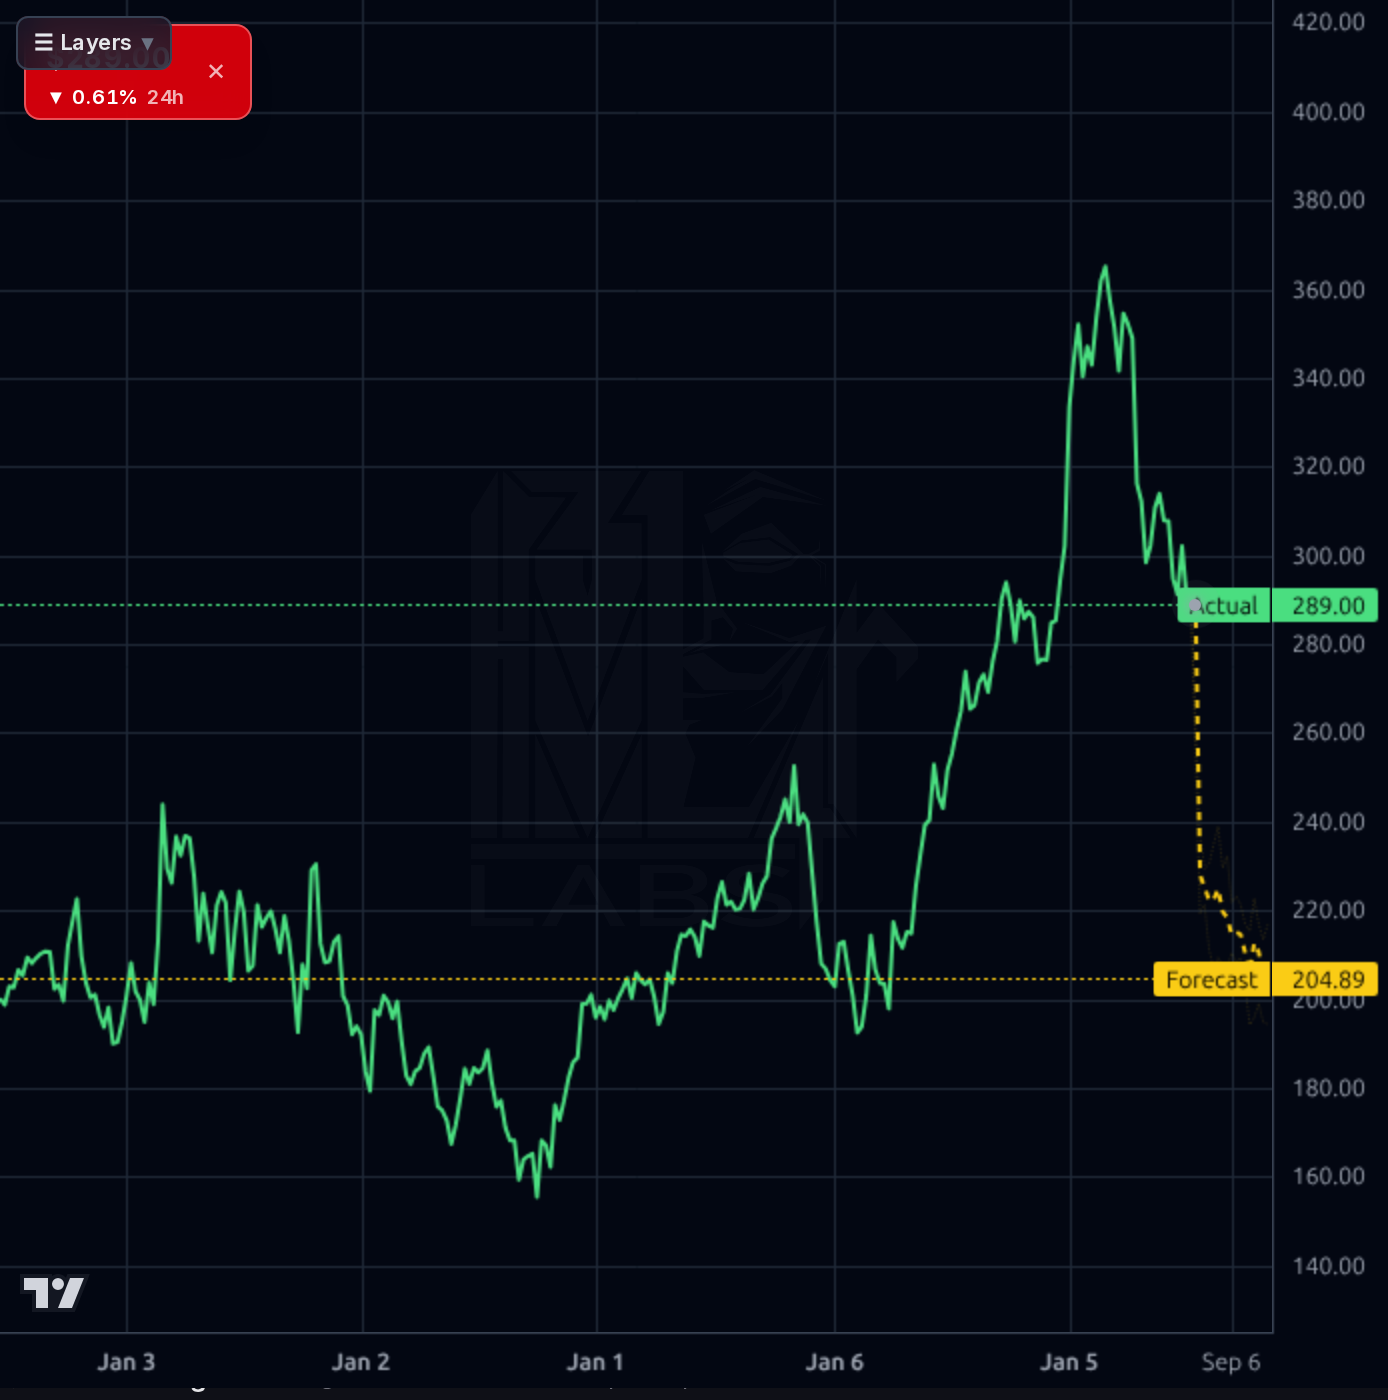
1-4 weeks: this window is dominated by the July 29 earnings print (~15 days out) — a binary event; any target here is PRE-earnings only and I would NOT size a swing trade into the report. Tactically, a starter position (quarter to third size) near $286-290 makes sense given the defended $285-289 support, the fresh contract catalysts, and the reliable 1d model leaning bullish (80% prob, 80% realized directional accuracy). Pre-earnings target $297-305; take partial profits into $300+ before the print. Invalidation: a daily close below $283 (breaks the July base) targets $270s and voids the bounce setup. Earnings stance: hold only the small core through the print, hedged or sized so a 5-7% gap (ATR 7.44 implies large moves) is tolerable.
1-6 months: constructive. The AMDT3 satellite award plus the FAA network contract improve backlog visibility exactly where the thesis needs it (SMS segment), and forward P/E of 21x with 17% next-year EPS growth is not demanding vs. defense peers. Expected return range: -10% (bear, $260 retest on an earnings miss or Q2 FCF disappointment) to +15-20% ($320-345) if Q2 confirms margin stabilization and positive FCF reversal. Key catalysts: July 29 earnings (watch operating cash flow recovery after Q1's -$95M, and gross margin — Q1's 24.4% was a step down), AMDT3 contract value disclosure, and defense budget appropriations. I would change my mind on a second consecutive quarter of negative FCF or gross margin below 24%.
1-3 years: LHX is structurally positioned in the fastest-growing slices of defense spending — space-based missile tracking (Golden Dome), hypersonics/propulsion via the Missile Solutions segment, and civil infrastructure (FAA through 2045). If management executes toward the 13.7% projected 5-year EPS CAGR, $17+ forward EPS supports a $340-380 stock at a maintained 20-22x multiple without heroic assumptions. The biggest structural risk is the combination of $11.4B debt and thin ROIC (6.0%) in a scenario of defense budget plateau or program cancellations — leverage amplifies any downcycle. Note the prior lesson on this name: analyst targets ($378.06 street average) have historically been aggressive; I anchor to backlog-driven earnings rather than a return to the old high.
Revenue is trending in the right direction: quarterly sales grew from $5.43B (Jun-25) to $5.74B (Mar-26), with Sales Q/Q +11.9% and EPS Q/Q +33.4%, and TTM revenue of $22.48B. Margins are the weak spot — Q1-26 net margin was 8.9% and operating margin 11.2%, with gross margin actually compressing to 24.4% from ~26% in the prior two quarters; the 10.4% profit margin remains thin for a 31.3x trailing P/E, though the 21.1x forward multiple (forward EPS $13.65 vs trailing $9.22) prices in significant earnings recovery. Cash flow quality is choppy: Q4-25 delivered $1.8B FCF but Q1-26 swung to -$194M FCF and -$95M operating cash flow, a working-capital timing issue worth watching into the July 29 print (working capital fell from $1.37B to $293M and cash from $1.07B to $590M quarter-over-quarter). The balance sheet carries $11.36B total debt against $19.68B equity (Debt/Eq 0.58, LT 0.47) — manageable but limiting, especially with a quick ratio of 0.89 and a 56.3% dividend payout. ROE of 8.9% and ROIC of 6.0% are mediocre for the sector, so the fundamental case rests on backlog conversion driving the 17.3% EPS growth expected next year rather than on current quality metrics.
The multi-timeframe picture is a downtrend with an emerging basing attempt. The weekly chart shows a powerful run from ~$160 to ~$365, followed by a persistent decline since early spring; the daily chart confirms lower highs from the ~$375 March peak through ~$300 in May-June, and price now sits -2.3% below the 20-SMA, -4.7% below the 50-SMA, and -8.9% below the 200-SMA with RSI at 41.1 — weak but not oversold. Key support is the $285-289 zone (repeatedly defended on the hourly chart in late June and mid-July) and the 52-week low at $257.35; resistance sits at $295, then the $300-303 shelf from the July 1 rally, then $310-317. The model's forecasts diverge sharply by timeframe: the 1h and 4h forecasts project a rally to $313-317, the 1d forecast a modest lift to ~$297.72 with a wide $278-310 band, while the 1wk forecast shows an implausible collapse to $204.89 — that weekly call should be heavily discounted since its directional accuracy (80%) merely matches the naive baseline and MAPE is 11%, whereas the 1d model has genuine edge (80% vs 64% baseline, 2.3% MAPE) and leans bullish (0.80 probability). Net read: near-term mean-reversion bounce toward $297-305 is the higher-probability path, but the intermediate trend remains down until $310 is reclaimed.
The signal is unambiguous: on July 13 L3Harris won a Space Development Agency contract for 18 Accelerated Missile Defense Tranche 3 (AMDT3) satellites supporting the Golden Dome missile-defense architecture — a direct validation of the Space & Mission Systems segment and the core secular thesis. This follows the July 1 FAA award to modernize and operate the national aircraft tracking network through 2045, covering 700+ ground stations — extraordinarily long-duration, annuity-like revenue. Notably, contract size for AMDT3 was not disclosed, so revenue impact cannot yet be quantified, and the stock has so far failed to rally on the news (still -4.2% on the week), suggesting the market is waiting for earnings confirmation.
- AMDT3 program: 18 Space Force missile-tracking satellites for the Golden Dome architecture (awarded July 13, 2026) — multi-year SMS segment revenue, with contract value disclosure a near-term catalyst.
- FAA contract to modernize and operate the national aircraft tracking network through 2045, including 700+ ground stations — long-duration, recurring civil revenue stream.
- Missile Solutions segment (propulsion, hypersonics) leveraged to elevated munitions replenishment and missile-defense budgets.
- Forward EPS trajectory: $13.65 forward vs $9.22 trailing, with consensus +17.3% EPS growth next year and 13.7% over 5 years, driven by backlog conversion and margin recovery.
- Sales momentum already visible: Q1-26 revenue $5.74B, +11.9% Q/Q sales growth and +33.4% EPS Q/Q, with 7.5% average EPS surprise history.
- July 29 earnings is a binary event: Q1-26 showed negative operating cash flow (-$95M) and FCF (-$194M); a repeat would undercut the cash-generation pillar of the thesis.
- Gross margin compression: Q1-26 gross margin fell to 24.4% from ~26% in prior quarters; sustained input-cost pressure erodes the forward EPS bridge.
- Leverage: $11.36B total debt vs $590M cash, quick ratio 0.89, and a 56% dividend payout constrain flexibility if rates stay high or budgets slip.
- Valuation gap risk: trailing P/E of 31.3x means the stock depends on delivering the forward estimates; any guidance cut compresses the multiple and the E simultaneously.
- Technical trend remains down — price below 20/50/200 SMAs; failure to hold $283-285 opens a retest of the $257 52-week low.
- AMDT3 contract size undisclosed — the market may be overestimating its revenue materiality; the stock's failure to rally on the news is a caution flag.
- Retail sentiment is 100% bullish in sampled messages, a mild contrarian warning against chasing the contract headlines.
- Defense budget cyclicality: 'Iran war hasn't helped defense stocks' headline underscores that geopolitical catalysts are not translating into multiple expansion this cycle.
Get AI analysis on any stock
This is one of hundreds of Kronos AI reports — scored fundamentals & technicals, bull/base/bear price targets, a multi-horizon plan, and continuously-updated forecasts across the market. Create a free account to explore them all.
Create your free account →Already a member? Sign in · Join our Discord