LKQ — AI Stock Forecast & Price Targets
Published 9/9/2026 · A free sample of K3vl4r’s AI-powered analysis.
Kronos price forecasts, scored fundamentals & technicals, and a multi-horizon plan.
View the live LKQ price forecast →
LKQ trades at a deep valuation discount (8.05x fwd P/E, 4.82% yield, P/B ~0.98) with North America returning to organic growth for the first time in nine quarters, but Q2 miss, lowered FY26 guidance, European ERP disruption, and 2.8x EBITDA leverage keep this a value-with-overhangs setup. Price is wedged near multi-year lows ($24.90) with clear support at $21.17 and heavy overhead through the 200-day (~$28.75); accumulate patiently rather than chase, sized small into the Oct 29 print.
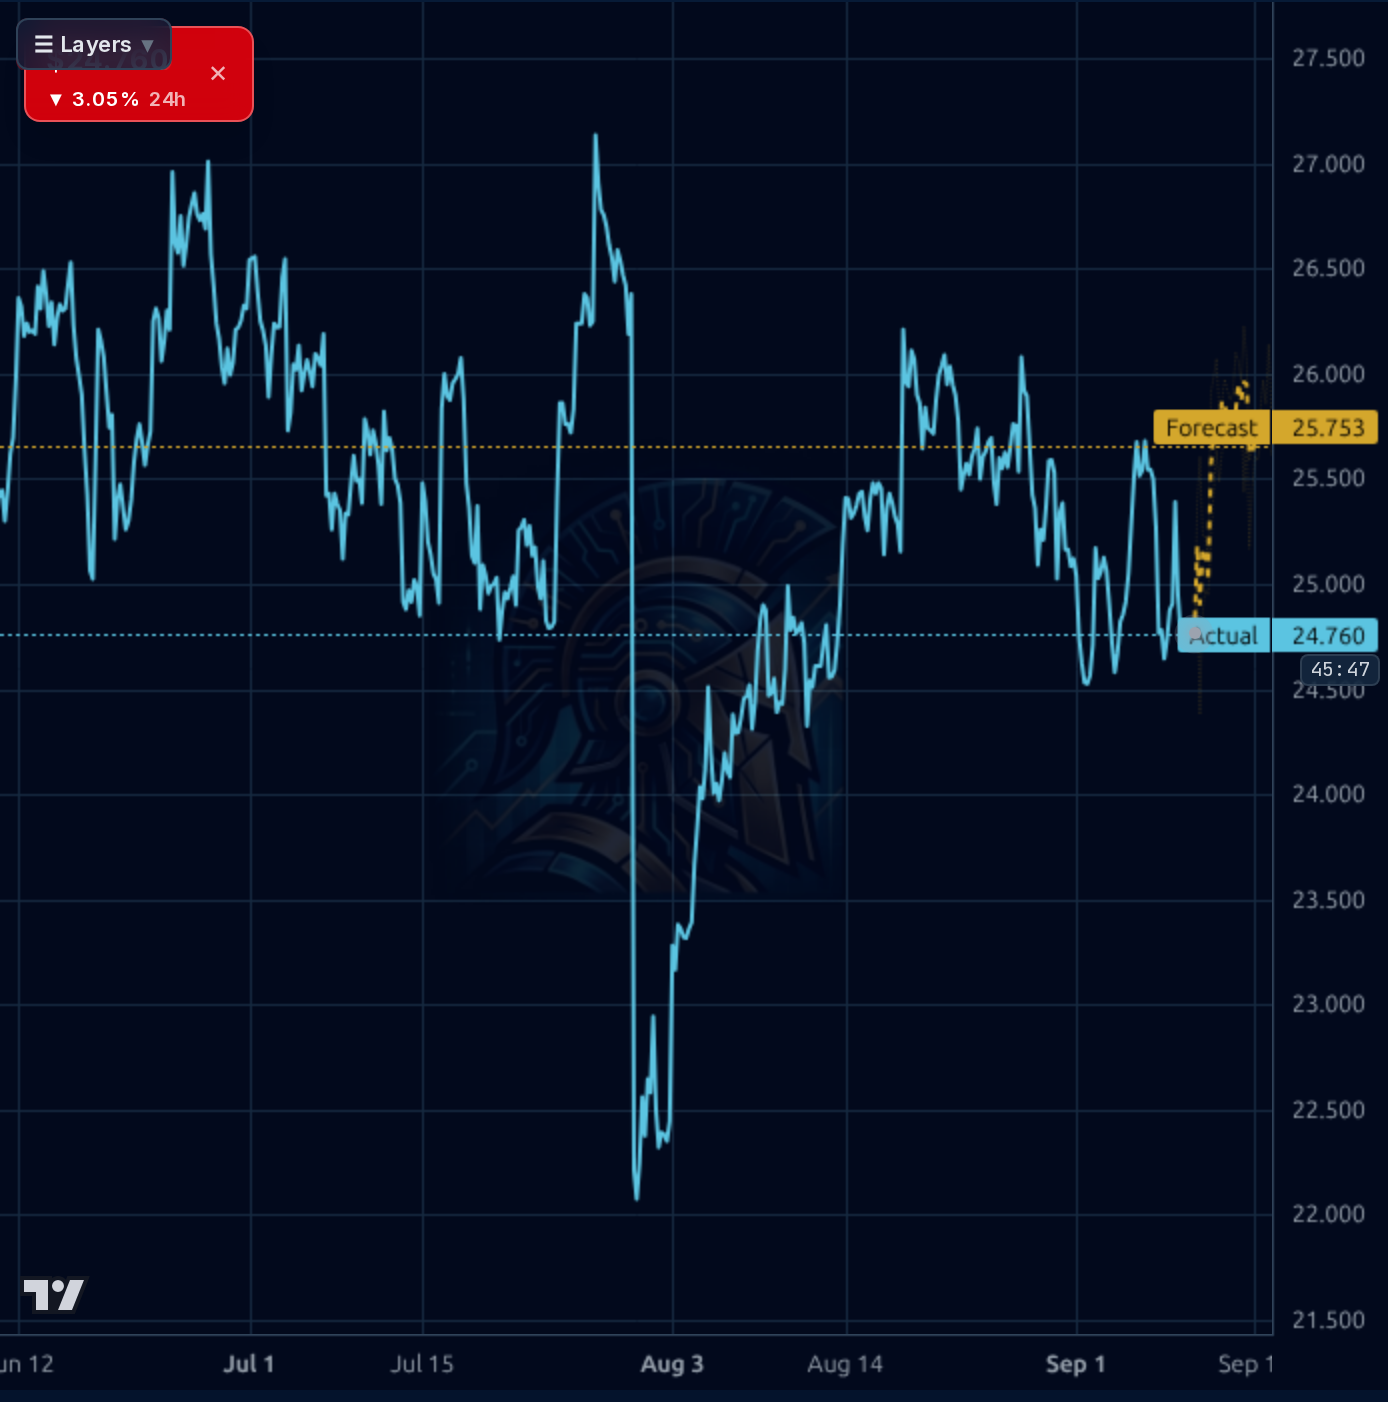
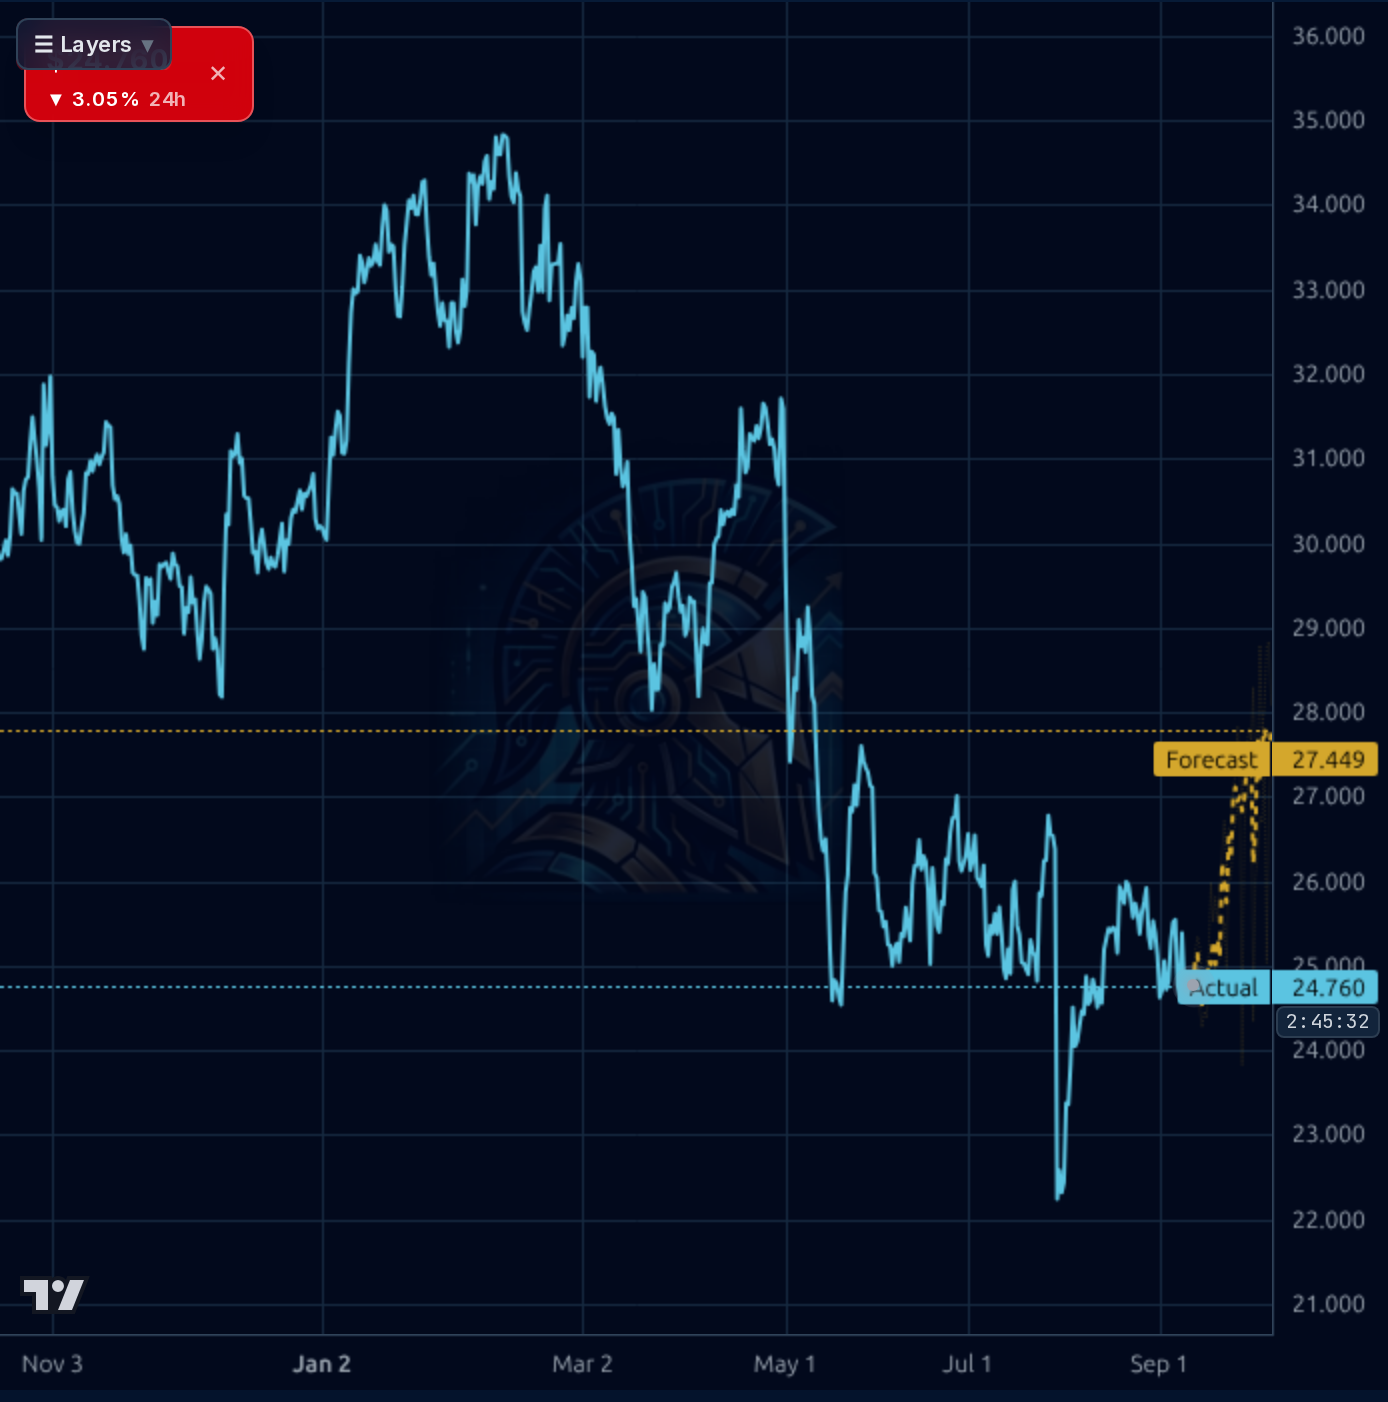
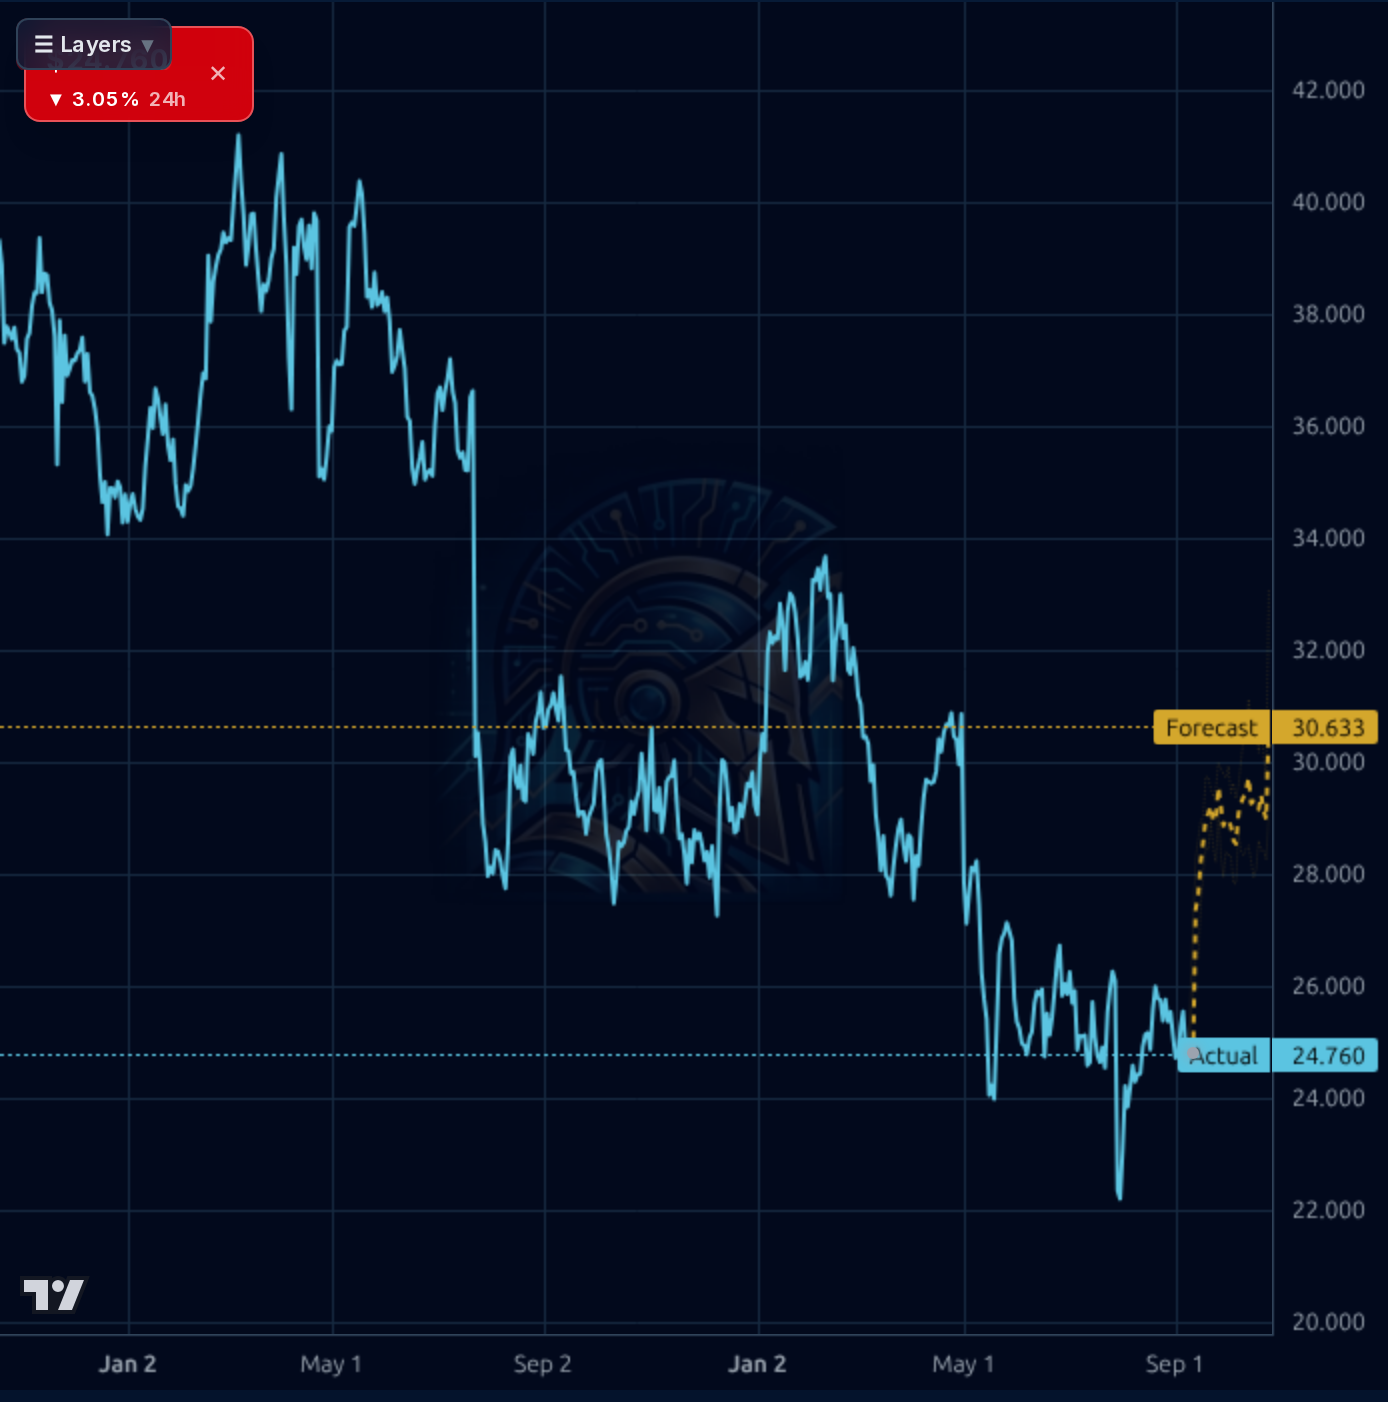
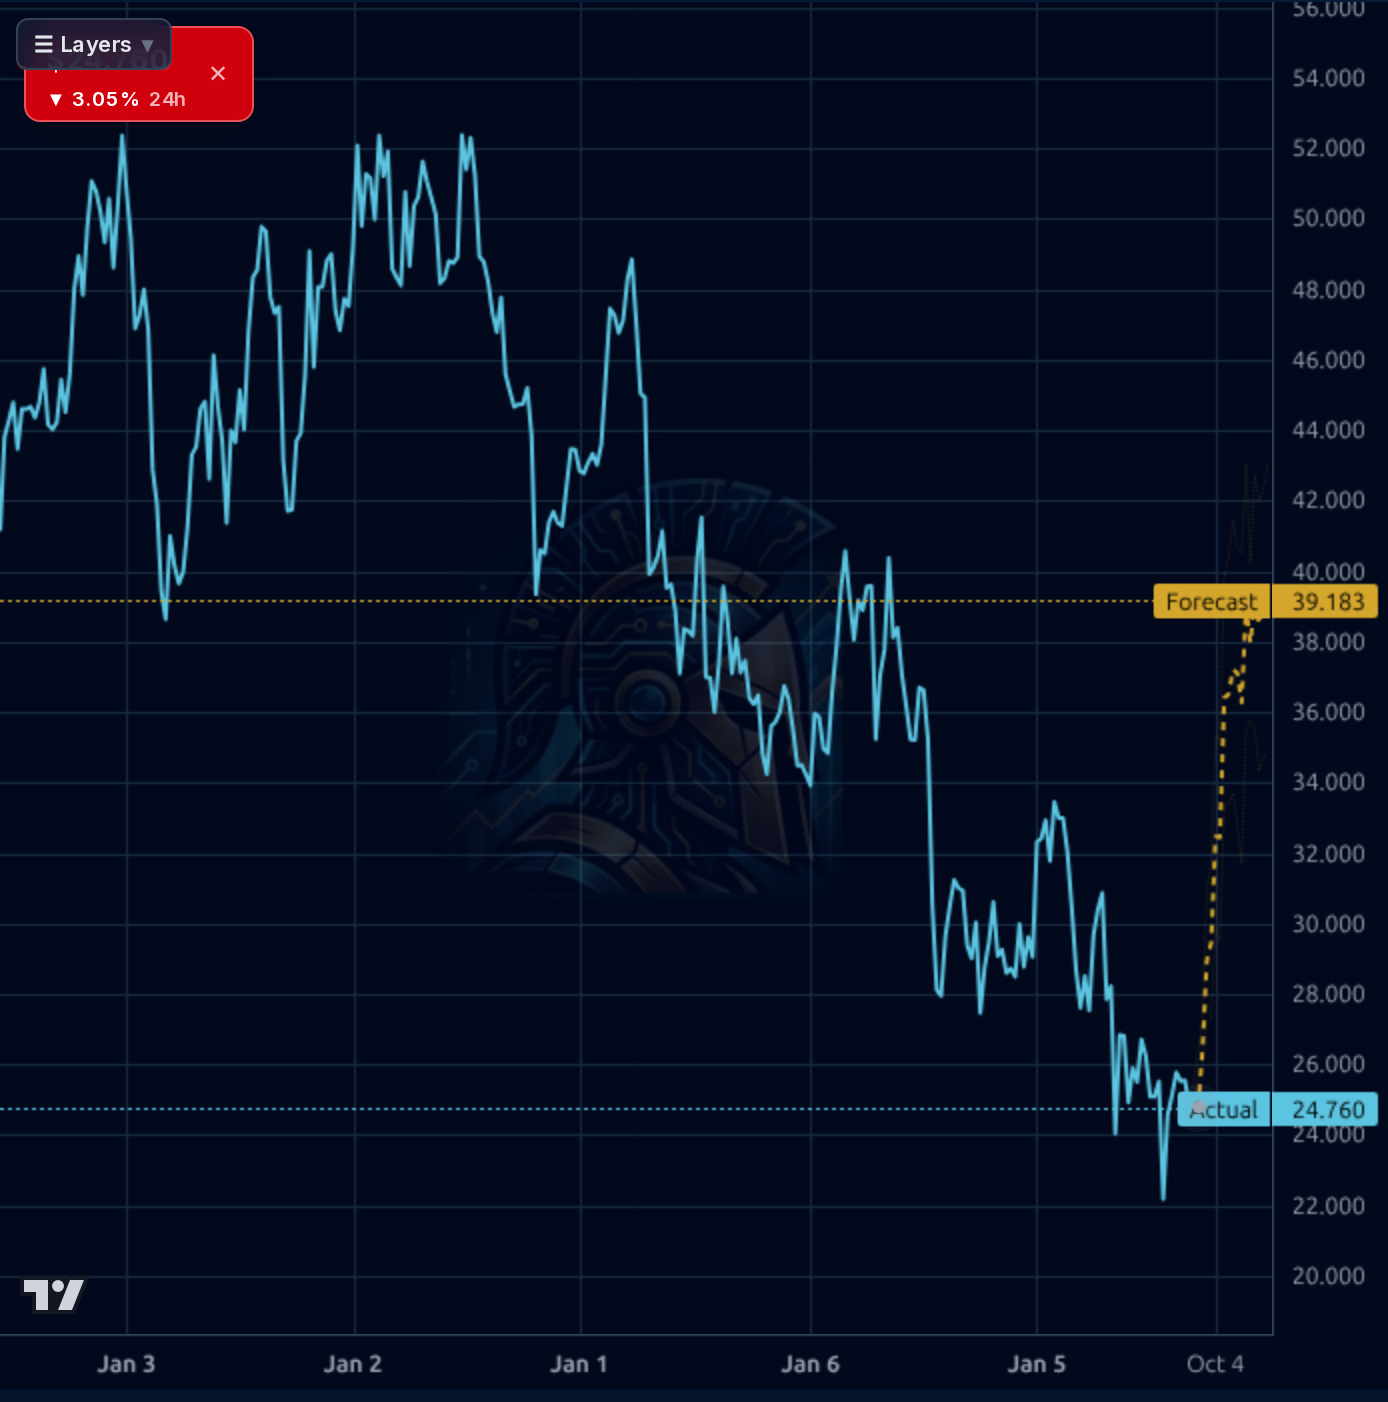
1-4 week: neutral-to-constructive. Price is coiled between $24.50 support and $25.75 resistance. Do nothing above $26; start a small starter position (25% of intended size) on a hold of $24.00-$24.50 with defined stop below $23.50. A daily close under $23.50 (breaking August lows) invalidates the base and opens $21.17. Do NOT anchor to the model's $25.75-$30.63 forecast band — 1wk accuracy is worse than naive.
1-6 month: accumulate on weakness into and after the Oct 29 Q3 print. Thesis requires (1) North America organic growth continuation, (2) European ERP stabilization commentary, and (3) FCF normalization. If Q3 confirms the NA inflection, base case is a re-rating toward $28-$29 (200-day + prior consolidation), roughly +14-17%. Add the ~5% dividend yield for ~20% total return potential. What changes my mind: another guidance cut, NA organic growth reversing, or FCF turning materially negative — any of those and I'd cut and step aside. Strategic review resolution (sale/spinoff) could accelerate move to $30-$33.
1-3 year: terminal thesis is that LKQ is a mid-single-digit revenue grower with mid-teens operating margin potential once Europe stabilizes, generating $700-900M annual FCF that funds the dividend and buybacks. At 10-11x normalized EPS of ~$3.00-$3.25, fair value is $30-$36. Multi-year drivers: alternative parts penetration >40% and rising, insurance-mandated aftermarket usage, Europe consolidation, and possible portfolio simplification. Biggest structural risks: (a) EV transition reducing collision volumes and mechanical parts demand over the next decade, (b) tariff/supply-chain exposure on imported parts, and (c) balance sheet flexibility if a recession hits before leverage comes down.
Top-line is contracting: Q2'26 revenue of $3.41B was down ~3% YoY with sales Q/Q -6.4% and TTM sales -2.55%. Gross margin held up reasonably (38.8% GAAP, ~35.7% adj per snapshot) but operating margin compressed to 7.0% and net margin to 4.0%, driving Q2 net income of $136M — well below the $180M print in Q3'25. EPS Y/Y TTM is -33.3% and EPS Q/Q -27.6%, confirming earnings deterioration. The balance sheet carries $5.31B total debt against only $301M cash and $6.45B equity (D/E 0.82, LT D/E 0.70); leverage at ~2.8x EBITDA is manageable but not comfortable given TTM EBITDA of ~$1.4B and rising working-capital drag (Q1'26 FCF was -$96M before recovering to +$60M in Q2). TTM FCF of $724M and the ~$2.99B cumulative buyback plus 4.82% dividend (50.97% payout) show shareholder-return discipline, but ROIC of 4.24% barely covers cost of capital and ROE has slipped to 7.1%. What's working: North America organic growth inflection, Specialty resilience, alternative-parts utilization >40%. What's broken: European ERP rollout dragging that segment ~10%, guidance cut on July 30 (FY26 EPS range revised lower), and quarterly cash flow lumpiness.
Multi-timeframe picture is bearish-to-basing. Weekly chart shows a multi-year downtrend from ~$52 (early 2023) to the recent $22.17 low, with price now at $24.90 — down 32.9% from the 52-wk high of $37.13 and only 17.6% above the $21.17 low. Daily sits below both SMA50 (-1.34%) and SMA200 (-13.44%), and the 1h/4h charts show a tight consolidation between roughly $24.50 support and $25.75 resistance after the post-earnings gap-down in early August. RSI at 46.8 is neutral, ATR $0.78 (~3%) implies normal volatility. The model's yellow forecast band skews bullish across all timeframes (1d target $25.75, 4h $27.45, 1d $30.63, 1wk $39.18), but realized 1-week directional accuracy is 17% vs 83% naive — the longer-horizon bullish forecasts should be heavily discounted. Key levels: hard support $21.17 (52-wk low, invalidation), interim resistance $25.75–$26.00 (recent chop high + Aug gap), then $28.00 (200-day) and $30 psychological. No positive divergence yet — this is a base-building setup at best, not a confirmed reversal.
The dominant signal is the July 30 Q2 print: adjusted EPS $0.67 missed the $0.71 consensus, revenue $3.41B fell short, and FY26 guidance was cut. That drove the stock down 14% in 30 days and 25% YTD. Offsetting positives include North America's first positive organic growth in nine quarters, Specialty resilience, and continued capital returns ($207M returned H1'26). A board-led strategic review — including a potential sale of the company or divestiture of Specialty — is a real optionality wildcard that could re-rate the stock. Noise/negatives to weigh: a Zacks Strong Sell flag (Sep 9), an active class action, price target cut from $39.07 → $34.50 (still 39% above spot), and offsetting institutional signals (Finviz shows -3.21% inst. transactions, but 45-day trend shows +3.7pp ownership increase). Social sentiment is 100% bullish among the tiny tagged sample but the messages appear to be promotional spam — no signal. Sell-side recommendation of 1.67 (near Strong Buy) and $31.07 mean target suggest the Street still sees ~25% upside.
- North America organic growth turned positive in Q2'26 for the first time in nine quarters — key catalyst to confirm at Oct 29 print
- Alternative parts utilization above 40%, supporting long-term wholesale volume growth as insurers push cheaper parts
- Board-led strategic review actively evaluating potential company sale and/or Specialty segment divestiture to unlock value
- European ERP remediation, once complete, removes ~10% segment revenue drag and should restore margin trajectory
- $2.99B cumulative buyback since 2018 plus 4.82% dividend yield (50.97% payout) provide durable capital-return floor
- Sell-side consensus target $31.07 (+25% from spot) with 1.67 average recommendation reflects Street's expected earnings recovery
- Q2 earnings miss and FY26 guidance cut confirms operational stress; further downward revisions at Oct 29 print would break $21.17 support
- European ERP disruption caused ~10% segment revenue decline — remediation timeline is uncertain and could extend into 2027
- $5.31B total debt vs $301M cash and 2.8x EBITDA leverage constrains flexibility if FCF weakens further (Q1'26 was -$96M)
- Active class action lawsuit creates litigation overhang and potential settlement cost
- ROIC of 4.24% is barely above cost of capital, suggesting capital-allocation returns are structurally challenged
- Zacks Strong Sell flag (Sep 9) and institutional selling activity (-3.21% Finviz inst. transactions) reflect near-term negative positioning
- Weak long-term EPS growth profile (EPS next 5Y at 3.22%) risks value-trap outcome if NA inflection doesn't scale
- Secular EV transition may structurally reduce collision and mechanical parts demand over the coming decade
Get AI analysis on any stock
This is one of hundreds of Kronos AI reports — scored fundamentals & technicals, bull/base/bear price targets, a multi-horizon plan, and continuously-updated forecasts across the market. Create a free account to explore them all.
Create your free account →Already a member? Sign in · Join our Discord