LNC — AI Stock Forecast & Price Targets
Published 10/29/2026 · A free sample of K3vl4r’s AI-powered analysis.
Kronos price forecasts, scored fundamentals & technicals, and a multi-horizon plan.
View the live LNC price forecast →
LNC is a deeply cheap life insurer (P/E 3.5x, P/B 0.75x) whose re-rating hinges on capital-structure repair and a pivot to spread-based annuities, but it carries persistent negative net margins, negative TTM free cash flow, and elevated leverage. Technically the stock is consolidating just under $42 resistance after a sharp rally, with an imminent binary earnings event on 2026-11-05 that the model's own forecasts cannot reliably call. Net: a value/catalyst name worth accumulating on weakness but not chasing into an unquantifiable earnings gap.
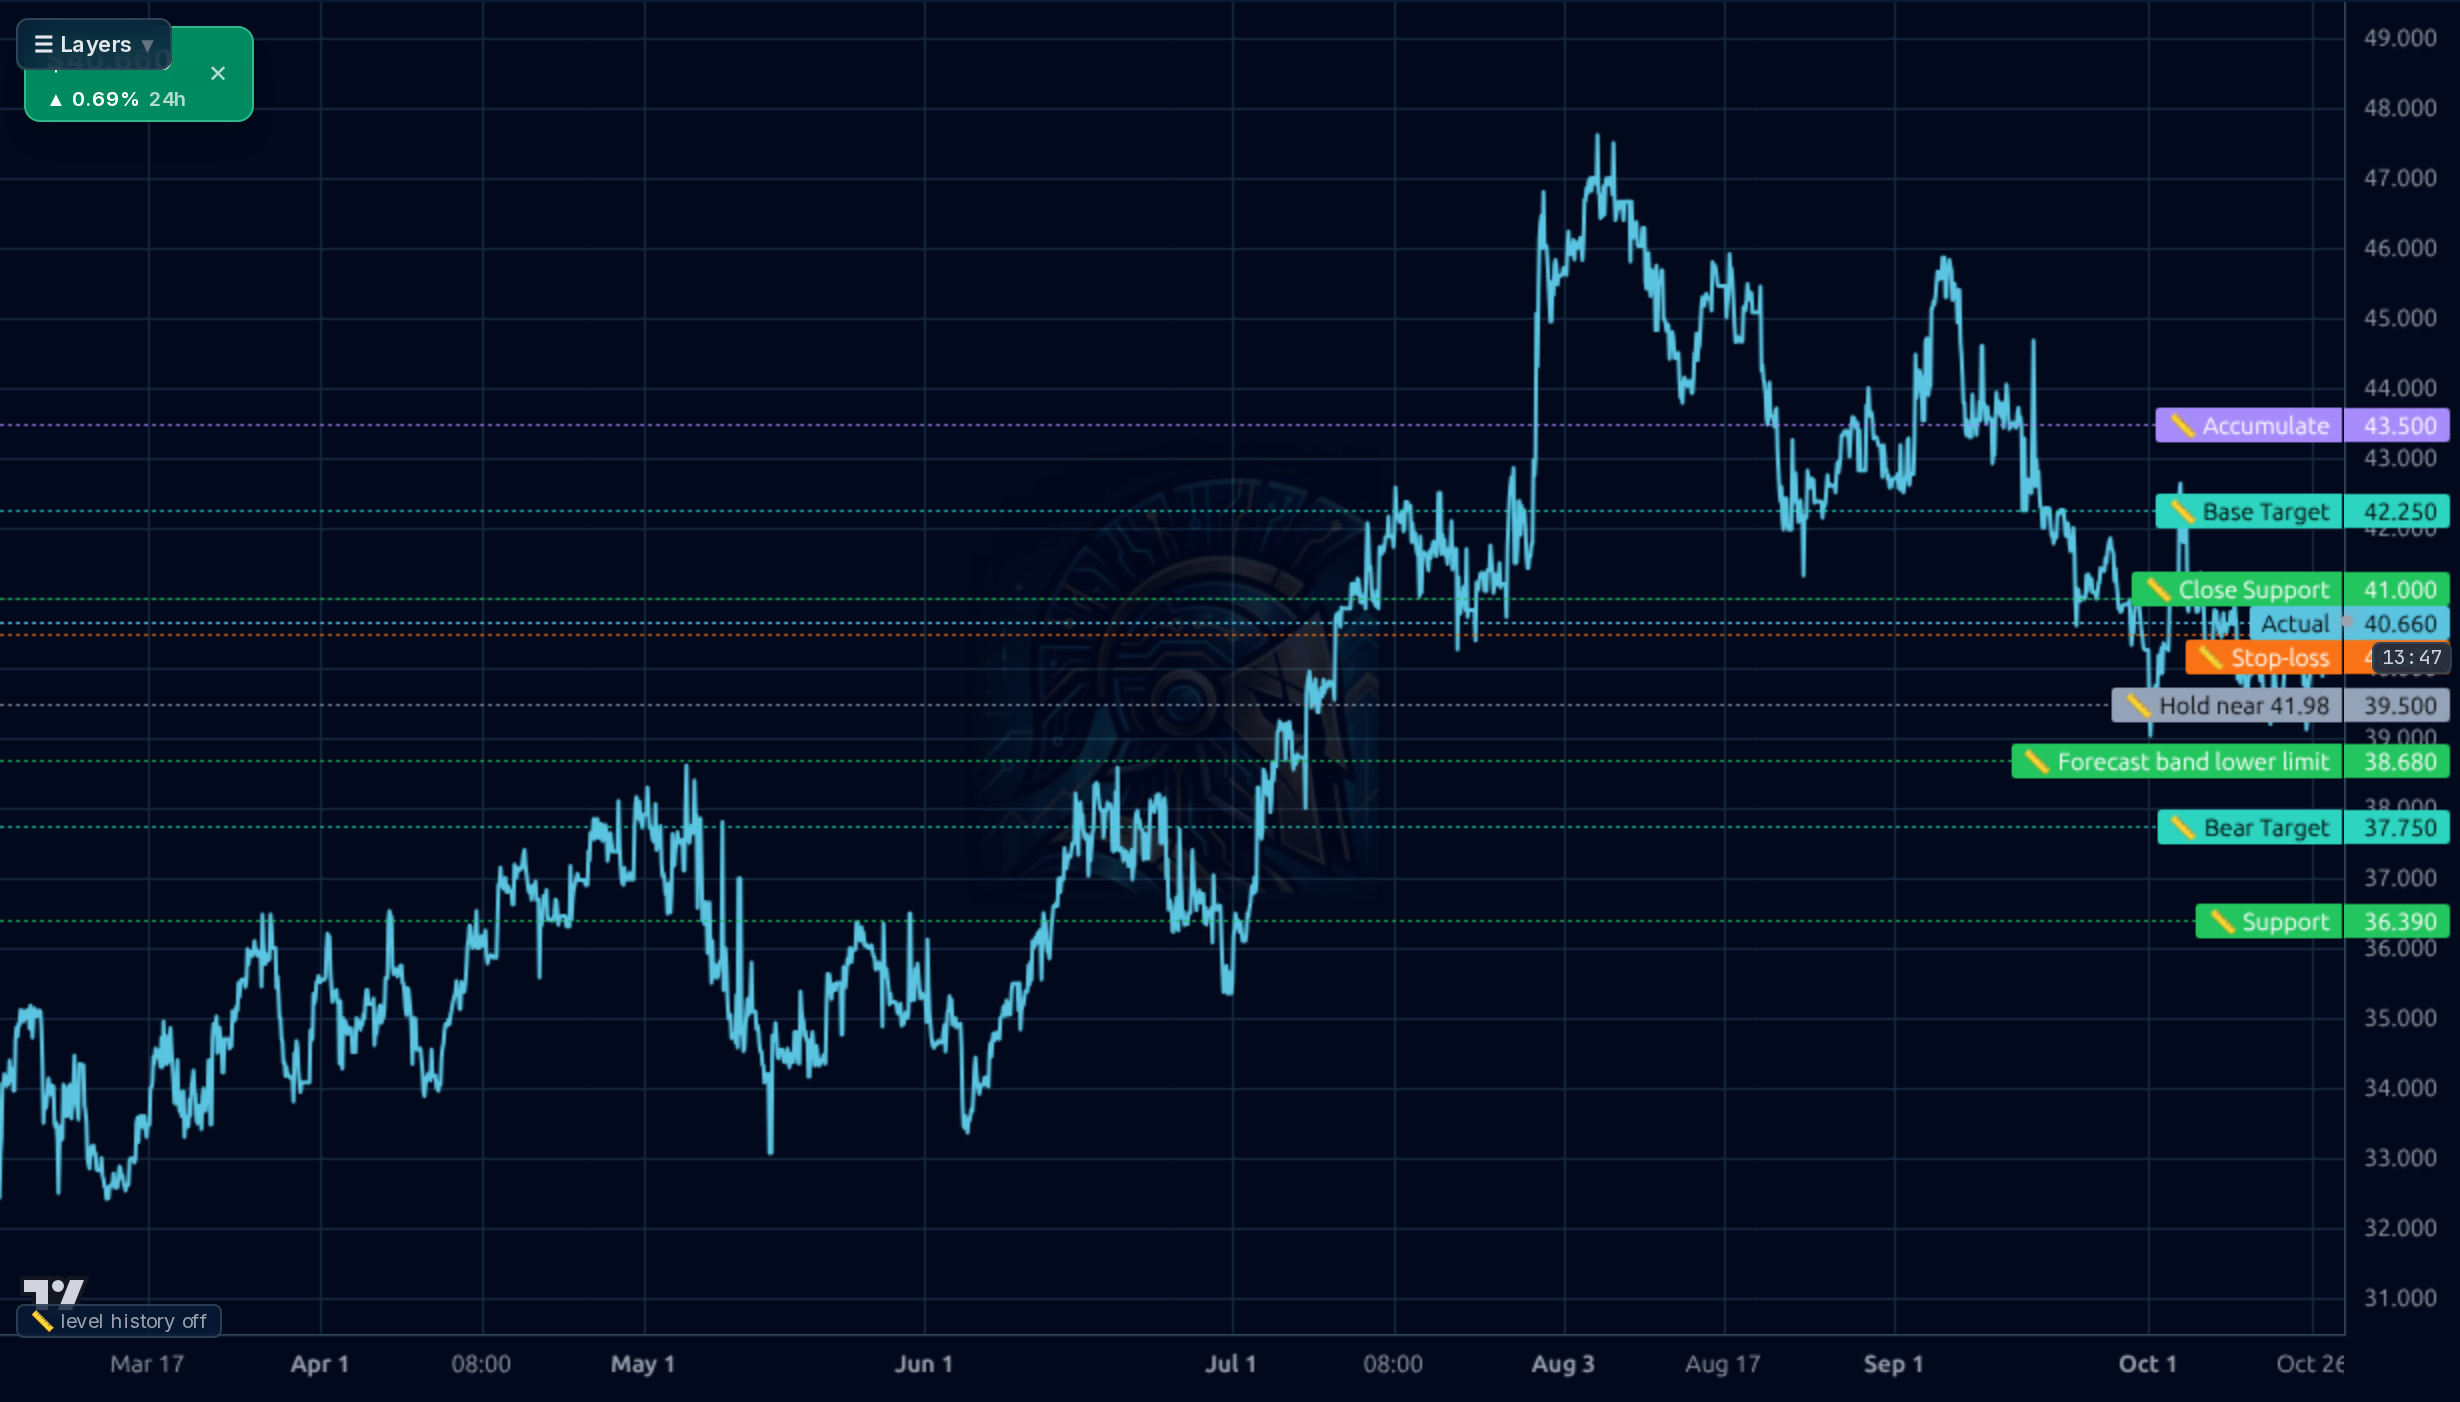
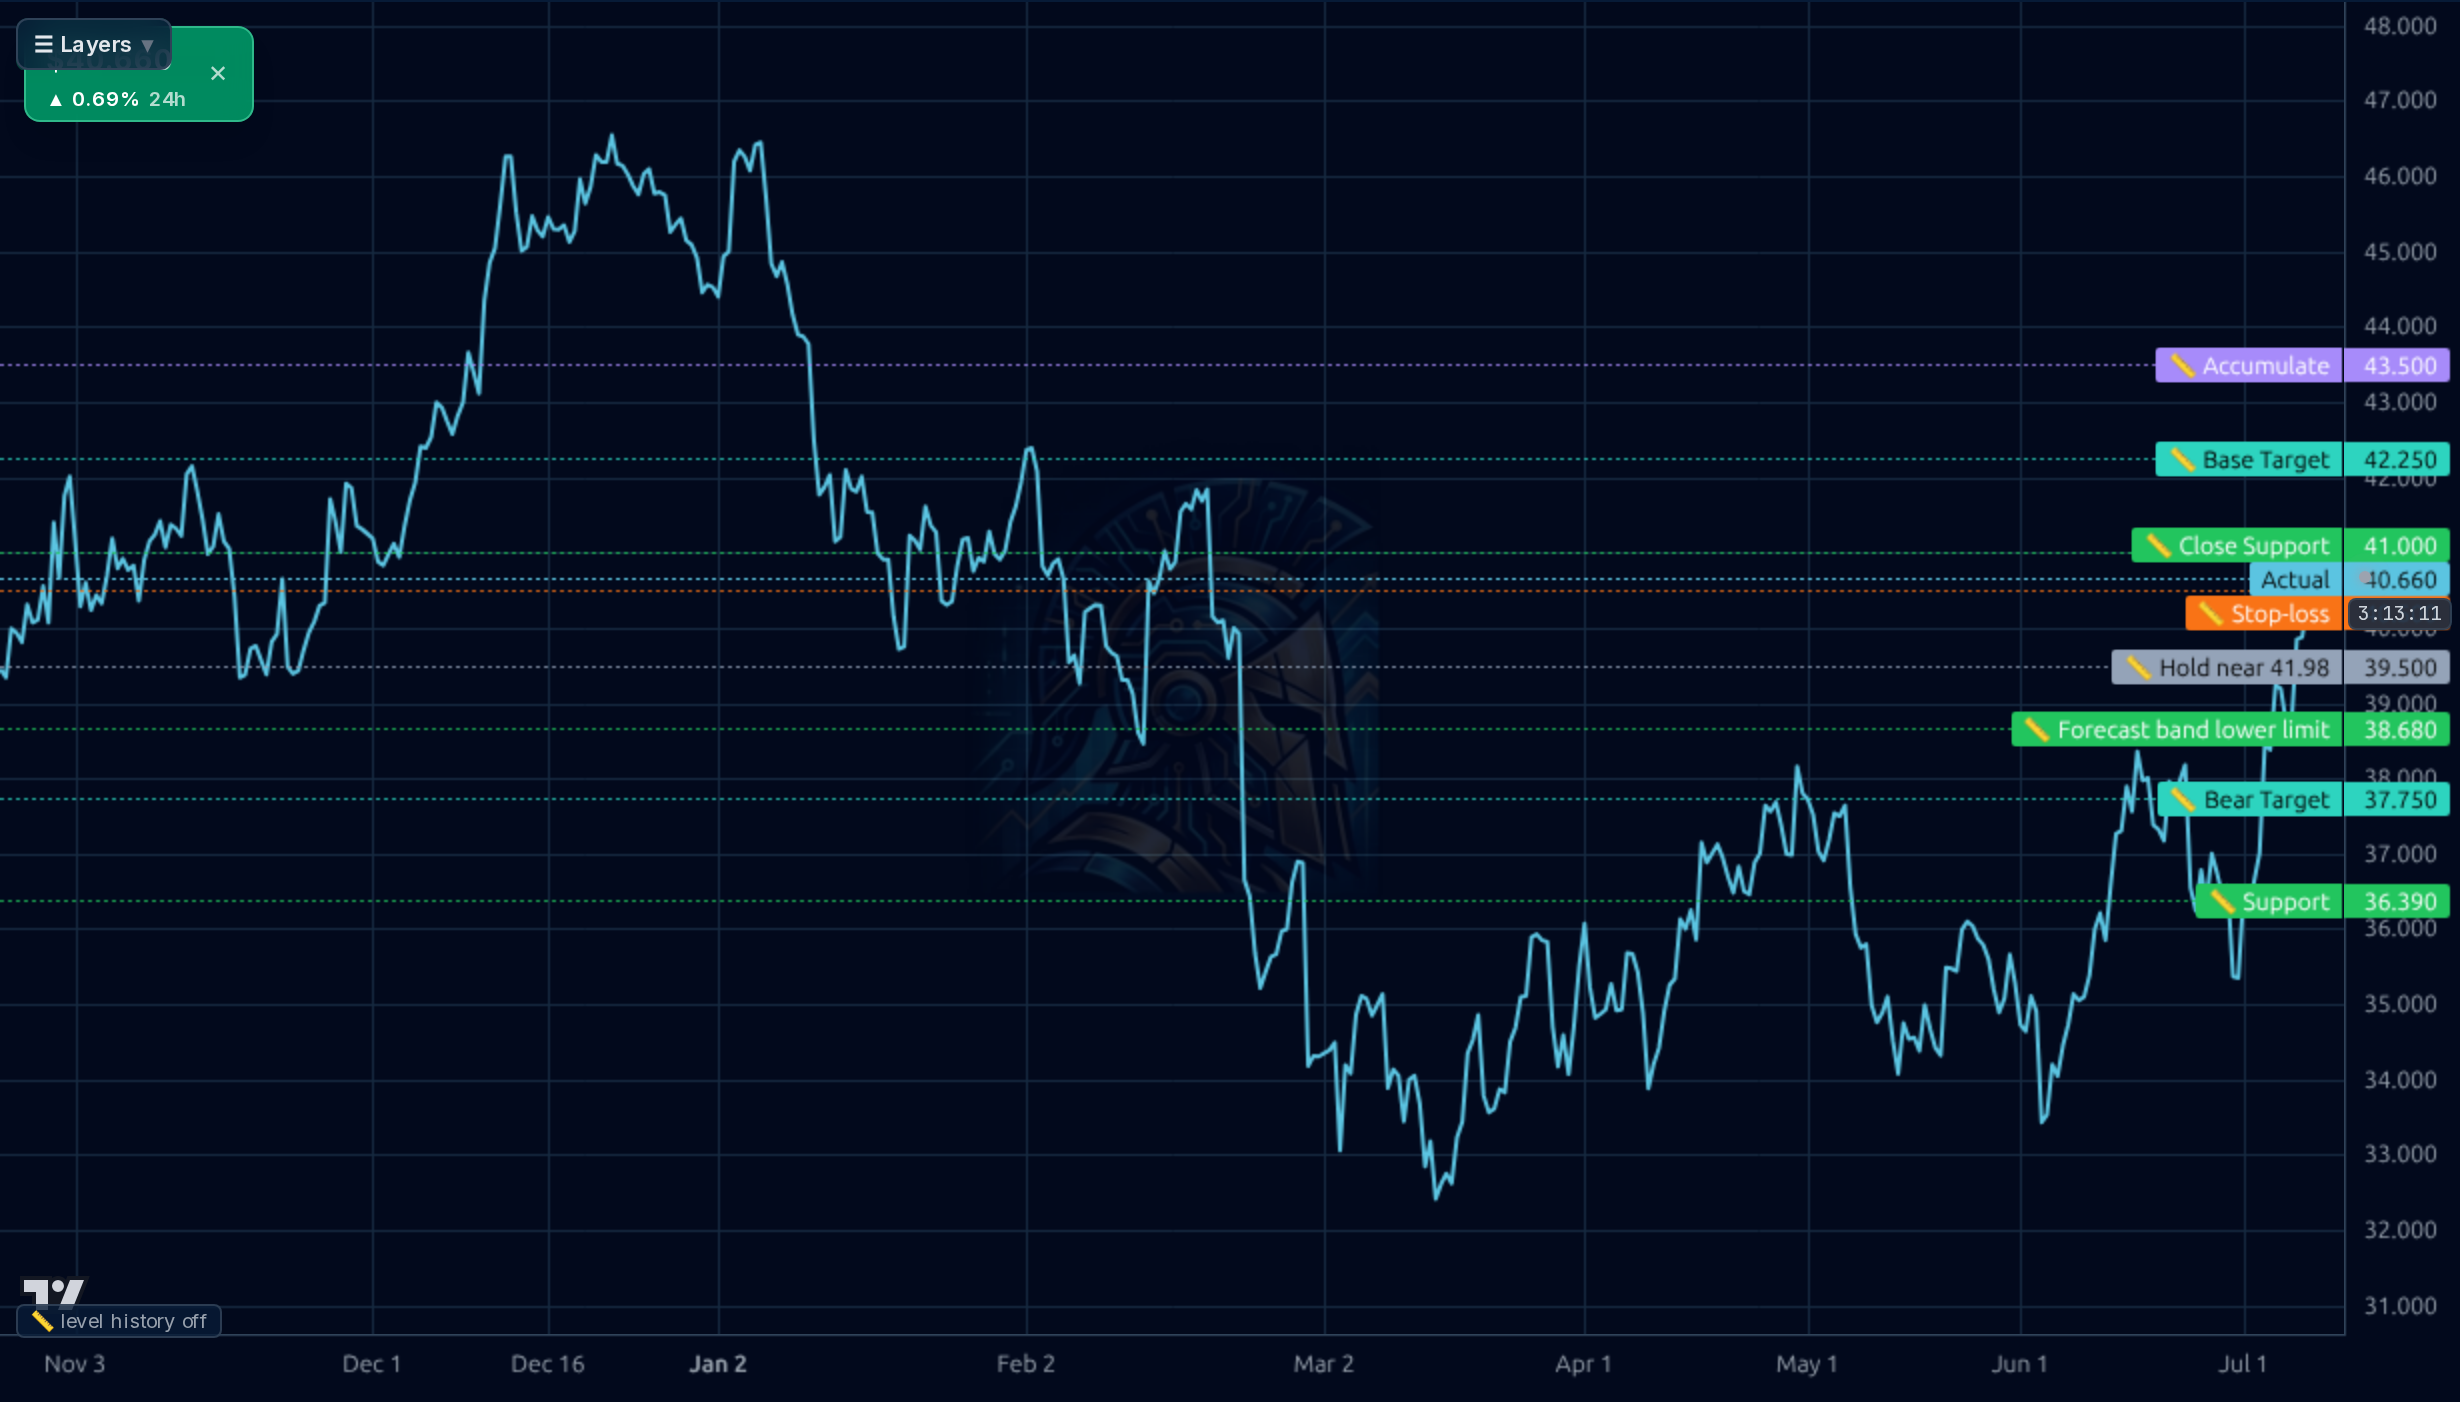
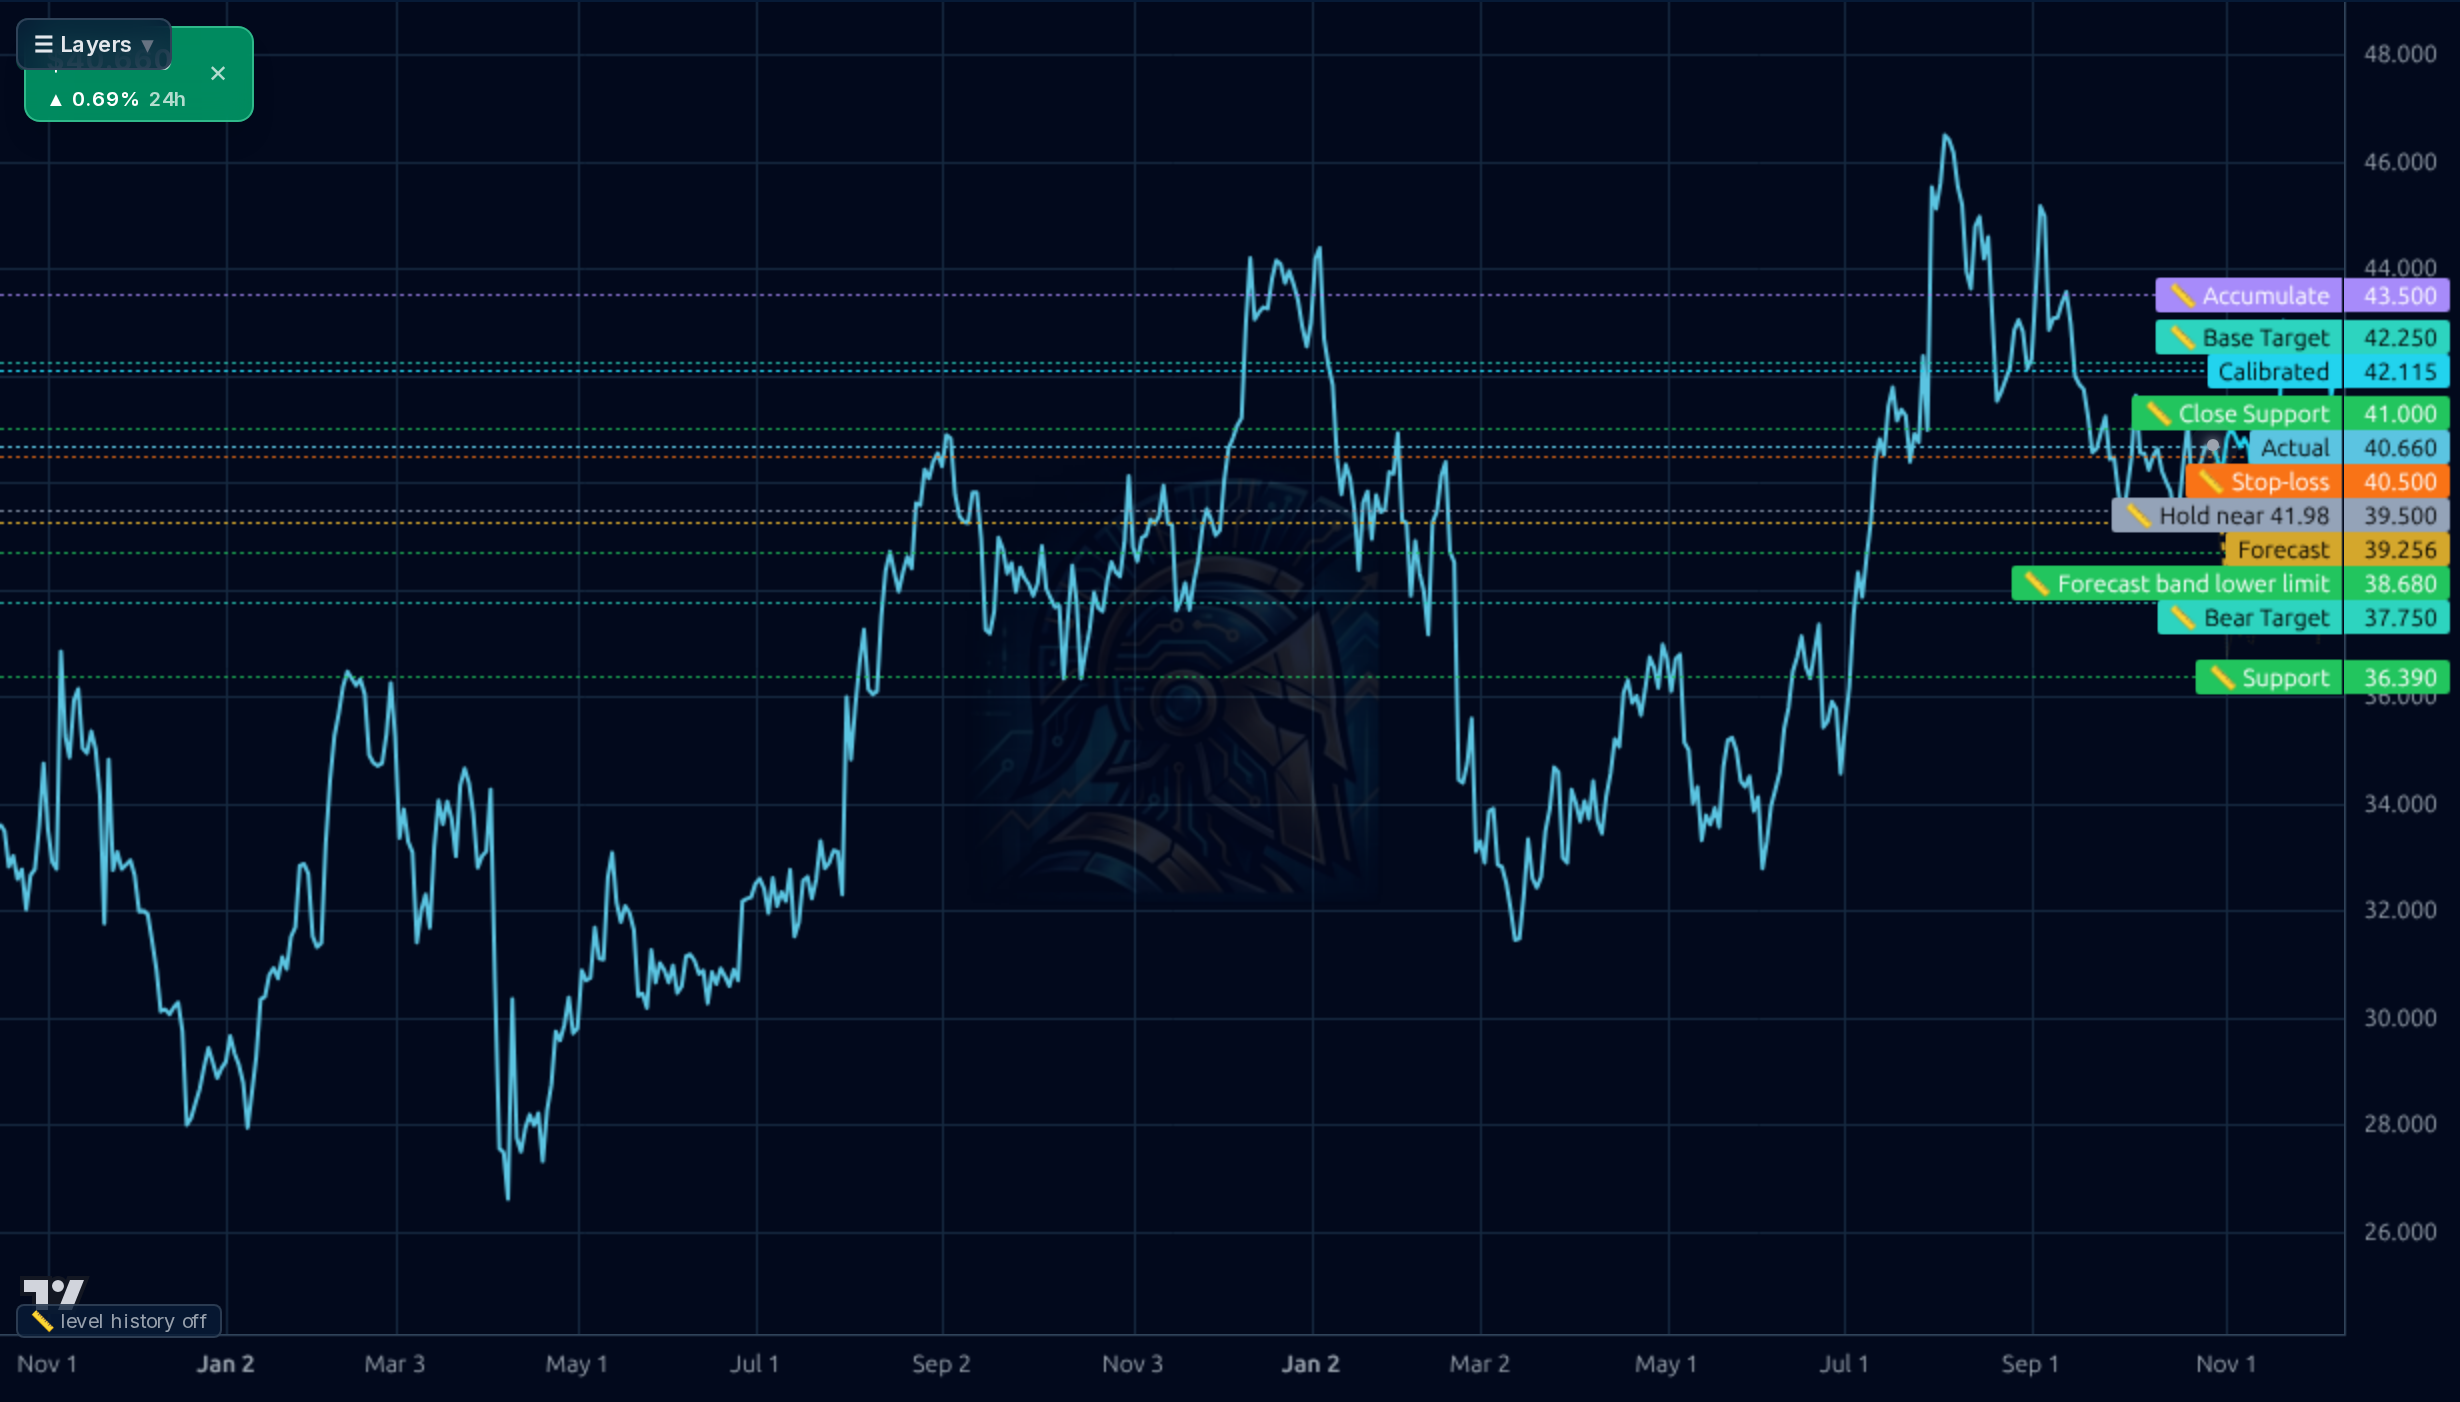
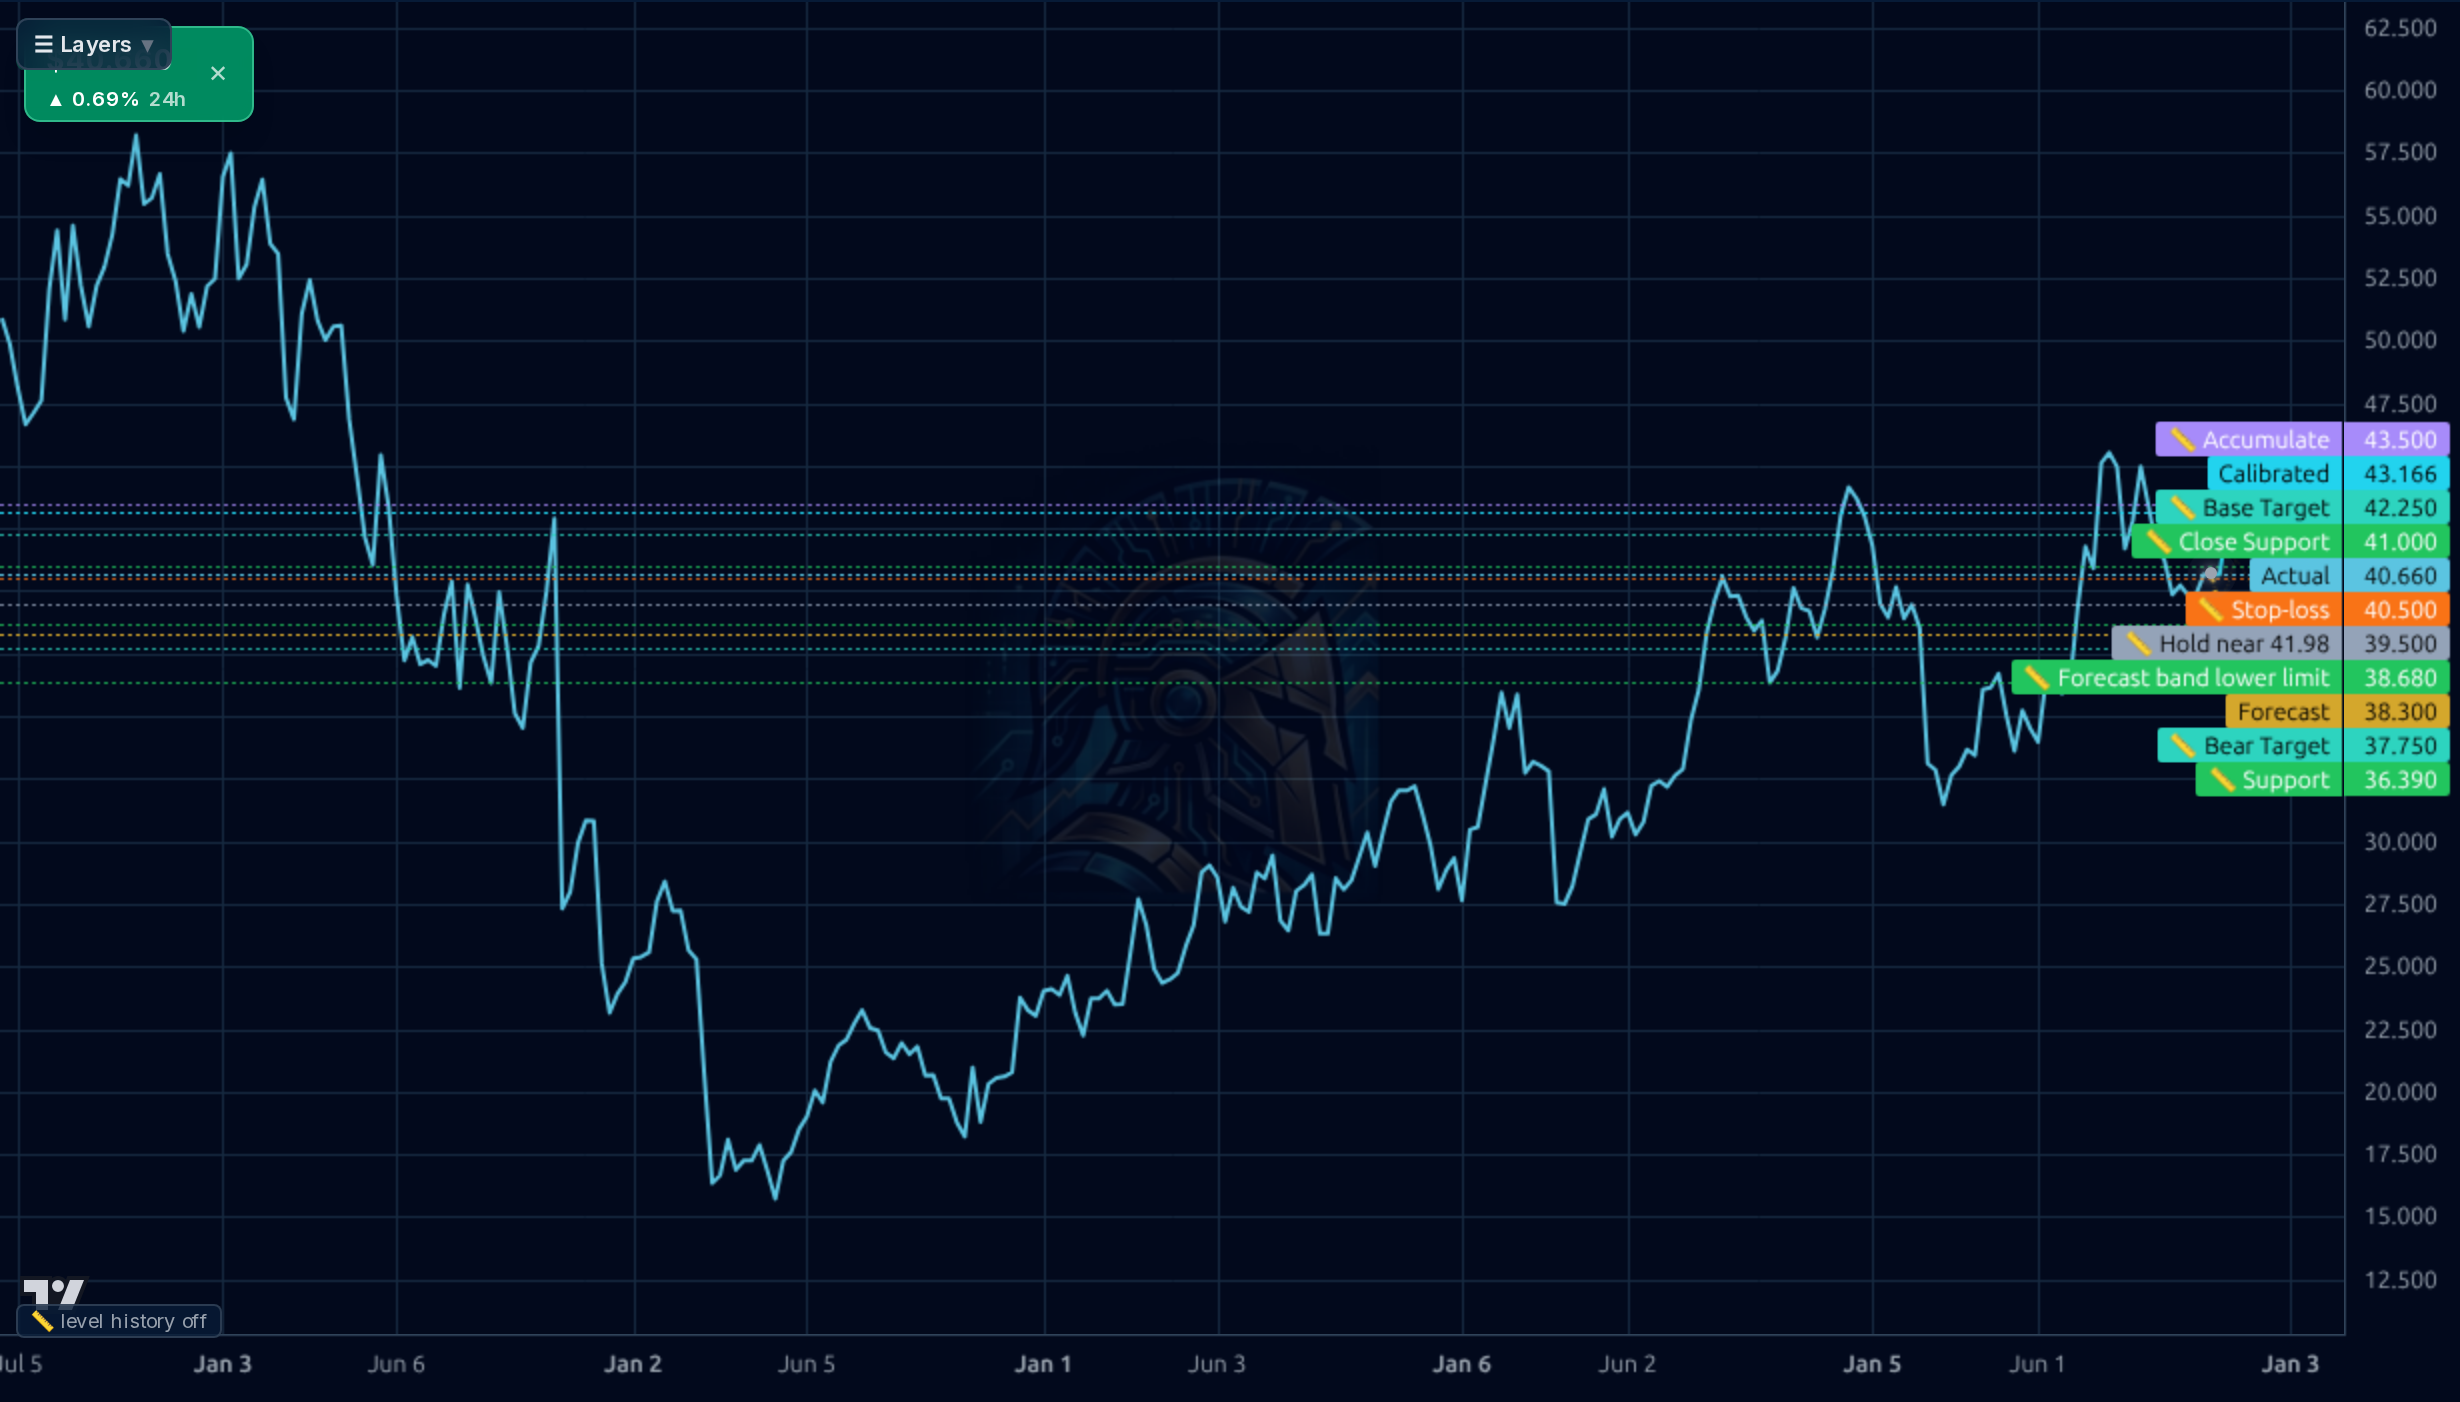
Neutral-to-cautious into earnings. Do NOT size a swing trade into the 2026-11-05 print — it is a binary gap event with IV crush. If already long, hold but size conservatively. Key levels: add on a dip to $38.60-$39.00 (forecast-band lower support), invalidate a daily close below $36.40. Upside is capped at $42 resistance until a decisive break; a break opens $43.50 (Accumulate zone). Earnings print is both the catalyst and the invalidation trigger.
Thesis: capital restoration and balance-sheet de-risking convert to shareholder value via buybacks and preferred retirement, supported by a cheap multiple (P/B 0.75x) and analyst targets near $47-$49. Expected return range: $38 (bear) to $50 (bull) over 6-12 months, base ~$45. Catalysts: buyback resumption, FIA/RILA mix expansion, rate tailwinds on new-money yields, and a likely Nov earnings beat given the 'history of earnings surprises.' What would change my mind: a return to negative net margins or further FCE deterioration would undermine the re-rating and push toward the $35-$37 zone.
Terminal thesis: LNC is a capital-cycle play — if the pivot to spread-based, less market-sensitive annuity products succeeds and leverage stays contained, the stock could re-rate toward 1.0x P/B (~$54+) as earnings normalize. Multi-year drivers: fixed indexed annuities, RILA pricing power, and disciplined capital allocation. Biggest structural risk: residual variable-annuity and market sensitivity plus interest-rate/credit-spread sensitivity that can compress spreads; execution risk on the re-rating thesis remains the dominant swing factor.
Revenue is healthy at ~$20.7B TTM with strong Q2 FY2026 growth (+19.4% Q/Q), and net margins recovered to 29.1% in the June quarter. However, earnings quality is fragile: the March quarter posted a negative net margin (-3.2%) and TTM free cash flow is negative (~-$558M), which directly undercuts the optimistic buyback thesis. The balance sheet is the core story: equity is thin at ~$11.3B on ~$430B assets, D/E is ~0.60x (leverage elevated for an insurer), but RBC ratio sits above the 420% target and holding-company liquidity exceeds $900M, framing a 'repair to optimization' shift. ROE (22.6%) and ROIC (13.2%) are respectable, and the company is retiring expensive preferreds ahead of the Dec-2027 Series D call. What's working: capital restoration, leverage de-risking, and a deliberate pivot to spread-based FIA/RILA products (~2/3 of annuity sales). What's broken: volatile/negative FCF and reliance on non-recurring reinsurance deals for balance-sheet improvement.
On the 1-week chart the stock rallied from the mid-$30s to a 52-week high near $47.67 and is now consolidating around $40.66, just below the 'Base Target' / 'Calibrated' zone at $42.12-$42.50. That $42 level is the critical overhead resistance; it has been tested repeatedly and remains unbroken (resistance above price). Immediate support sits at the 'Close Support' level near $41.00, then the forecast-band lower bound at ~$38.60-$38.80, with the $36.40 'Support' as the line in the sand. The model's forecast band is compressed at $38.30-$40.66, implying limited near-term directional conviction. Momentum is neutral (RSI 49), price is +0.67% above SMA20 but -2.67% below SMA50 and +4.29% above SMA200, signaling a choppy base rather than a clean uptrend. Critically, the model's 1d directional accuracy (50%) and 1wk accuracy (17%) both lose to naive baselines, so the forecast lines should be heavily discounted heading into earnings.
Signal: Analyst price targets have converged near $47-$49 (Wells Fargo Overweight PT $54, Barclays Overweight PT $45, consensus ~$47.83), reflecting a value/capital-restoration bull case; management reports leverage and FCF-conversion targets met a year early, buyback resumption is anticipated, and the business is pivoting to capital-light spread-based annuities. Bear counterweight: J.P. Morgan cut its target to $47 (Underweight), and consensus points to declining 2026 EPS (~$7.72-$7.97, roughly -3%). Noise: the 'Bold Starts' youth financial-education program (Oct 27) is a CSR item, not a value driver; Robeco's 73.8% stake increase is a routine institutional flow. The dominant theme is capital flexibility and valuation, not earnings growth. Earnings on 2026-11-05 (~6 days out) is the key binary event.
- Pivot to spread-based annuities (FIA/RILA now ~2/3 of annuity sales) to reduce market sensitivity and stabilize earnings quality.
- Anticipated buyback resumption in/after 2026 and accelerated capital return in 2027-2028 once FCF conversion holds.
- Retirement of expensive preferred shares ahead of the Dec-2027 Series D call, improving the capital structure.
- Higher new-money yields on the general account supporting spread income, the primary driver of annuity profitability.
- Strong revenue momentum (+19.4% Q/Q in Q2 FY2026) indicating underlying demand across segments.
- Negative TTM free cash flow (~-$558M) and volatile quarterly FCF directly contradict the buyback thesis.
- Persistent negative net margins in the March quarter signal unresolved underwriting/expense issues.
- Elevated leverage (D/E ~0.60x, above industry average) increases sensitivity to rising rates and economic slowdowns.
- Over-reliance on non-recurring reinsurance deals for balance-sheet improvement.
- Imminent binary earnings event (2026-11-05) with high gap/IV-crush risk and uncertain direction.
- Interest-rate and credit-spread widening could compress spreads and margins.
- Diverged analyst views (J.P. Morgan Underweight vs. Wells Fargo/Barclays Overweight) and wide target dispersion ($35-$57).
Get AI analysis on any stock
This is one of hundreds of Kronos AI reports — scored fundamentals & technicals, bull/base/bear price targets, a multi-horizon plan, and continuously-updated forecasts across the market. Create a free account to explore them all.
Create your free account →Already a member? Sign in · Join our Discord