LPL — AI Stock Forecast & Price Targets
Published 6/16/2026 · A free sample of K3vl4r’s AI-powered analysis.
Kronos price forecasts, scored fundamentals & technicals, and a multi-horizon plan.
View the live LPL price forecast →
LG Display (LPL) is a structurally challenged display panel maker showing tentative operational recovery but still posting net losses, carrying ~13.8T KRW in debt against negative working capital. Near-term Kronos forecasts are mixed (bullish 1h to 5.21, but 4h/1d project a slide to 3.40-3.70), and with shares at 4.73 — near analyst target 5.13 and forward P/E of 7.3x (Finviz) vs 44.9x (Yahoo) showing wide earnings uncertainty — the risk/reward favors patience.
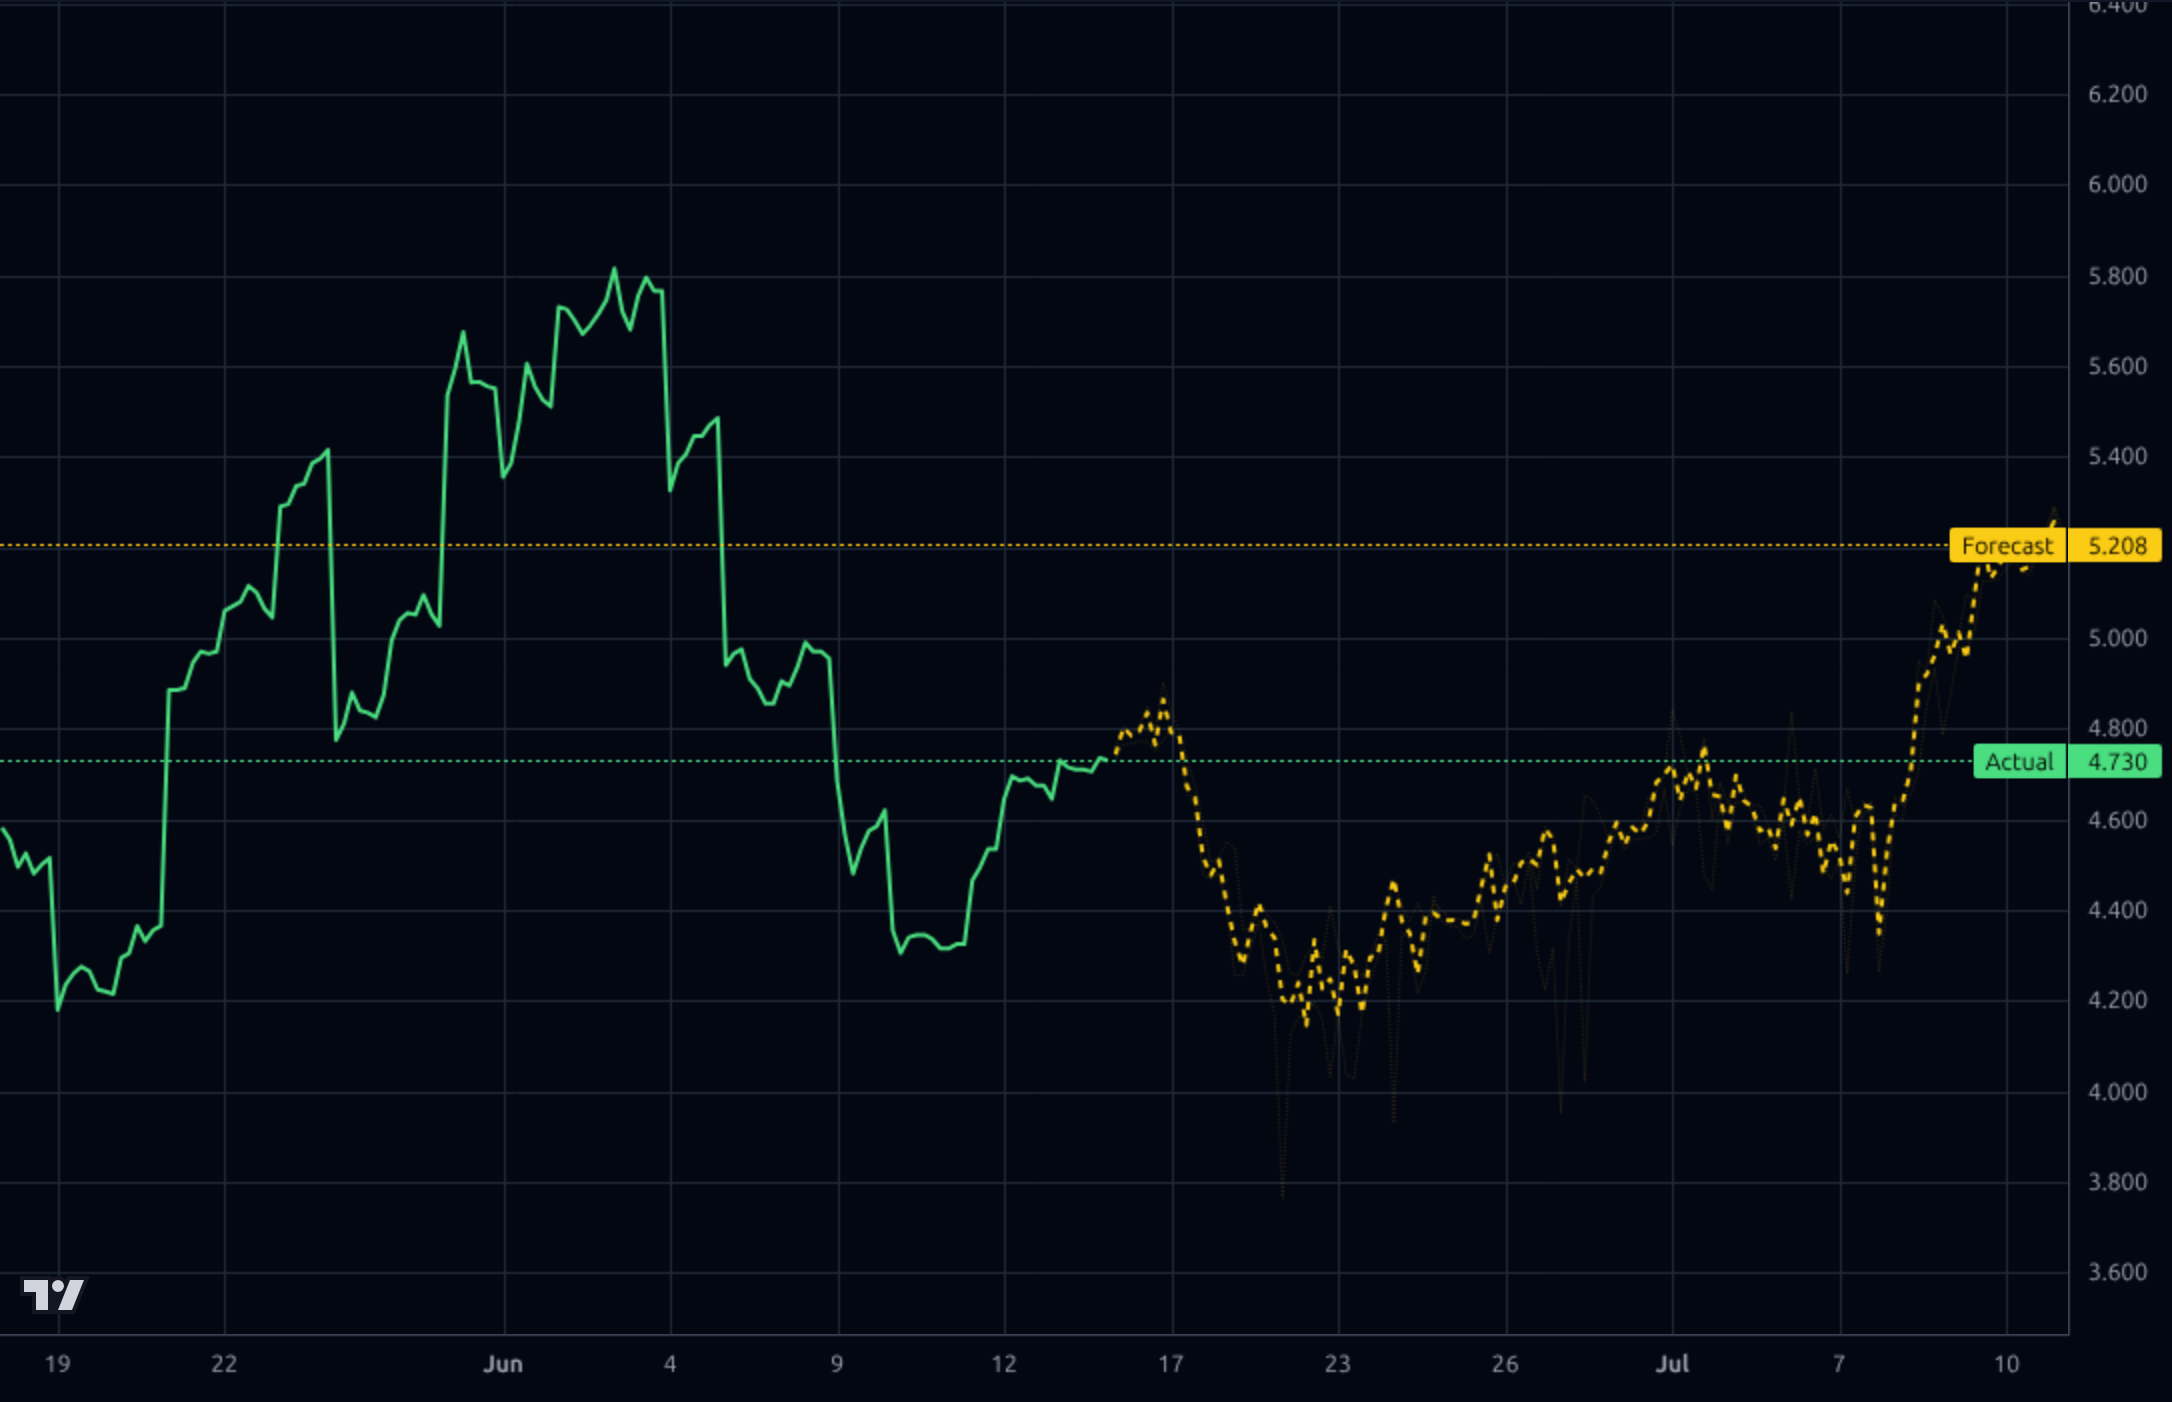
1-4 weeks: Neutral to mildly constructive. The 1h Kronos forecast points to 5.21 and price has reclaimed the 4.73 level. A tactical long could be considered on a hold above 4.60 with a target of 5.20-5.40 and a stop below 4.40 (invalidates the bounce). Keep size small (1-2% portfolio) given low directional accuracy of the model and the bearish 4h/1d outlooks. If 4.40 breaks, stand aside.
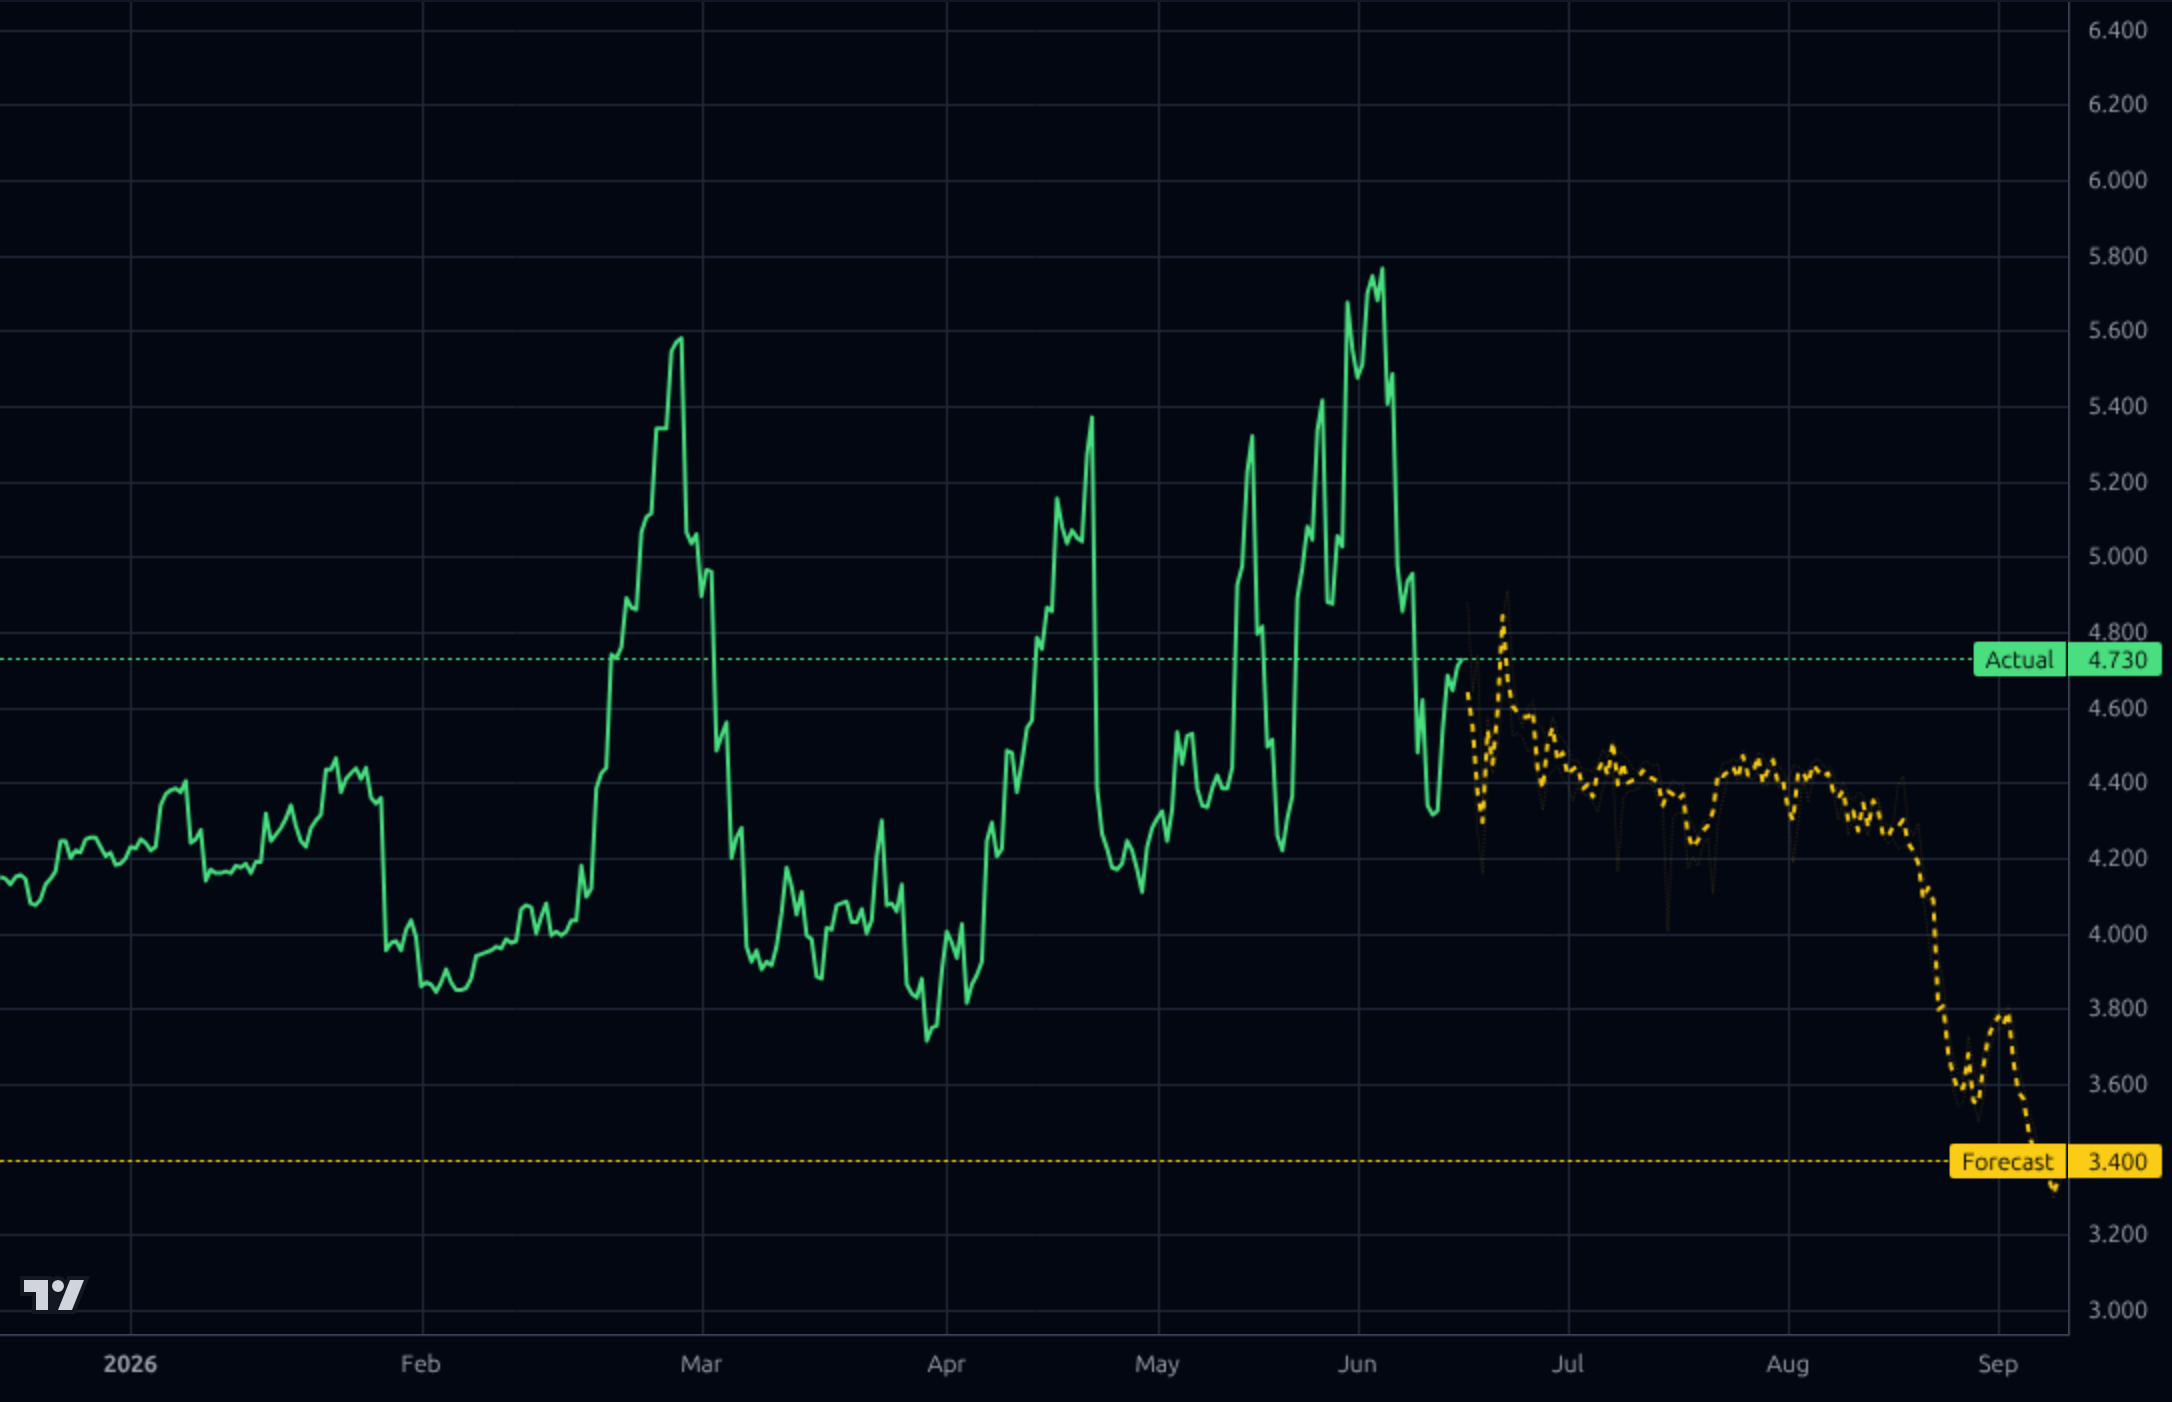
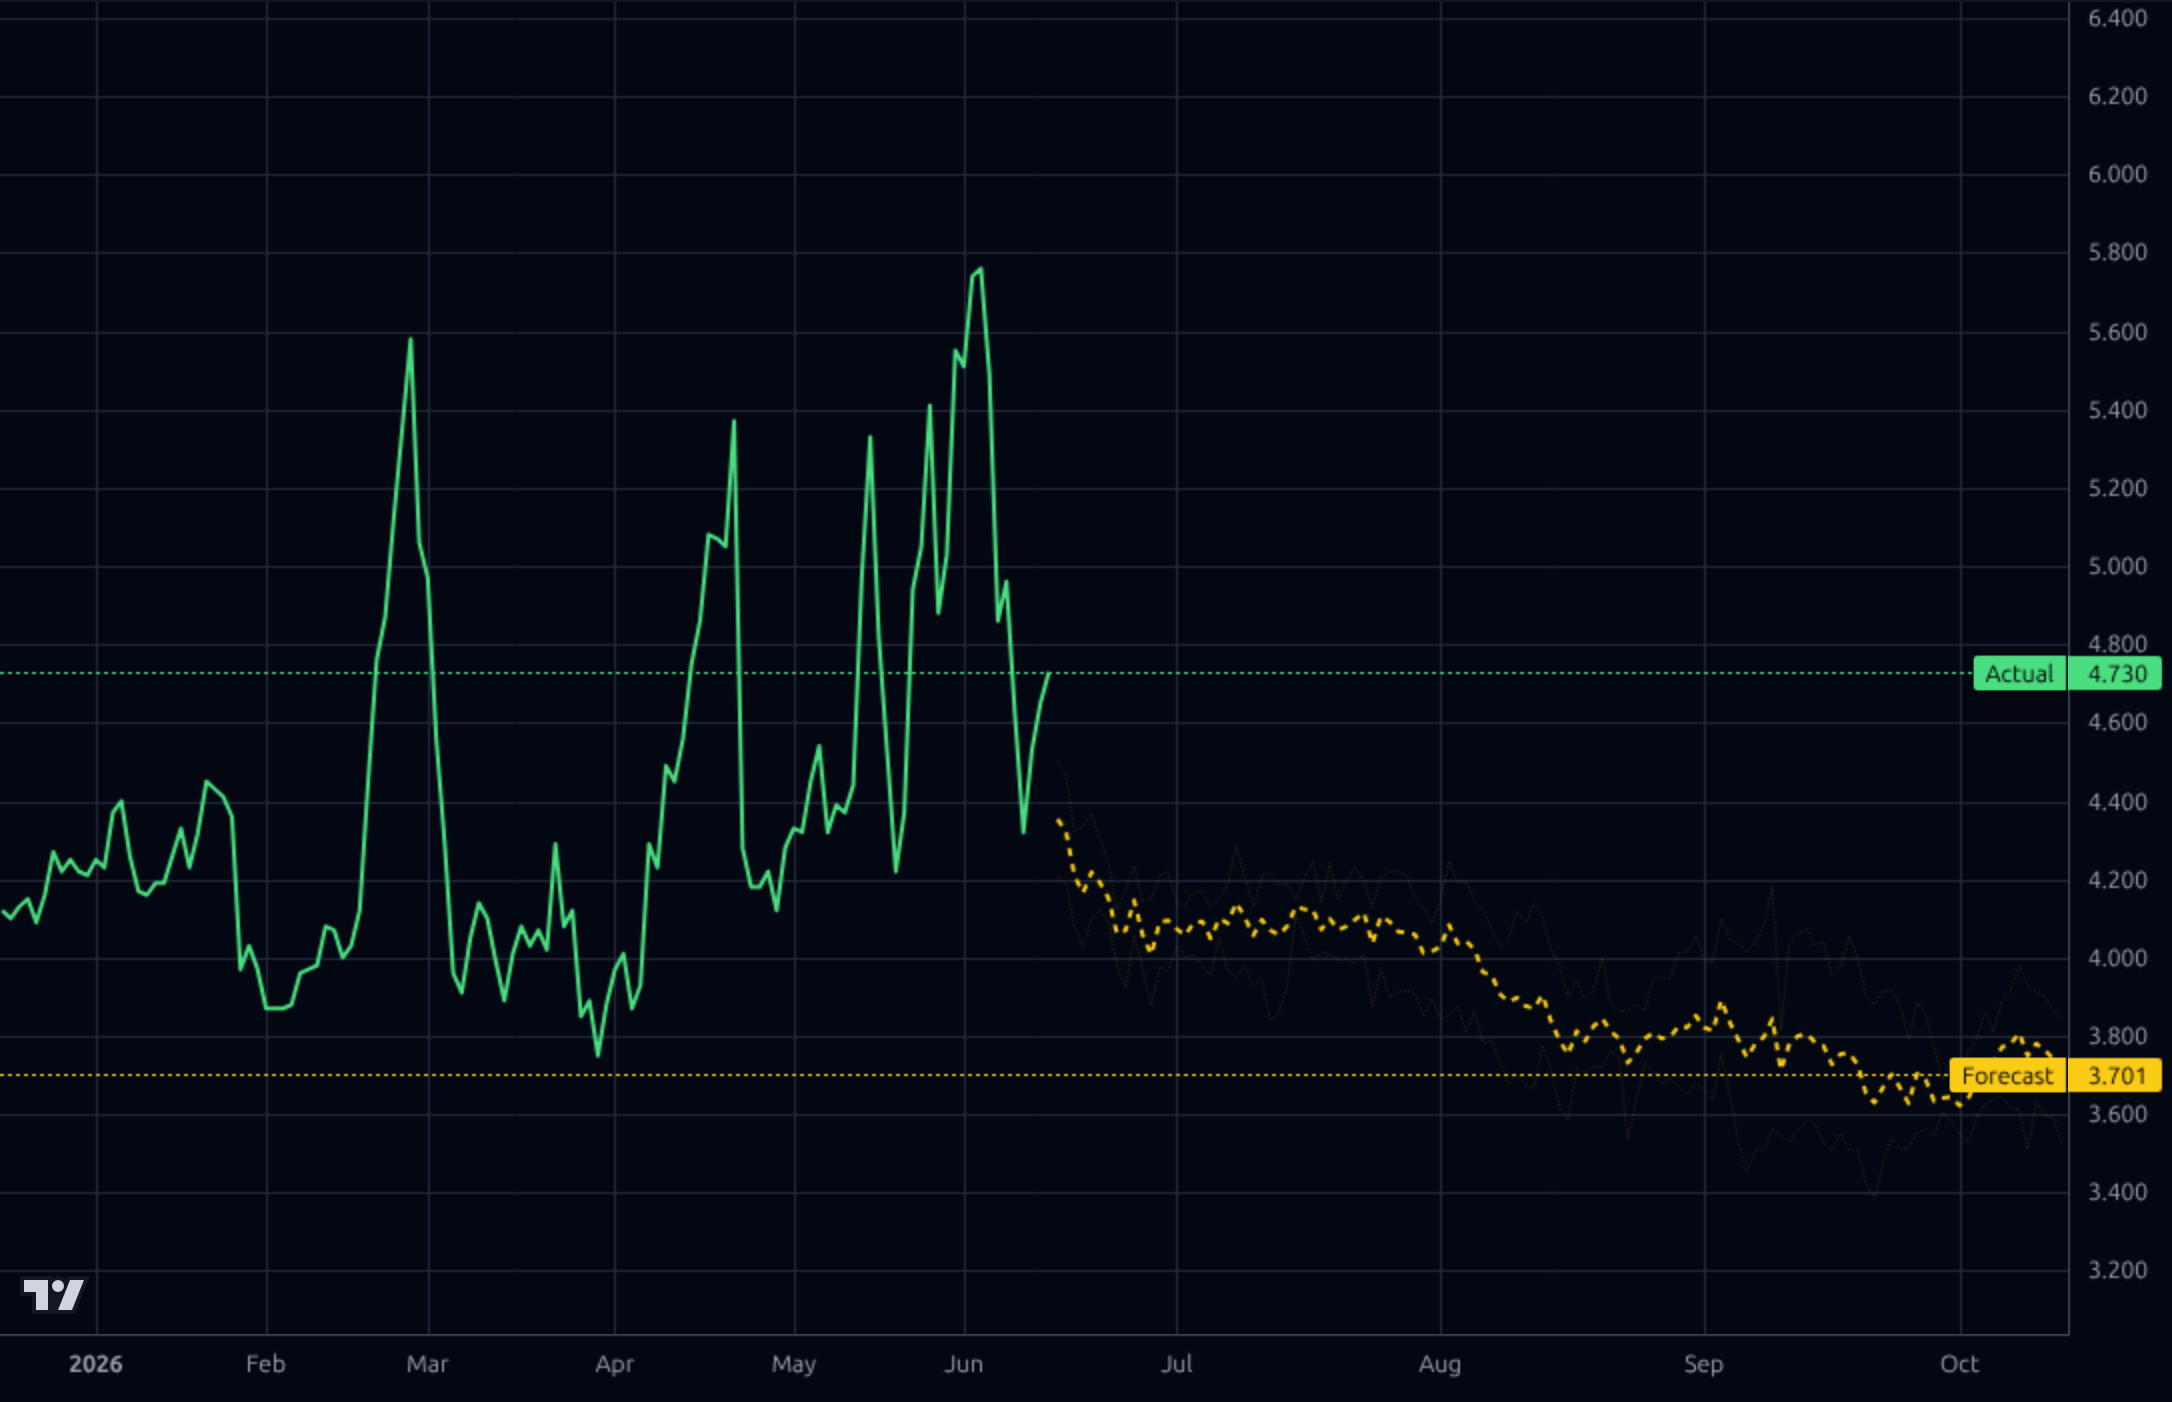
1-6 months: Hold/cautious. The 4h and 1d forecasts call for a drift to 3.40-3.70, which aligns with seasonal panel weakness and the recent revenue rollover (Q1 2026 -23% Q/Q). Expected return range -25% to +10%. Catalysts that would change the view: a return to consistent positive FCF, OLED mix exceeding 60% of revenue, or a strategic partnership/divestiture that materially deleverages. A break below 4.20 likely opens 3.30 retest.
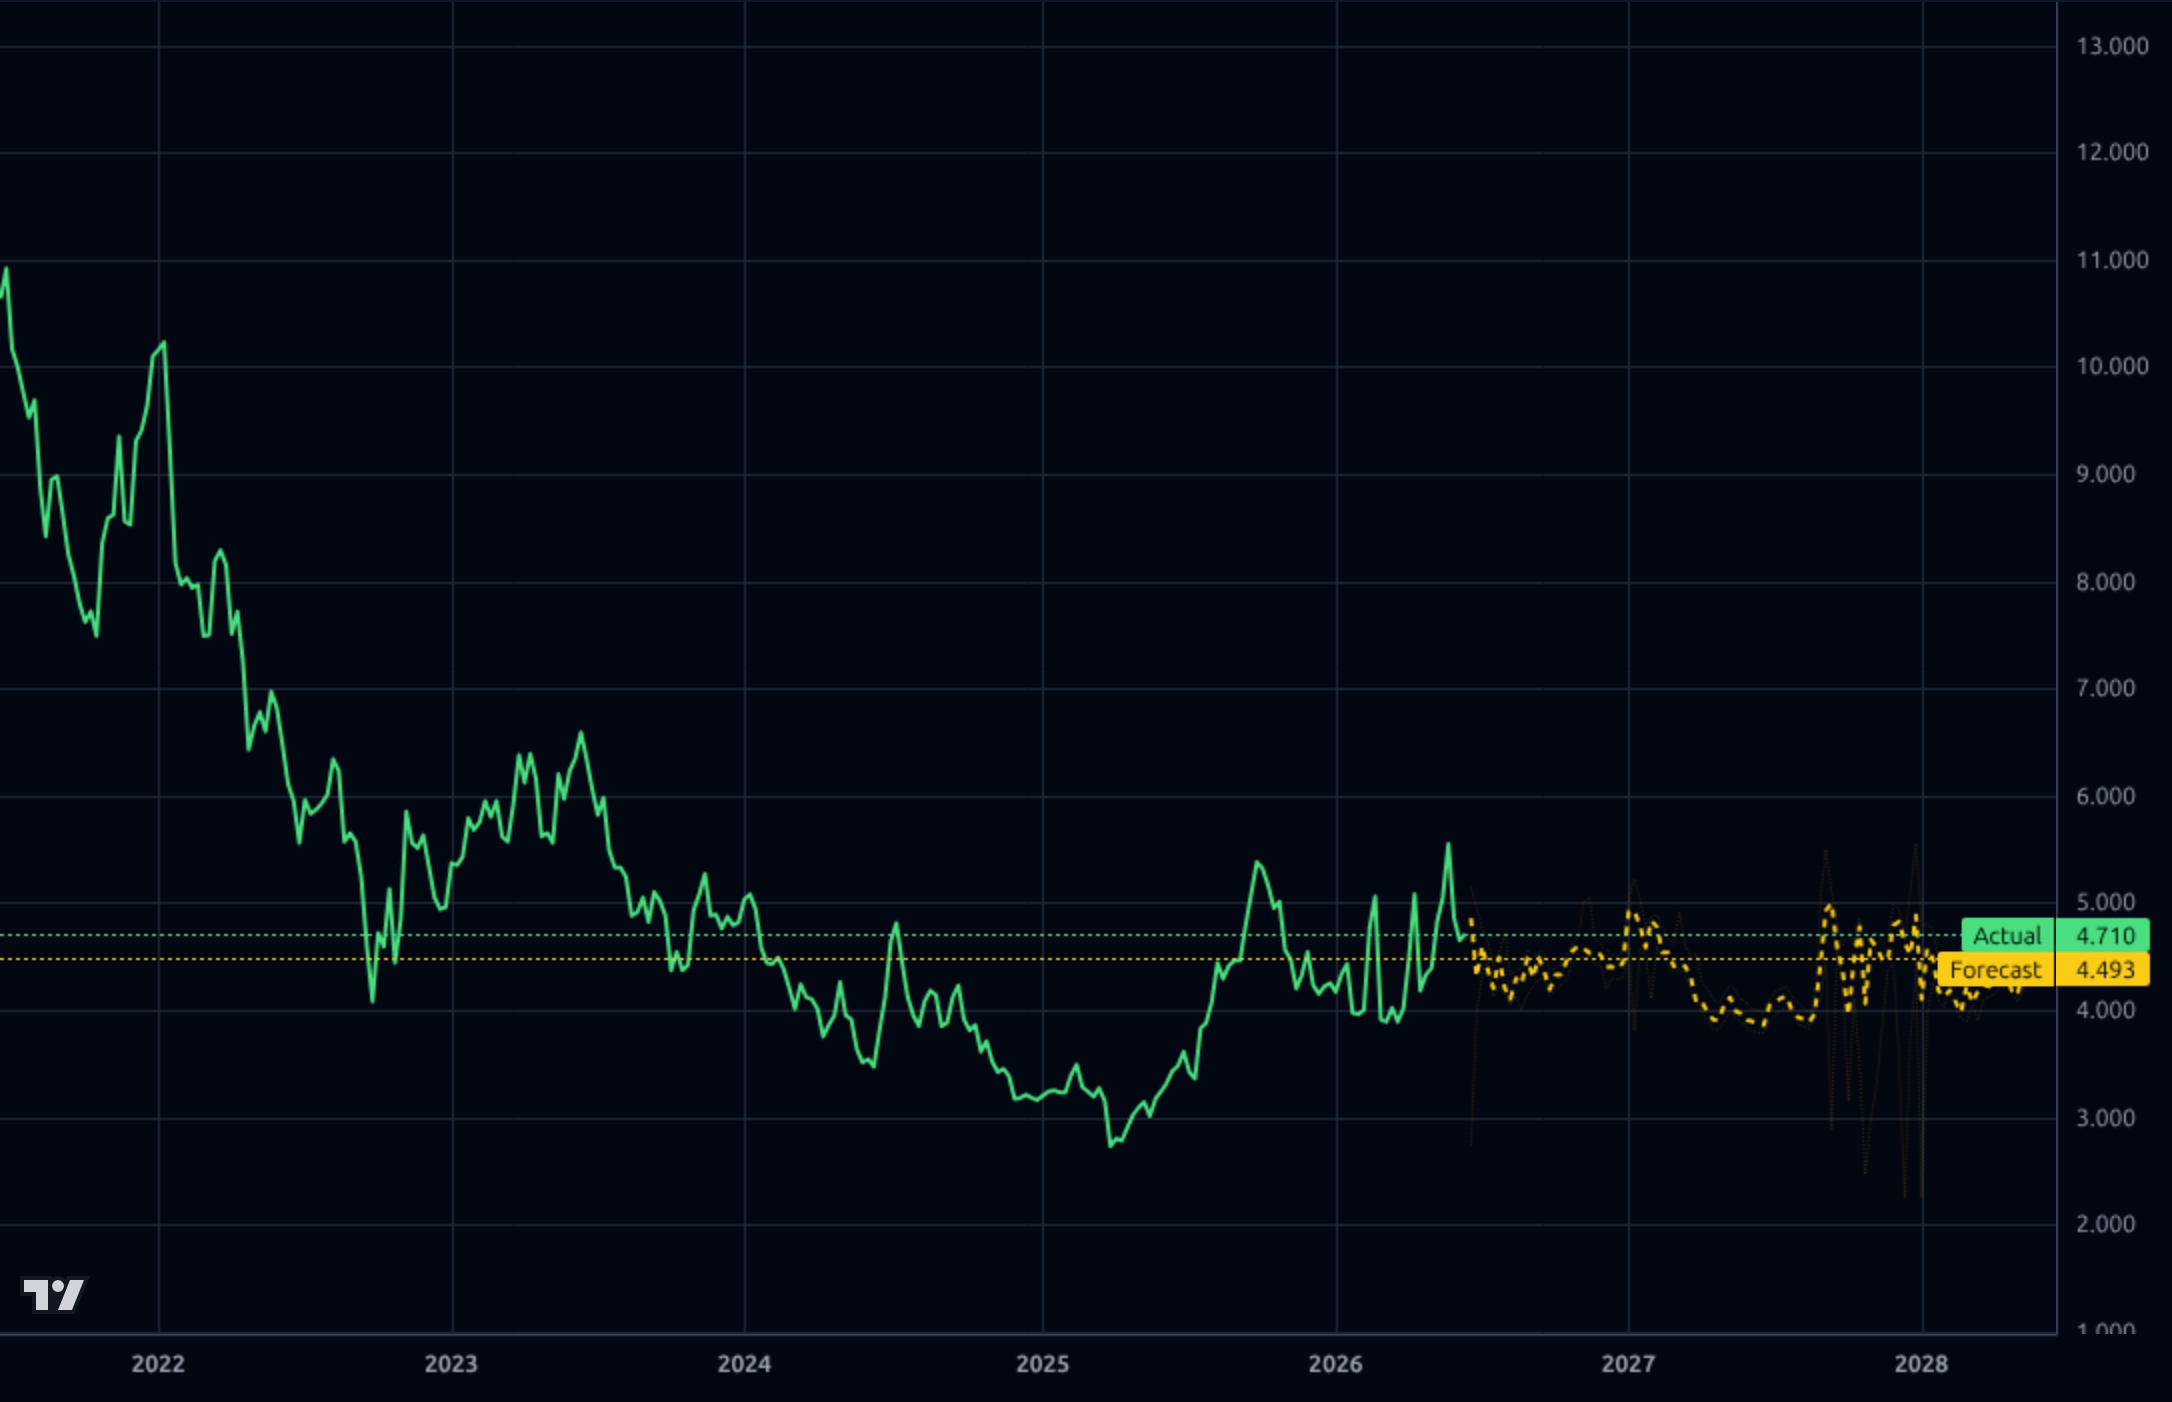
1-3 years: Speculative value. Forward P/E of 7.3x and P/B of 1.12 are cheap if OLED transition succeeds and TV-panel oversupply normalizes. Multi-year drivers: automotive OLED, IT OLED penetration (notebook/tablet/monitor), and LG's exit from LCD. The biggest structural risk is Chinese competitive intensity (BOE, CSOT) compressing OLED margins the same way it destroyed LCD economics — and a debt load of 13.8T KRW that leaves little margin for another down-cycle. Only suitable for investors with high cyclical risk tolerance.
Revenue is deteriorating: Q1 2026 revenue of 5.53T KRW is down from 7.20T in Q4 2025 and the TTM sales decline is -9.9% Y/Y. Profitability remains weak — Q1 2026 net loss of -571B KRW (net margin -10.3%), operating margin a thin 2.65%, and TTM ROE of -0.77% / ROA -0.16%. Gross margin around 13.4% reflects ongoing commoditization pressure in LCD even as OLED mix grows. The balance sheet is the biggest red flag: total debt 13.80T KRW vs cash 1.52T, debt/equity 2.14x (LT D/E 1.38), current ratio 0.73 and working capital of -2.57T KRW — liquidity is tight. Free cash flow swung negative again in Q1 2026 (-730B KRW) after a positive Q4, and capex remains heavy (~600B/quarter), reflecting the ongoing OLED capacity build. PEG of 0.11 and forward P/E of 7.28 look optically cheap, but only if the projected EPS recovery (EPS next Y +502%) actually materializes — the trailing EPS is still -0.05. Capital allocation has prioritized survival over shareholder returns; no dividend since 2021.
Across timeframes the picture is mixed. The 1h chart shows price recovering from a mid-June low near 4.20 back to 4.73, with Kronos forecasting continuation toward 5.21 — a bullish near-term setup with the actual line tracking the forecast band reasonably well. However, the 4h and 1d Kronos forecasts diverge sharply bearish, projecting a slide to 3.40 (4h) and 3.70 (1d) into Aug-Oct, which would retest the 52-week low of 3.30. Weekly chart shows price has been base-building between 3.00-5.80 since 2024 after the catastrophic 2022-2024 decline from ~11.00; the 4.49 weekly forecast suggests range-bound consolidation. Key levels: support 4.20 then 3.30 (52w low); resistance 5.20-5.40 then 5.83 (52w high). RSI 48.25 is neutral, SMA20 -4.58% (short-term weak), SMA50 +0.78% and SMA200 +4.28% (longer trends modestly constructive). Reported model directional accuracy of 0 on the 30d window is a caution flag — treat forecasts as scenarios, not signals.
No company-specific headlines were provided in the dataset, so the analysis rests entirely on price action and financials. The absence of news is itself informative: LPL is not currently a momentum or catalyst story, and the +42.5% one-year performance combined with +12.4% YTD reflects sentiment recovery from deeply oversold levels rather than fundamental inflection. Without fresh disclosures, the key watch items remain the next earnings (Apr 23 BMO per snapshot — appears stale relative to fetched_at June 2026), OLED panel pricing trends, Apple/Samsung order flow commentary, and any further capital raise or asset sale announcements given the strained balance sheet.
- OLED transition: gross margin expanded from 9.1% in Q2 2025 to 16.4% in Q3 2025 before slipping back, suggesting OLED mix shift is beginning to lift profitability when utilization is healthy
- Automotive display: industry positions LPL as a leader in automotive OLED — a higher-margin niche less exposed to commodity panel pricing
- IT OLED expansion: rising notebook/tablet OLED adoption (Apple iPad Pro, MacBook roadmap) is a multi-year volume driver implicit in the +502% EPS next year estimate
- Capex of ~600B KRW/quarter sustains OLED capacity build-out, with FCF expected to inflect if revenue stabilizes above 6T KRW/quarter
- Balance sheet stress: 13.80T KRW debt, current ratio 0.73, working capital -2.57T KRW — limited margin of safety in another downturn
- Persistent net losses: -571B KRW in Q1 2026; TTM EPS -0.03; ROE -0.77% — turnaround is not yet proven
- Chinese competition (BOE, CSOT, Visionox) replicating the LCD margin compression playbook in OLED
- Kronos 4h and 1d models project a decline to 3.40-3.70, near 52-week low of 3.30 — meaningful downside risk on stated AI scenarios
- Cyclical demand: TV/IT/smartphone panel demand softness; Sales Y/Y TTM -9.9%
- Wide forward earnings dispersion (Forward P/E 7.28 Finviz vs 44.9 Yahoo) signals high analyst disagreement on 2026 EPS
- Reported model directional accuracy of 0 on recent 30d window — forecasts should be weighted accordingly
- Low institutional ownership of 4.41% suggests limited 'smart money' conviction
Get AI analysis on any stock
This is one of hundreds of Kronos AI reports — scored fundamentals & technicals, bull/base/bear price targets, a multi-horizon plan, and continuously-updated forecasts across the market. Create a free account to explore them all.
Create your free account →Already a member? Sign in · Join our Discord