LTC-USD — AI Stock Forecast & Price Targets
Published 8/5/2026 · A free sample of K3vl4r’s AI-powered analysis.
Kronos price forecasts, scored fundamentals & technicals, and a multi-horizon plan.
View the live LTC-USD price forecast →
LTC-USD trades at $44.87, coiled just below the well-established $45-$46 resistance zone after multiple failed breakout attempts. The AI forecast is uniformly bullish across timeframes but its directional accuracy has been BEATEN by naive baselines on both 1d and 1wk horizons, so those signals must be heavily discounted. With no fundamental anchor, structural underperformance vs BTC, and 100% bullish retail sentiment at resistance (a classic fade setup), the risk/reward favors HOLD with a tactical bias to fade strength above $46 and accumulate only on retests of $40-$42.
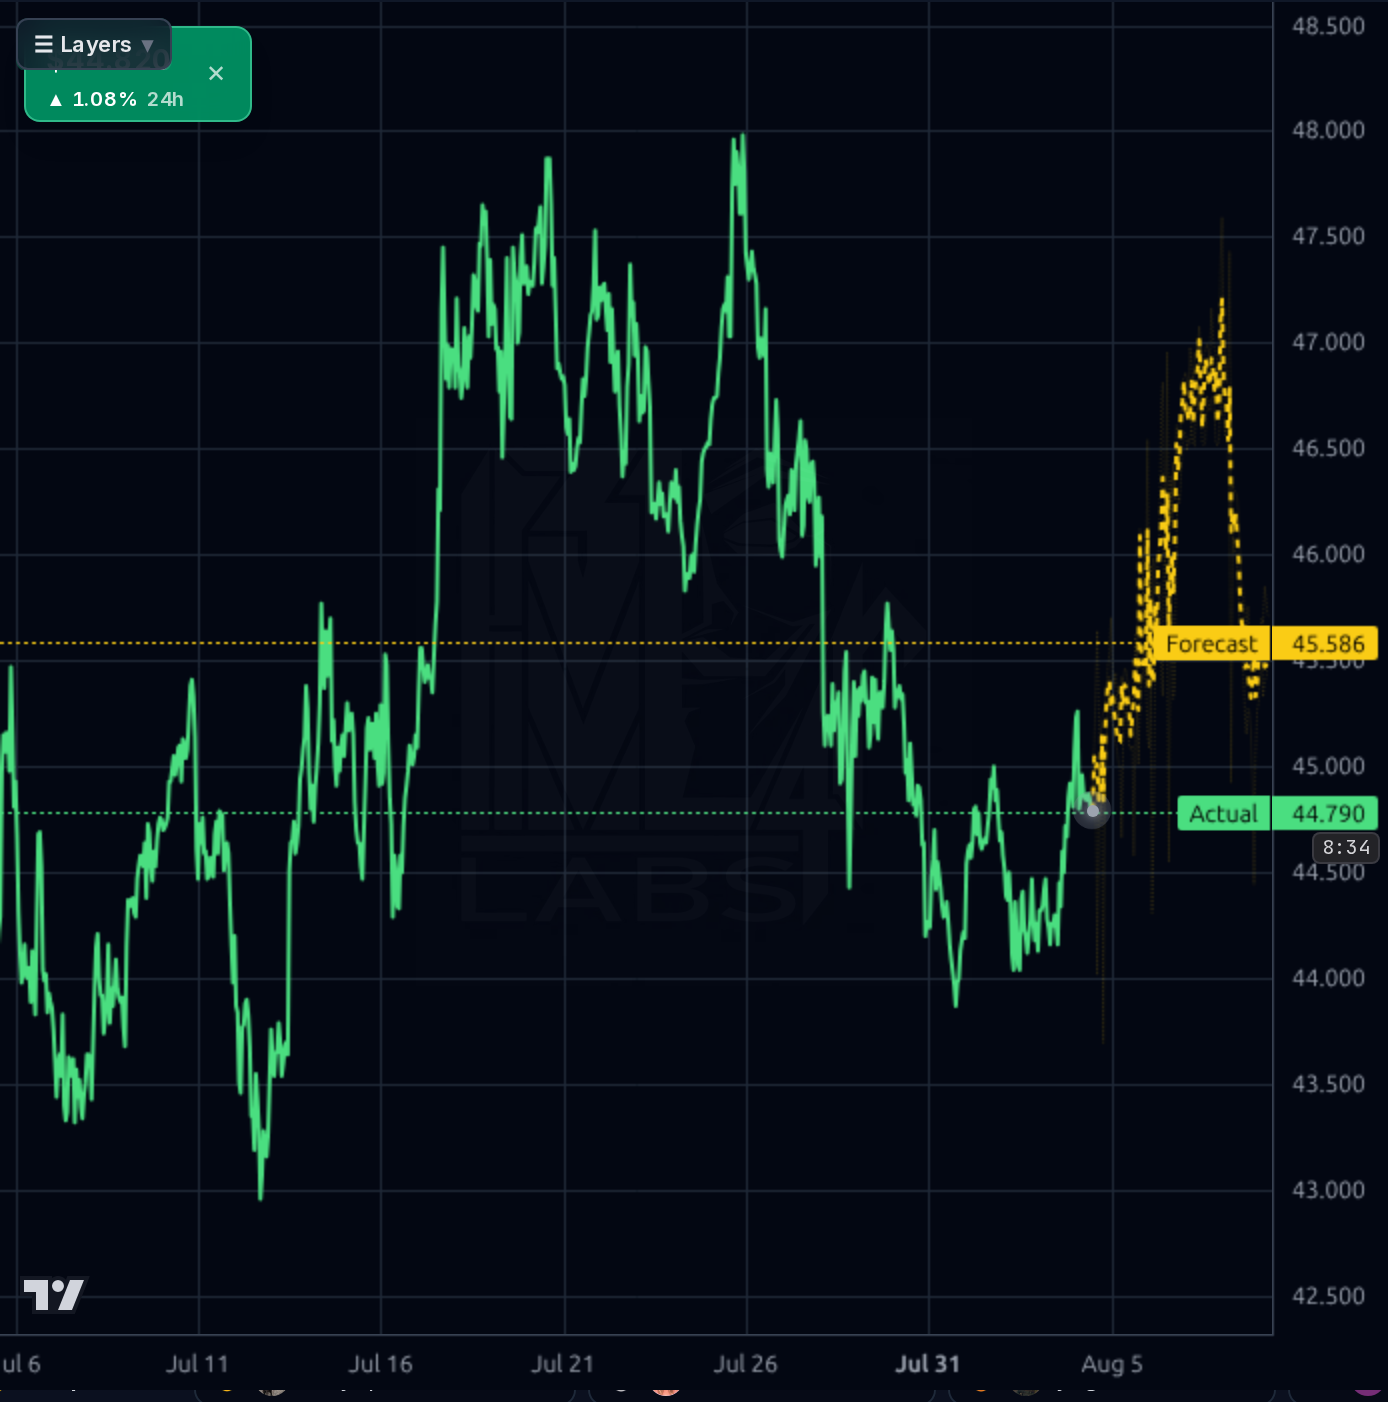
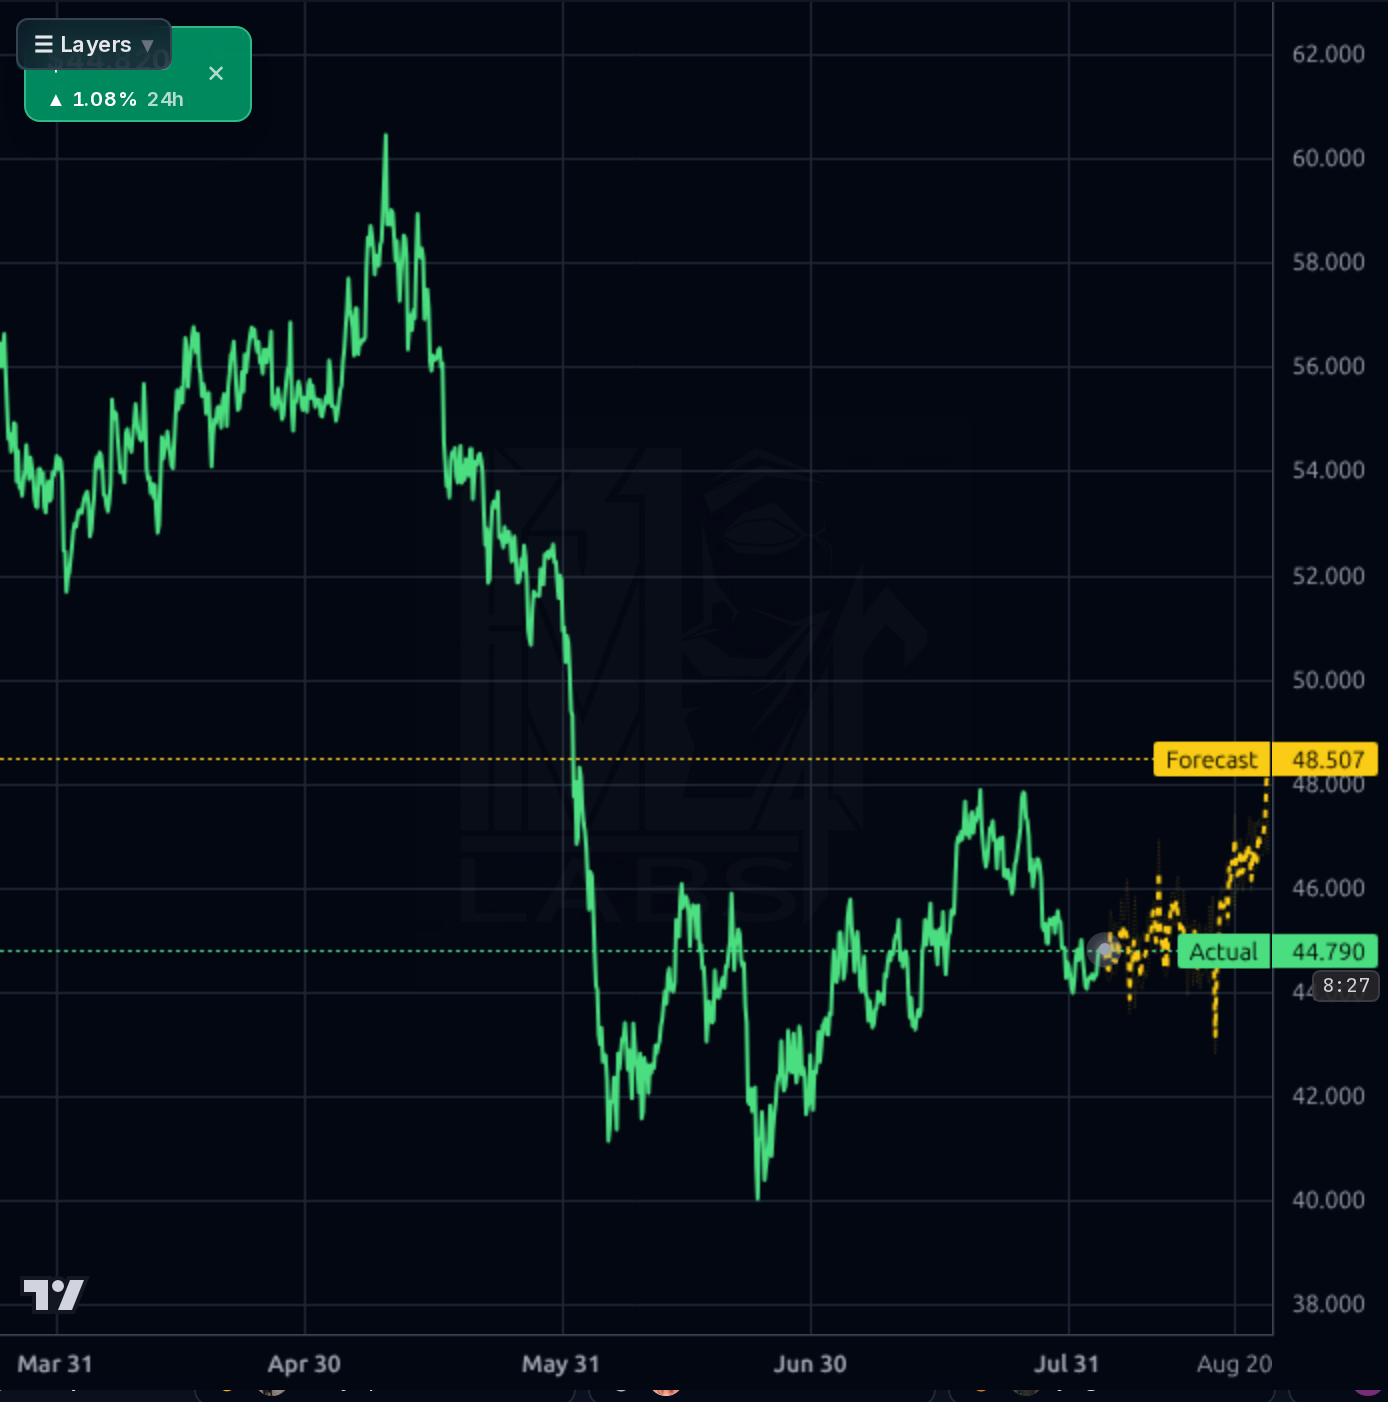
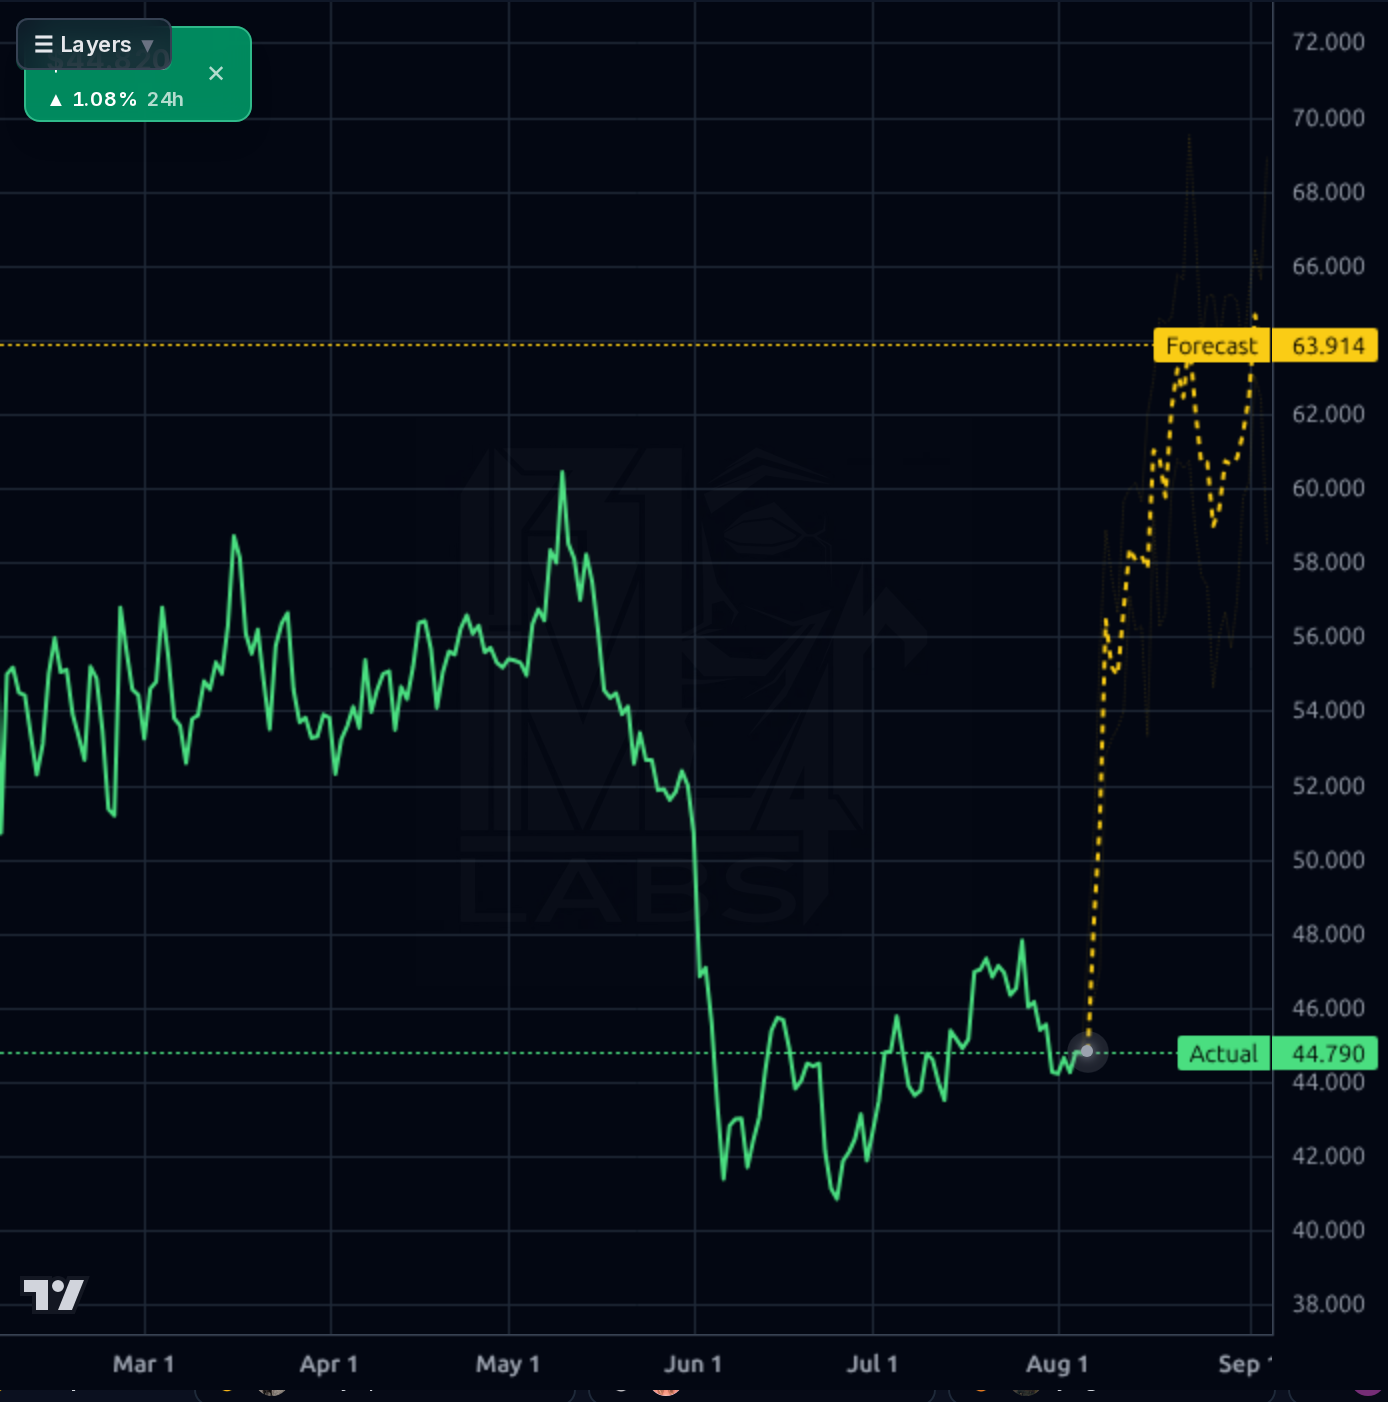
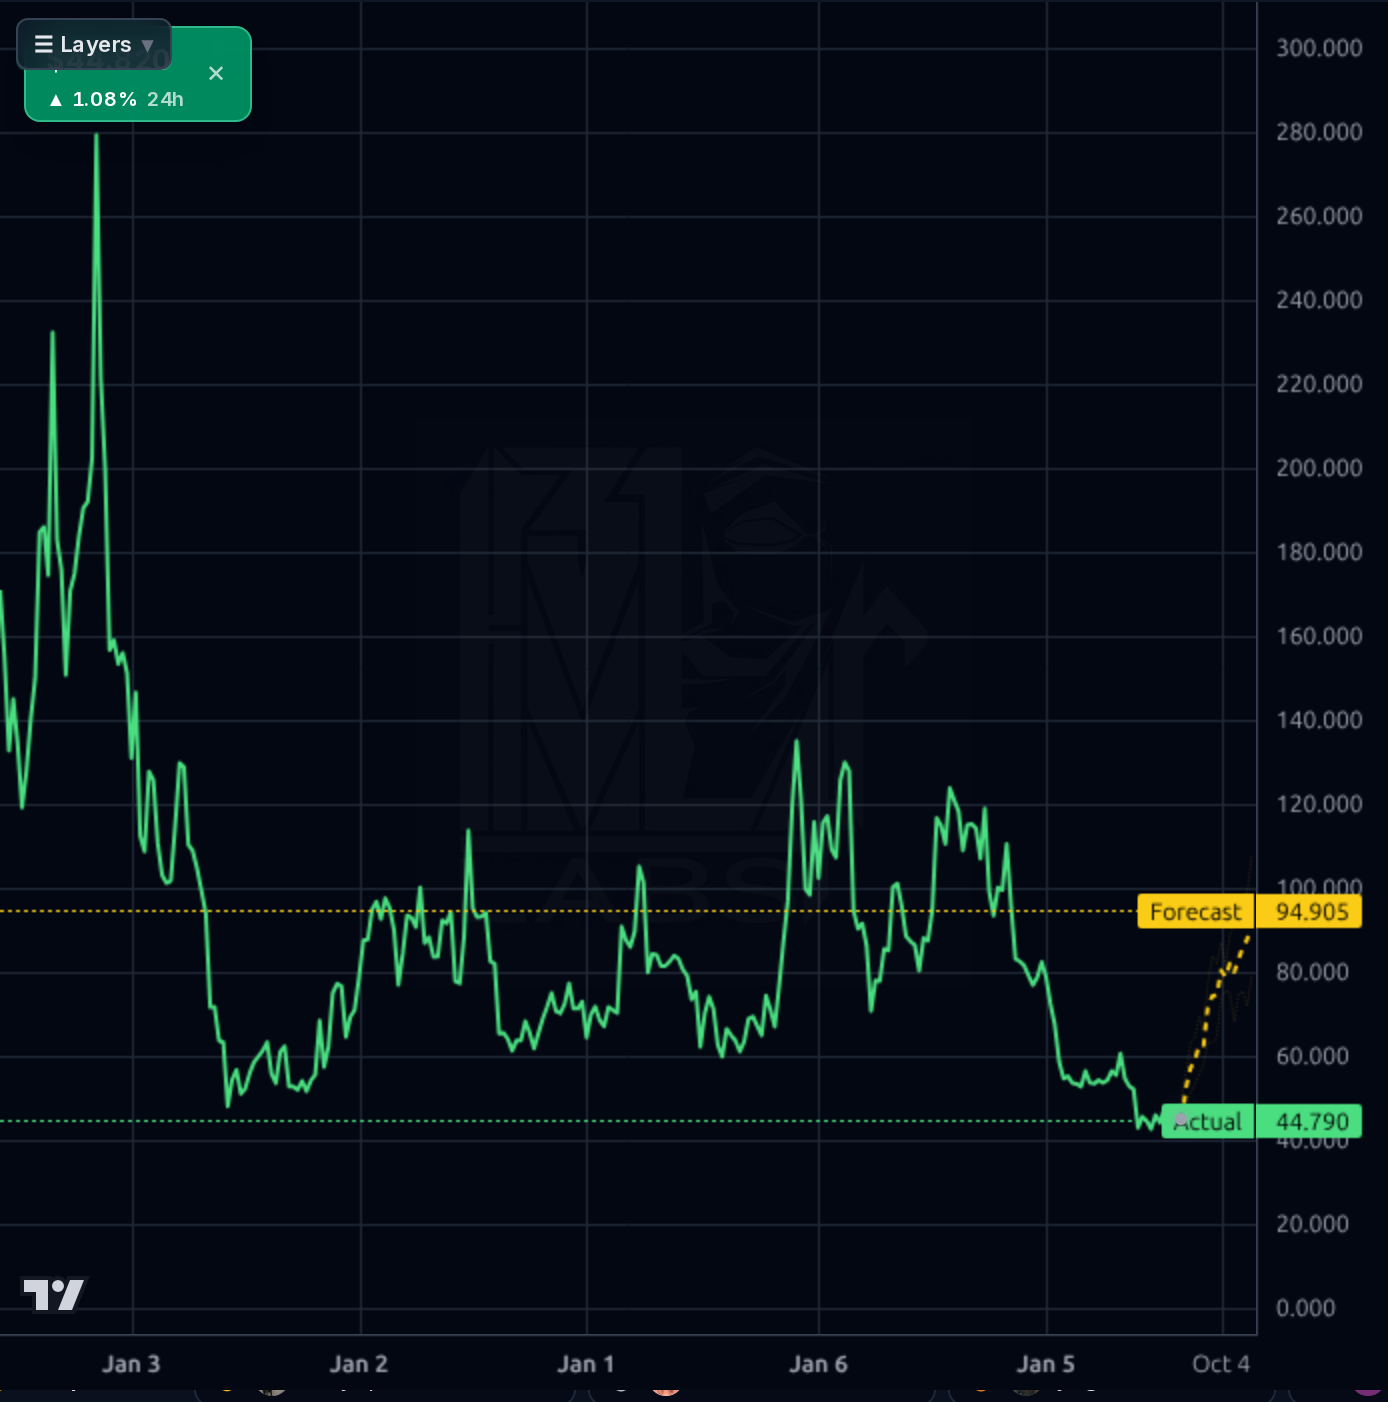
1-4 week view: HOLD/tactical fade. Price is coiled at $44.87 just below the $45.5-$46 resistance shelf that has capped every rally in 2026. If LTC prints above $46 on real volume, wait for a retest — don't chase into 100% bullish retail sentiment. Preferred entry: accumulate on a flush toward $42-$43 with a stop below $40. Invalidation for a bearish tilt: clean weekly close above $47 opens $50-$52. Sizing: small tactical only; this is high-beta altcoin exposure, not core.
1-6 month view: base case is continued $40-$50 range trading with occasional breakout attempts fading back. Bull path requires (1) BTC breaking to new highs pulling LTC beta, (2) Grayscale ETF conversion approval producing real inflows, and (3) LitVM mainnet TVL traction. Bear path is a BTC correction dragging LTC back to $35-$38. Expected return range: -20% to +30%. Change my mind on the upside: LTC weekly close above $50 with rising open interest and confirmed ETF inflow data; on the downside: BTC dominance surging while LTC/BTC ratio makes new lows.
1-3 year view: terminal thesis is uncertain. Bull case leans on the July-August 2027 halving accumulation narrative and LitVM turning LTC into a meaningful smart-contract host — targets $100-$180 in a full crypto bull cycle. Bear case is structural obsolescence: stablecoins own payments, EVM chains own smart contracts, and LTC becomes a legacy PoW asset with a shrinking narrative. Biggest structural risk is loss of relevance — a 14-year-old chain competing against Base, Solana, and stablecoin rails without a differentiated use case.
Traditional fundamentals do not apply — LTC is a PoW cryptocurrency with no cash flows, margins, or balance sheet to anchor valuation. What passes for 'fundamentals' here is network utility and adoption: 400M+ cumulative transactions, ~4x hashrate growth in 2026 (3.827 PH/s reported Dec 2025), and a patched MWEB exploit demonstrate network durability. Structural developments include the Canary Litecoin ETF (LTCC) launched Oct 2025, the SEC/CFTC digital-commodity classification in March 2026, and Grayscale's pending LTCN-to-ETF conversion — these are meaningful de-risking events. However, LTC remains ~89% below its $401 May 2021 ATH, developer activity has thinned versus L1/L2 competitors, stablecoins have captured the payments narrative, and honest analysis concludes BTC direction explains most of LTC's daily move. LitVM (EVM-compatible smart contracts) is an interesting optionality lever but has yet to produce material TVL. Net: no intrinsic value anchor; valuation is pure narrative and flows.
Across timeframes the picture is a coiled range near resistance. 1h chart shows a clean bounce off $44 with price consolidating just below the $45.5-$46 zone — model forecasts a push toward $47 then fade. 4h shows LTC recovering from the June $40-$41 washout, now testing the underside of the broader $45-$48 supply shelf. Daily chart shows the same $45-$46 resistance that has repeatedly capped rallies since the May breakdown from $60. Weekly chart underscores the deep multi-year drawdown from $140+ highs. The model's yellow forecast band projects bullish continuation on all timeframes (1h to 47, 4h to 48.5, 1d to 64, wk to 95), but the realized accuracy tells a different story: 1d directional accuracy is 61% vs 62% naive baseline, and 1wk is a stark 33% vs 67% naive — the model is unreliable in this regime and its optimistic bands should be treated as noise, not signal. Key levels: resistance $45.6/$47/$48, support $44/$42/$40. Momentum is coiling but has not confirmed a breakout; volume is thin per news commentary. Retail sentiment 100% bullish at resistance is a textbook fade setup on this name.
The signal in recent news: the Coldcard hardware-wallet exploit ($38M drained) is a broader custody-narrative shock that could drive flows to different-format assets but is not LTC-specific. Lite Strategy funding buybacks by selling from its LTC treasury is quietly bearish — a marquee corporate holder is a net seller, and LitVM testnet crossing 140M transactions is a positive utility data point but testnet activity ≠ real value capture. Multiple third-party price-prediction pieces flag $44-$46 as the pivotal battleground with a 72-hour test window and $47.99 as the make-or-break resistance — this aligns with the technical read. Noise: generic 'top lithium stocks' articles are ticker-collision spam ('LTC' matched Lithium tickers, not Litecoin). Broader market news items (Bloomin' Brands, CVS, Zimmer earnings guidance) and geopolitical strike headlines are irrelevant to LTC beyond generic risk-on/off backdrop. Net: news flow is mixed-to-slightly-negative when the Lite Strategy sell action is weighted properly against the LitVM testnet milestone.
- LitVM ZK-rollup EVM-compatible smart contract layer — testnet crossed 140M transactions per recent news; mainnet execution is the key catalyst
- Grayscale LTCN-to-ETF conversion pending (following the pattern that preceded BTC/ETH price expansion in 2024)
- July-August 2027 halving — supply reduction accumulation narrative is roughly one year out
- SEC/CFTC digital-commodity classification (March 2026) has already reduced regulatory tail risk and opens the door to more institutional products
- Corporate treasury adoption precedent (Lite Strategy) — though the recent buyback-via-sale action is a caution flag on that thesis
- Model forecasts are BEATEN by naive baseline on both 1d and 1wk horizons — the bullish AI band is unreliable in this regime
- 100% bullish retail sentiment at the $45-$46 resistance zone is a historically reliable fade signal on this name
- Lite Strategy funding stock buybacks by selling its LTC treasury — a marquee corporate holder is a net seller
- Stablecoins have captured the easy payments narrative; LTC is less programmable than major smart-contract L1s
- High BTC correlation means macro crypto risk-off drags LTC regardless of idiosyncratic catalysts
- Structural obsolescence: reduced developer activity vs EVM ecosystems and competing L2s
- 89% drawdown from $401 ATH illustrates how far narrative-driven assets can fall when flows reverse
Get AI analysis on any stock
This is one of hundreds of Kronos AI reports — scored fundamentals & technicals, bull/base/bear price targets, a multi-horizon plan, and continuously-updated forecasts across the market. Create a free account to explore them all.
Create your free account →Already a member? Sign in · Join our Discord